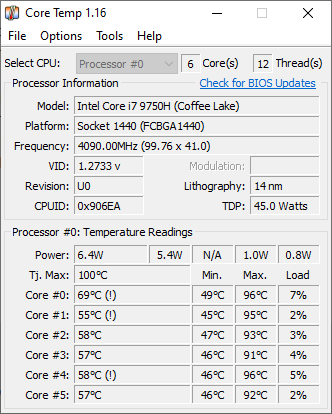
Ever since the latest update to Windows 10, I have been experiencing performance stutters (audio/video stuttering), and at one time a complete bluescreen. The update also caused my computer to rise in temperature every couple of minutes in cores 0, 1, and 4 (any temp. over 90 degrees Celcius causes a warning in CoreTemp). What can I do to fix it or make it better?
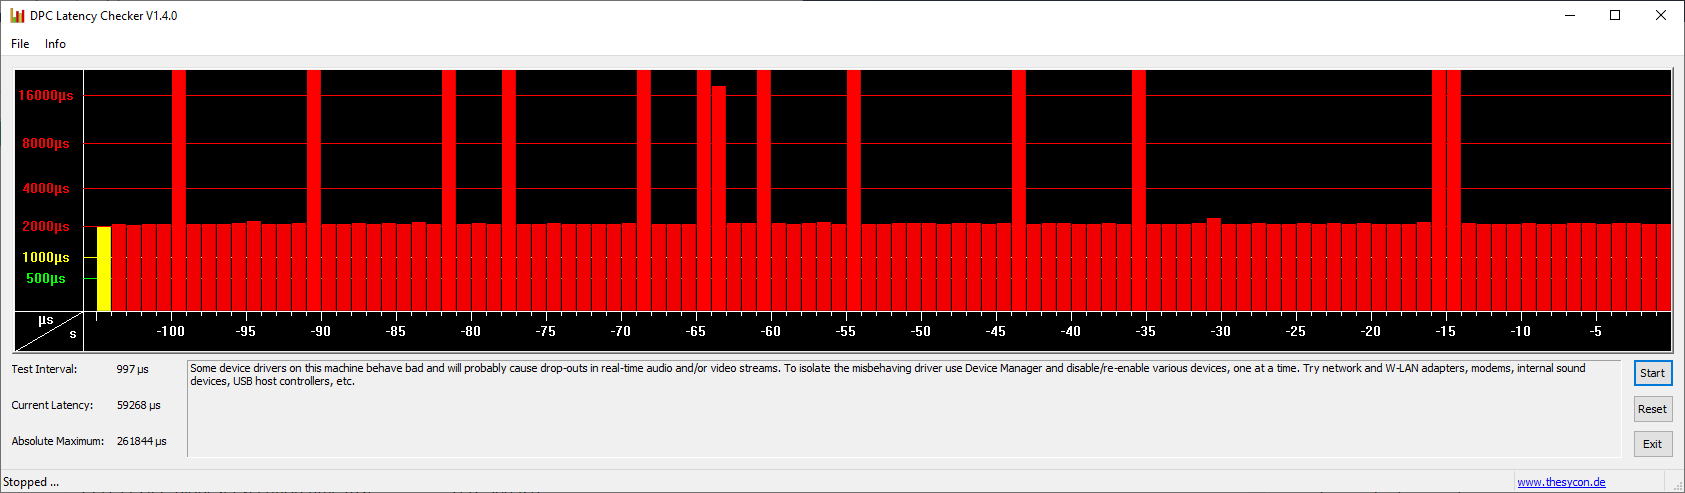
I've installed DPC Latency Checker, LatencyMon, and CoreTemp.
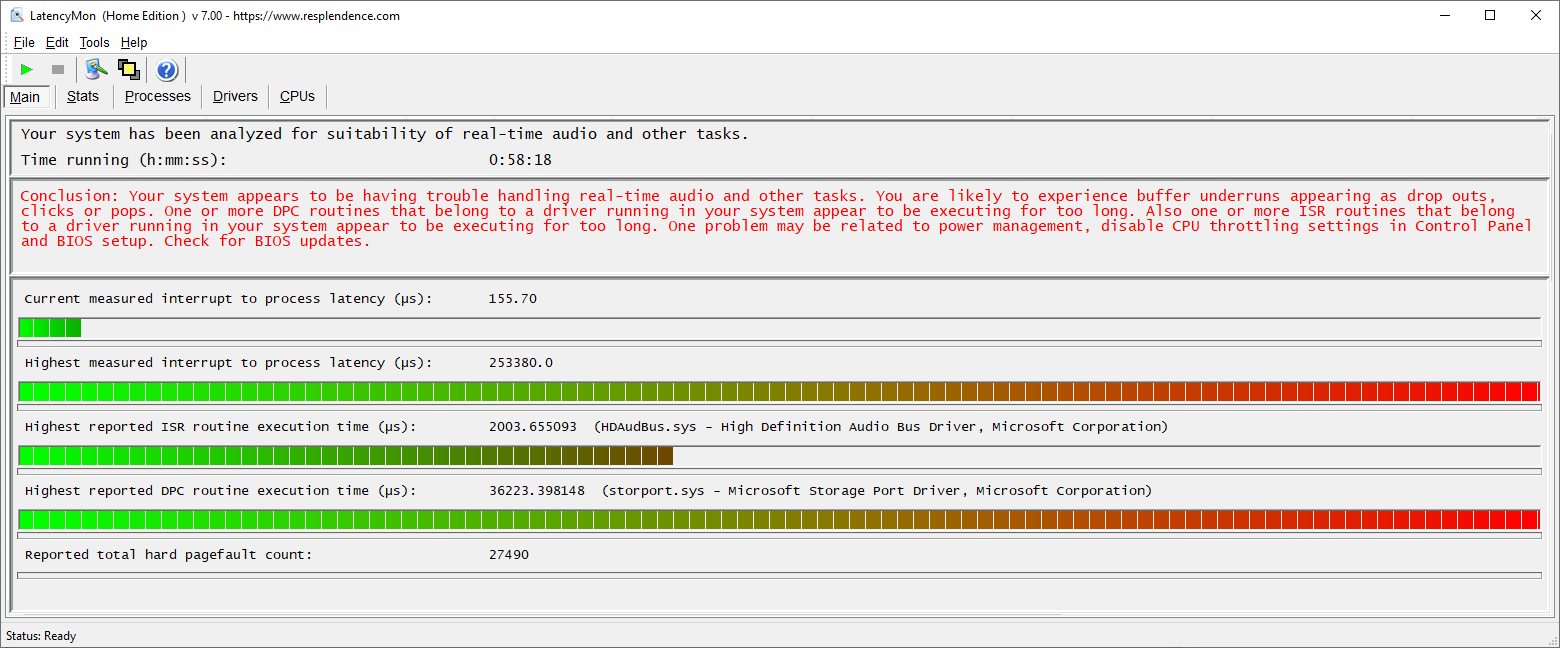
CONCLUSION
Your system appears to be having trouble handling real-time audio and other tasks. You are likely to experience buffer underruns appearing as drop outs, clicks or pops. One or more DPC routines that belong to a driver running in your system appear to be executing for too long. Also one or more ISR routines that belong to a driver running in your system appear to be executing for too long. One problem may be related to power management, disable CPU throttling settings in Control Panel and BIOS setup. Check for BIOS updates.
LatencyMon has been analyzing your system for 0:58:18 (h:mm:ss) on all processors.
SYSTEM INFORMATION
Computer name: LAPTOP-VP8CQ1M1
OS version: Windows 10, 10.0, version 2004, build: 19041 (x64)
Hardware: 81SX, LENOVO
CPU: GenuineIntel Intel(R) Core(TM) i7-9750H CPU @ 2.60GHz
Logical processors: 12
Processor groups: 1
RAM: 16303 MB total
CPU SPEED
Reported CPU speed: 2592 MHz
Note: reported execution times may be calculated based on a fixed reported CPU speed. Disable variable speed settings like Intel Speed Step and AMD Cool N Quiet in the BIOS setup for more accurate results.
MEASURED INTERRUPT TO USER PROCESS LATENCIES
The interrupt to process latency reflects the measured interval that a usermode process needed to respond to a hardware request from the moment the interrupt service routine started execution. This includes the scheduling and execution of a DPC routine, the signaling of an event and the waking up of a usermode thread from an idle wait state in response to that event.
Highest measured interrupt to process latency (µs): 253380.0
Average measured interrupt to process latency (µs): 8.510977
Highest measured interrupt to DPC latency (µs): 253371.60
Average measured interrupt to DPC latency (µs): 4.850135
REPORTED ISRs
Interrupt service routines are routines installed by the OS and device drivers that execute in response to a hardware interrupt signal.
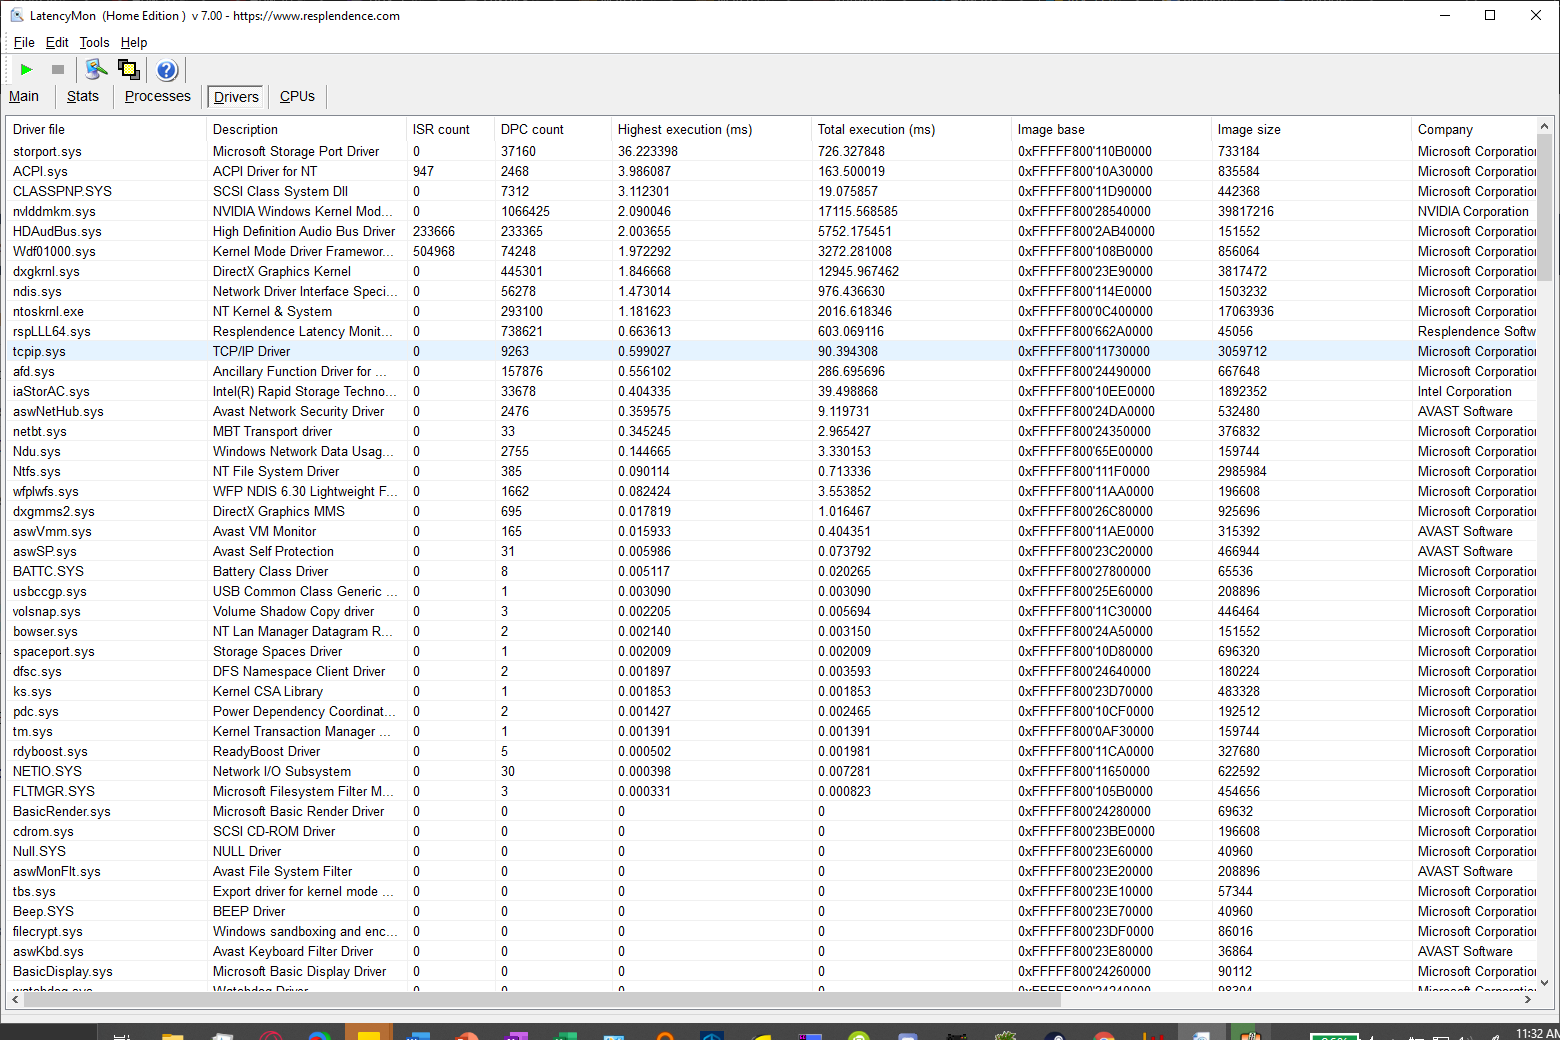
Highest ISR routine execution time (µs): 2003.655093
Driver with highest ISR routine execution time: HDAudBus.sys - High Definition Audio Bus Driver, Microsoft Corporation
Highest reported total ISR routine time (%): 0.012884
Driver with highest ISR total time: HDAudBus.sys - High Definition Audio Bus Driver, Microsoft Corporation
Total time spent in ISRs (%) 0.016429
ISR count (execution time <250 µs): 739196
ISR count (execution time 250-500 µs): 0
ISR count (execution time 500-1000 µs): 313
ISR count (execution time 1000-2000 µs): 71
ISR count (execution time 2000-4000 µs): 1
ISR count (execution time >=4000 µs): 0
REPORTED DPCs
DPC routines are part of the interrupt servicing dispatch mechanism and disable the possibility for a process to utilize the CPU while it is interrupted until the DPC has finished execution.
Highest DPC routine execution time (µs): 36223.398148
Driver with highest DPC routine execution time: storport.sys - Microsoft Storage Port Driver, Microsoft Corporation
Highest reported total DPC routine time (%): 0.033541
Driver with highest DPC total execution time: nvlddmkm.sys - NVIDIA Windows Kernel Mode Driver, Version 461.72 , NVIDIA Corporation
Total time spent in DPCs (%) 0.088460
DPC count (execution time <250 µs): 3162489
DPC count (execution time 250-500 µs): 0
DPC count (execution time 500-10000 µs): 712
DPC count (execution time 1000-2000 µs): 117
DPC count (execution time 2000-4000 µs): 23
DPC count (execution time >=4000 µs): 15
REPORTED HARD PAGEFAULTS
Hard pagefaults are events that get triggered by making use of virtual memory that is not resident in RAM but backed by a memory mapped file on disk. The process of resolving the hard pagefault requires reading in the memory from disk while the process is interrupted and blocked from execution.
NOTE: some processes were hit by hard pagefaults. If these were programs producing audio, they are likely to interrupt the audio stream resulting in dropouts, clicks and pops. Check the Processes tab to see which programs were hit.
Process with highest pagefault count: microsoft.photos.exe
Total number of hard pagefaults 27490
Hard pagefault count of hardest hit process: 17140
Number of processes hit: 48
PER CPU DATA
CPU 0 Interrupt cycle time (s): 154.688359
CPU 0 ISR highest execution time (µs): 2003.655093
CPU 0 ISR total execution time (s): 6.884997
CPU 0 ISR count: 738389
CPU 0 DPC highest execution time (µs): 36223.398148
CPU 0 DPC total execution time (s): 36.052487
CPU 0 DPC count: 2999431
CPU 1 Interrupt cycle time (s): 36.216060
CPU 1 ISR highest execution time (µs): 561.756944
CPU 1 ISR total execution time (s): 0.010262
CPU 1 ISR count: 1066
CPU 1 DPC highest execution time (µs): 1838.702932
CPU 1 DPC total execution time (s): 0.098786
CPU 1 DPC count: 14615
CPU 2 Interrupt cycle time (s): 25.494375
CPU 2 ISR highest execution time (µs): 61.406636
CPU 2 ISR total execution time (s): 0.001267
CPU 2 ISR count: 126
CPU 2 DPC highest execution time (µs): 35640.808642
CPU 2 DPC total execution time (s): 0.173470
CPU 2 DPC count: 34177
CPU 3 Interrupt cycle time (s): 25.666291
CPU 3 ISR highest execution time (µs): 0.0
CPU 3 ISR total execution time (s): 0.0
CPU 3 ISR count: 0
CPU 3 DPC highest execution time (µs): 30910.618056
CPU 3 DPC total execution time (s): 0.073931
CPU 3 DPC count: 5424
CPU 4 Interrupt cycle time (s): 27.656867
CPU 4 ISR highest execution time (µs): 0.0
CPU 4 ISR total execution time (s): 0.0
CPU 4 ISR count: 0
CPU 4 DPC highest execution time (µs): 35958.018519
CPU 4 DPC total execution time (s): 0.249741
CPU 4 DPC count: 37310
CPU 5 Interrupt cycle time (s): 24.700920
CPU 5 ISR highest execution time (µs): 0.0
CPU 5 ISR total execution time (s): 0.0
CPU 5 ISR count: 0
CPU 5 DPC highest execution time (µs): 267.834877
CPU 5 DPC total execution time (s): 0.011322
CPU 5 DPC count: 2631
CPU 6 Interrupt cycle time (s): 27.037175
CPU 6 ISR highest execution time (µs): 0.0
CPU 6 ISR total execution time (s): 0.0
CPU 6 ISR count: 0
CPU 6 DPC highest execution time (µs): 35656.949074
CPU 6 DPC total execution time (s): 0.155353
CPU 6 DPC count: 28388
CPU 7 Interrupt cycle time (s): 24.931925
CPU 7 ISR highest execution time (µs): 0.0
CPU 7 ISR total execution time (s): 0.0
CPU 7 ISR count: 0
CPU 7 DPC highest execution time (µs): 347.614969
CPU 7 DPC total execution time (s): 0.015073
CPU 7 DPC count: 3366
CPU 8 Interrupt cycle time (s): 24.605746
CPU 8 ISR highest execution time (µs): 0.0
CPU 8 ISR total execution time (s): 0.0
CPU 8 ISR count: 0
CPU 8 DPC highest execution time (µs): 36055.743827
CPU 8 DPC total execution time (s): 0.147264
CPU 8 DPC count: 18228
CPU 9 Interrupt cycle time (s): 22.730374
CPU 9 ISR highest execution time (µs): 0.0
CPU 9 ISR total execution time (s): 0.0
CPU 9 ISR count: 0
CPU 9 DPC highest execution time (µs): 275.984568
CPU 9 DPC total execution time (s): 0.007956
CPU 9 DPC count: 1741
CPU 10 Interrupt cycle time (s): 25.665961
CPU 10 ISR highest execution time (µs): 0.0
CPU 10 ISR total execution time (s): 0.0
CPU 10 ISR count: 0
CPU 10 DPC highest execution time (µs): 36129.743056
CPU 10 DPC total execution time (s): 0.128678
CPU 10 DPC count: 12330
CPU 11 Interrupt cycle time (s): 24.442397
CPU 11 ISR highest execution time (µs): 0.0
CPU 11 ISR total execution time (s): 0.0
CPU 11 ISR count: 0
CPU 11 DPC highest execution time (µs): 3112.300926
CPU 11 DPC total execution time (s): 0.018252
CPU 11 DPC count: 5715
' cx='32' cy='32' r='32' /%3E%3Ctext x='50%25' y='55%25' dominant-baseline='middle' text-anchor='middle' fill='%23FFF' %3ECJ%3C/text%3E%3C/svg%3E)