Hi @grajee ,
Thanks for your patience.
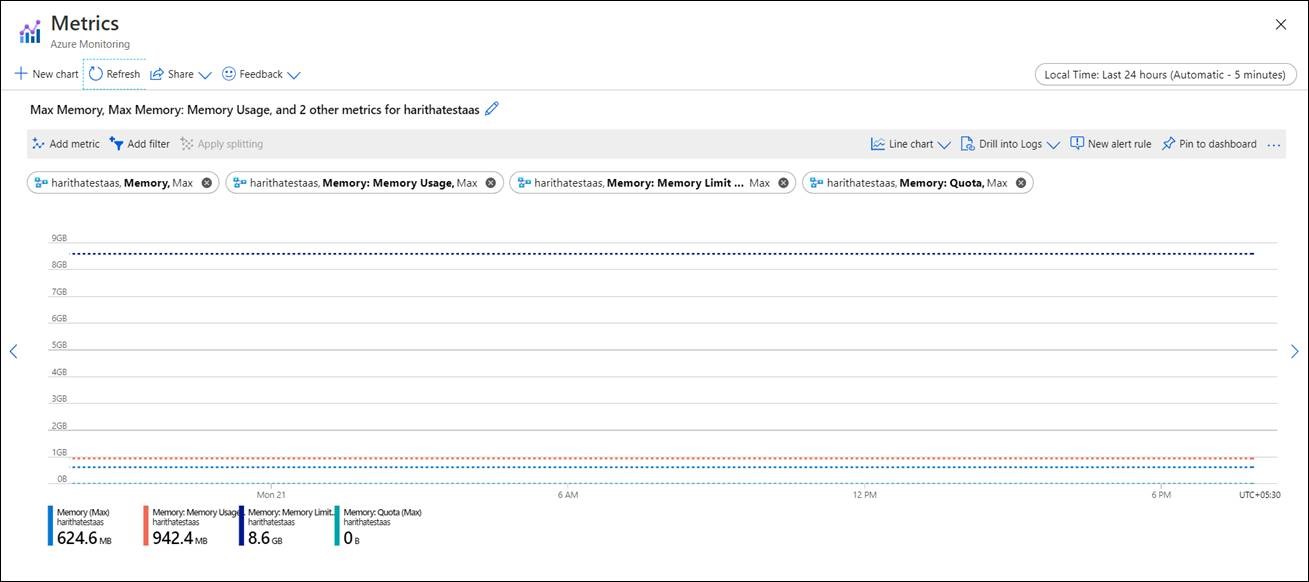
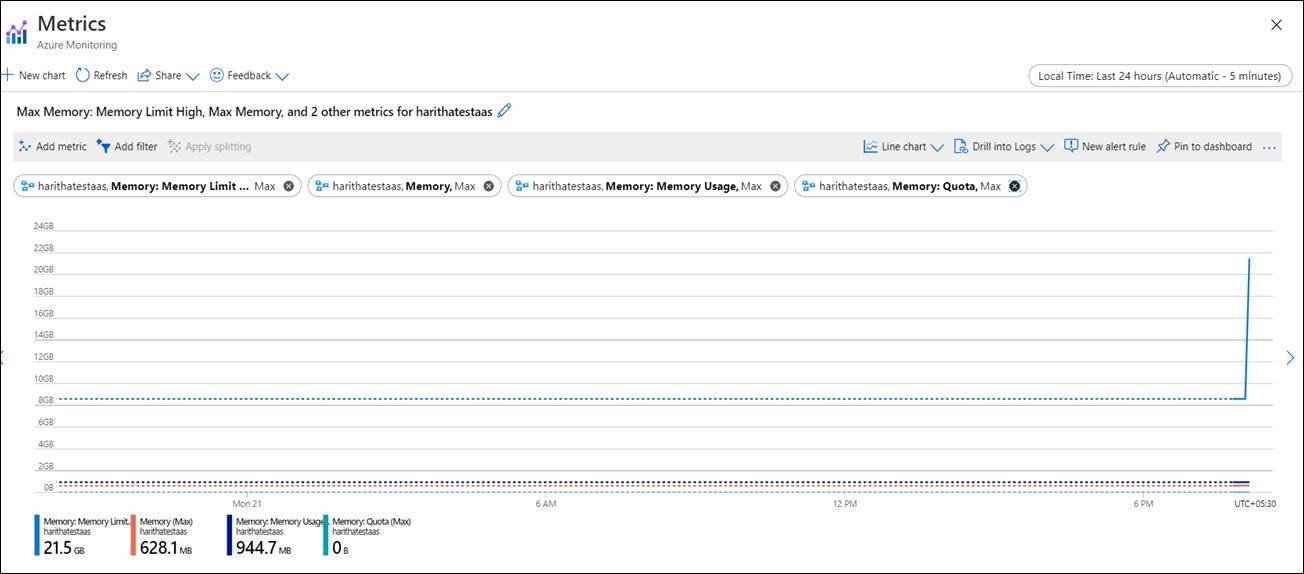
I discussed with Product team and below are the insights. I created sample instances of Azure Analysis Services (AAS) with S0(10GB RAM) and S1(25GB RAM) configurations and below are the snaps from Metrics dashboard in Azure portal. Yes, the Memory Usage metric (942.4 MB) reflects the memory that memory needed just to start up, initialize, load CLR assemblies, etc. "Memory Limit- High(max)" reflects the Total Memory Limit. The Hard Memory Limit is always equal to the SKU size (e.g. 10 GB for the S0).
What this essentially means is that spikes of memory above 8.6 GB would start to trigger high priority cleaning of memory – it can cause older inactive sessions to be cancelled, so that memory is released. Beyond the Hard Memory Limit, the priority bumps up even further, and even active operations and active sessions can get cancelled.


Hope this helps! Please let us know for further queries and we will be glad to assist.