Note
Access to this page requires authorization. You can try signing in or changing directories.
Access to this page requires authorization. You can try changing directories.
The Azure Databricks UI lets you view the jobs you have access to, browse a history of runs for each job, and inspect the details of individual job runs. To configure notifications for jobs, see Add notifications on a job.
To learn about using the Databricks CLI to view jobs and run jobs, run the CLI commands databricks jobs list -h, databricks jobs get -h, and databricks jobs run-now -h. To learn about using the Jobs API, see the Jobs API.
If you have access to the system.lakeflow schema, you can also view and query records of job runs and tasks from across your account. See Jobs system table reference. You can also join the jobs system tables with billing tables to monitor the cost of jobs across your account. See Monitor job costs & performance with system tables.
View jobs and pipelines
To view the list of jobs you have access to, click  Jobs & Pipelines in the sidebar. The Jobs & pipelines tab in the Lakeflow Jobs UI lists information about all available jobs and pipelines, such as the creator, the trigger (if any), and the result of the last five runs.
To change the columns displayed in the list, click  and select or deselect columns.
Important
The unified Jobs & pipelines list is in Public Preview. You can disable the feature and return to the default experience by disabling Jobs and pipelines: Unified management, search, & filtering. See Manage Azure Databricks previews for more information.
You can filter jobs in the Jobs & pipelines list as shown in the following screenshot.
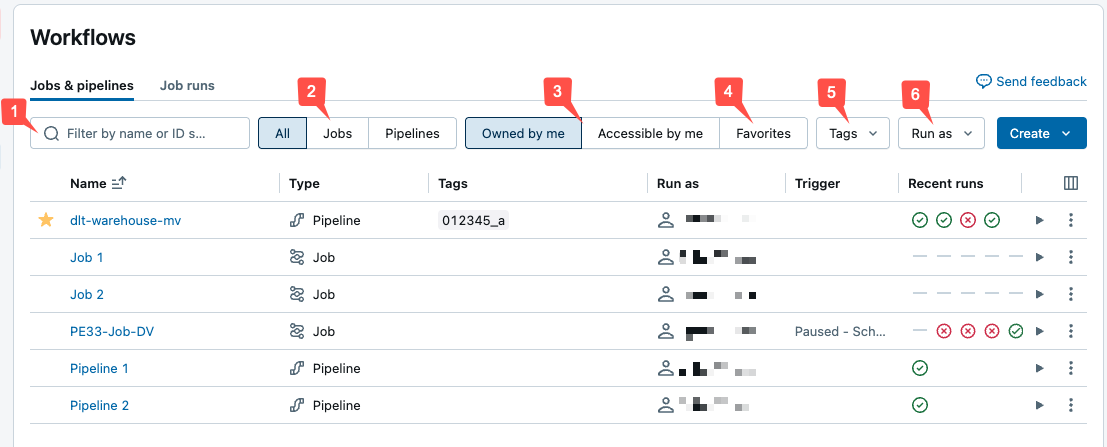
- Text search: keyword search is supported for the Name and Job ID fields. To search for a tag created with a key and value, you can search by the key, the value, or both the key and value. For example, for a tag with the key
departmentand the valuefinance, you can search fordepartmentorfinanceto find matching jobs. To search by the key and value, enter the key and value separated by a colon (for example,department:finance). - Type: select only jobs, pipelines, or all.
- Owner: select only the jobs or pipelines you own.
- Favorites: select all jobs or pipelines you have marked as favorites.
- Tags: Use tags. To search by tag you can use the tags drop-down menu to filter for up to five tags at the same time or directly use the keyword search.
- Run as: Filter by up to two
run asvalues.
To start a job or pipeline, click the  play button. To stop a workflow, click the
  stop button. To access other actions, click the kebab menu
  . For example, you can delete the workflow or access settings for a pipeline from this menu.
View recent runs across all jobs and pipelines
You can view a list of running and recently completed runs for all jobs and pipelines in a workspace that are accessible by you, including runs started by external orchestration tools such as Apache Airflow or Azure Data Factory. To view the list of recent runs:
- Click Jobs & Pipelines in the sidebar.
- Click the Runs tab to display the Finished runs count graph and the list of job and pipeline runs.
- (Optional) Click Jobs or Pipelines to filter the list by type.
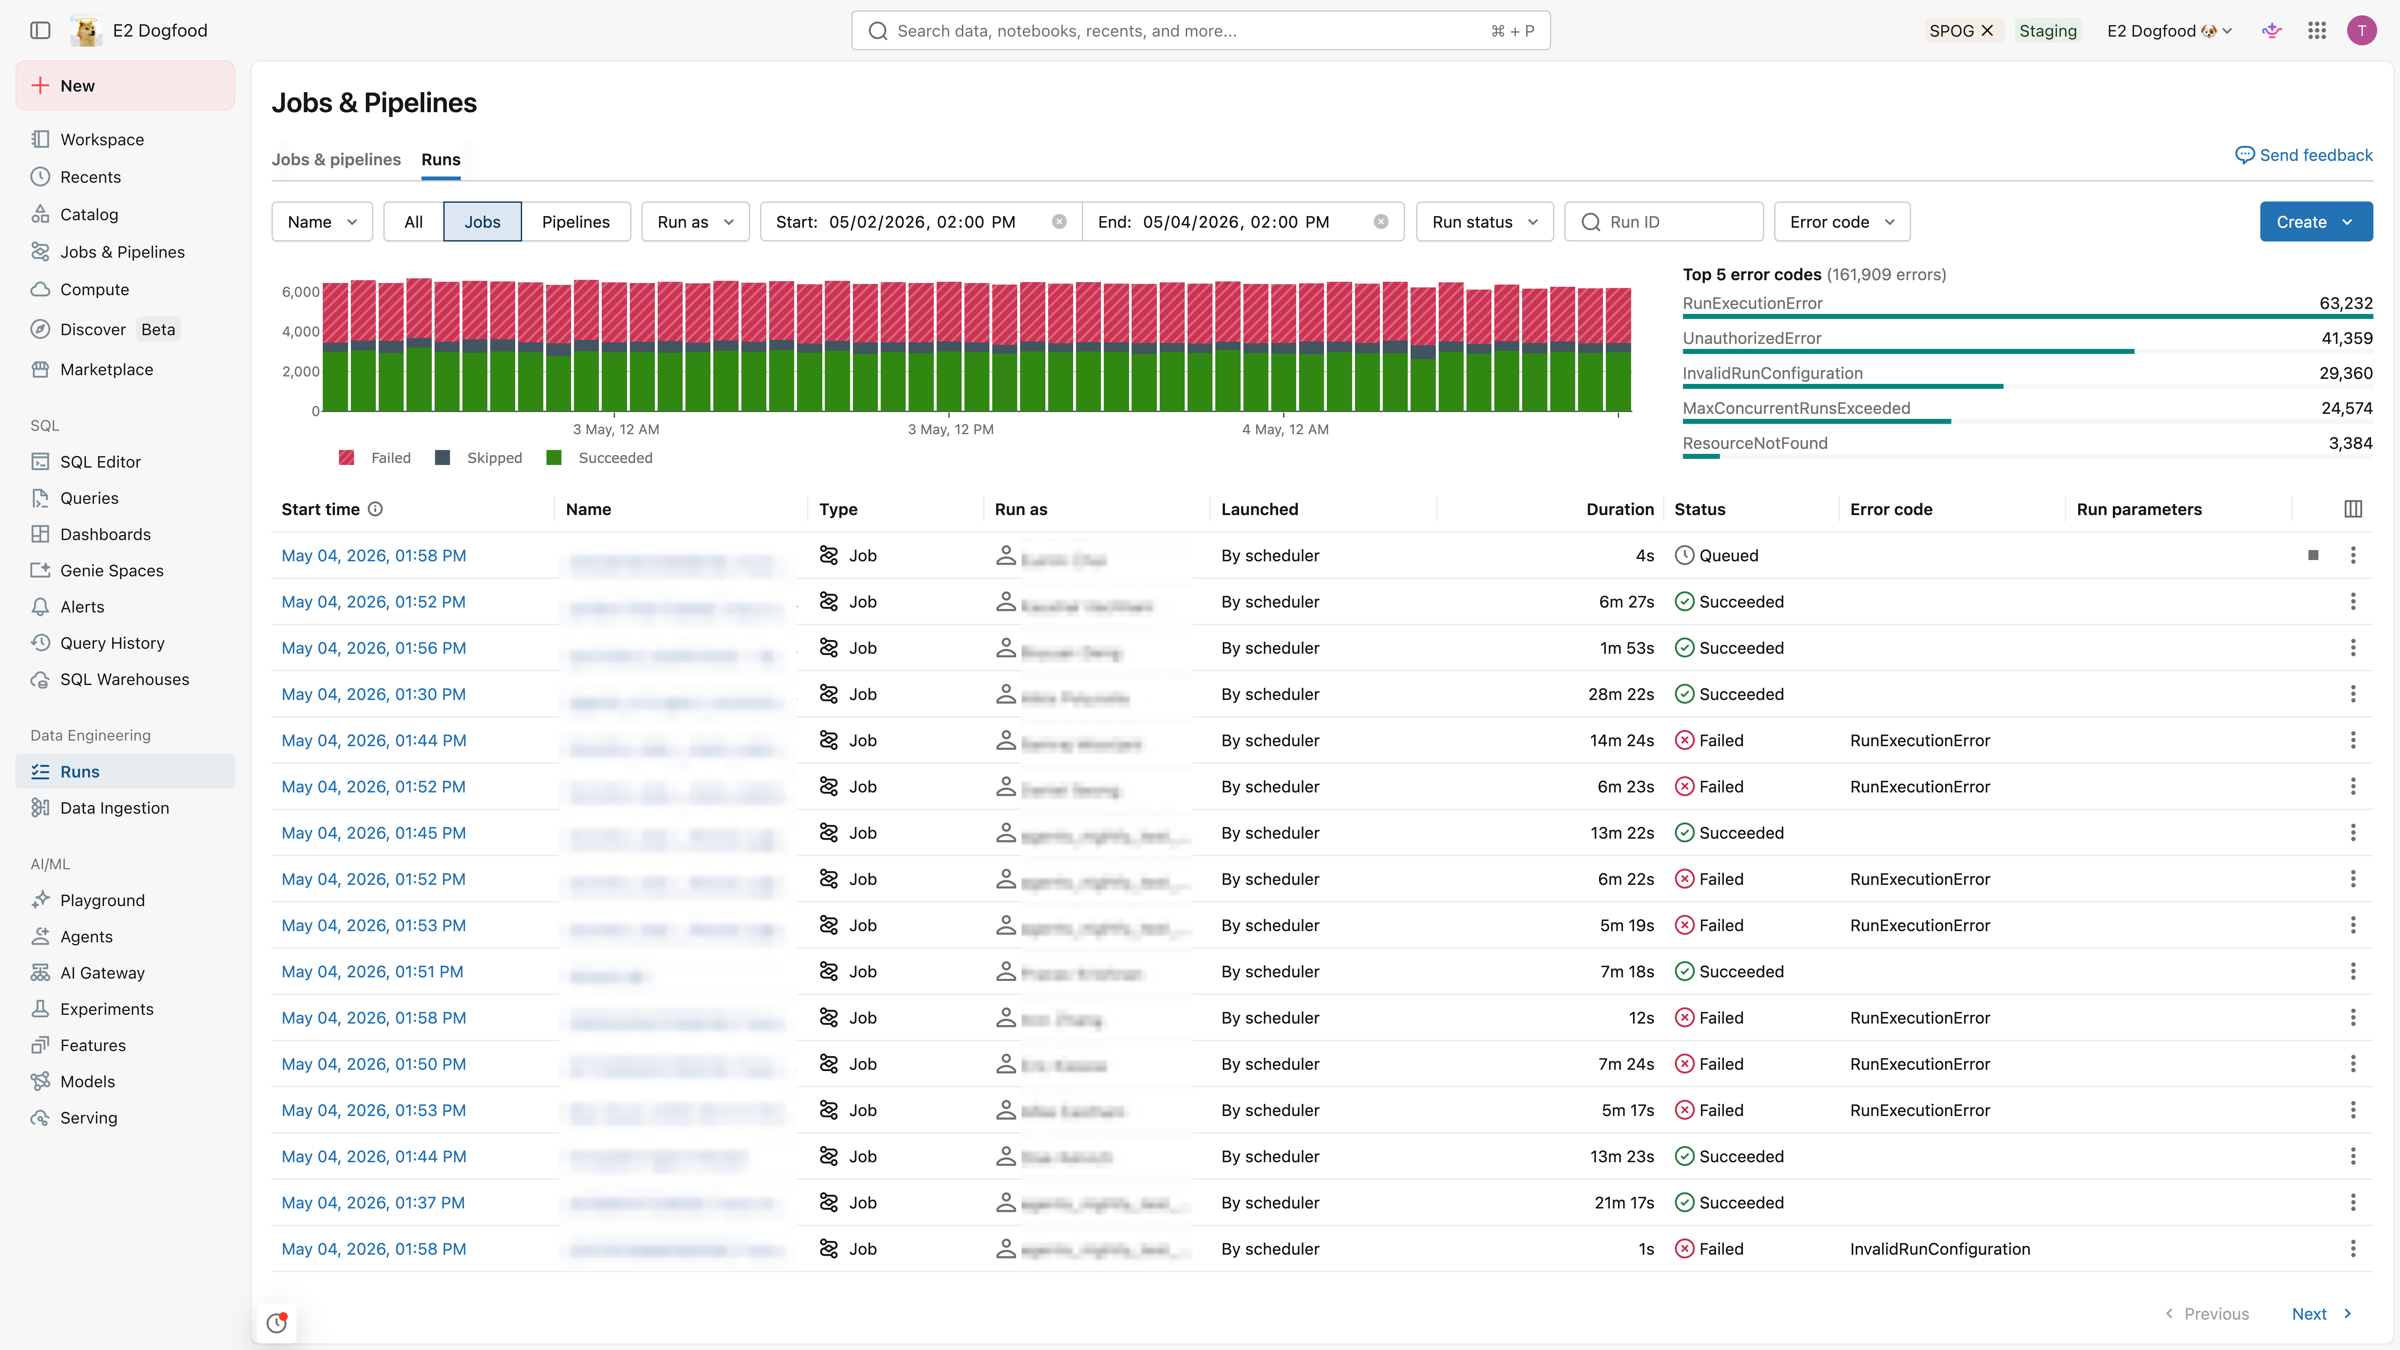
The runs list includes filtering options across the top, a graph of recently finished runs and top 5 errors, and a list of recently completed runs.
You can filter by:
- Name of the job or pipeline.
- All, Jobs, or Pipelines.
- Pipeline type (ETL, Ingestion, MV/ST, or Database Table Sync).
- The Run as user.
- Run ID to find a specific run.
- The run Start time (within the last 48 hours).
- The Run status.
- The Error code for failed runs.
Filters apply to the graph, the error codes, and the list of runs.
Note
Runs submitted through the Jobs API runs/submit endpoint, including runs from the Apache Airflow DatabricksSubmitRunOperator, are one-time runs that aren't backed by a saved job. Because these runs have no associated job, you can't find them by filtering on a job Name. Filter by Run ID, Run as, or Start time instead. To create durable jobs that appear in Name searches and support retries, create a job and then run it rather than using runs/submit.
Finished runs count graph
The Finished runs count graph shows the number of runs completed in the last 48 hours. By default, the graph shows failed, skipped, and successful runs. You can also filter the graph to show specific run statuses or restrict the graph to a specific time range.

Note
The Finished runs count graph appears only when you filter to Jobs or Pipelines. It is not shown when All is selected. The graph is shown for admins for all runs. For non-admins, you must click Run as and select me.
The filters at the top of the Runs tab apply to the graph.
To limit the time range displayed in the Finished runs count graph, define a time range in the filter. Alternatively, you can click and drag your cursor in the graph to select the time range. The graph and the runs table update to show runs from only the defined time range.
The Top 5 error types table shows a list of the most frequent error types from the selected time range, allowing you to quickly see the most common causes of issues in your workspace.
Runs list
The Runs tab also includes a table of job and pipeline runs from the last 60 days. Azure Databricks retains run history for 60 days for both jobs and pipelines. By default, the table includes details on failed, skipped, and successful runs.
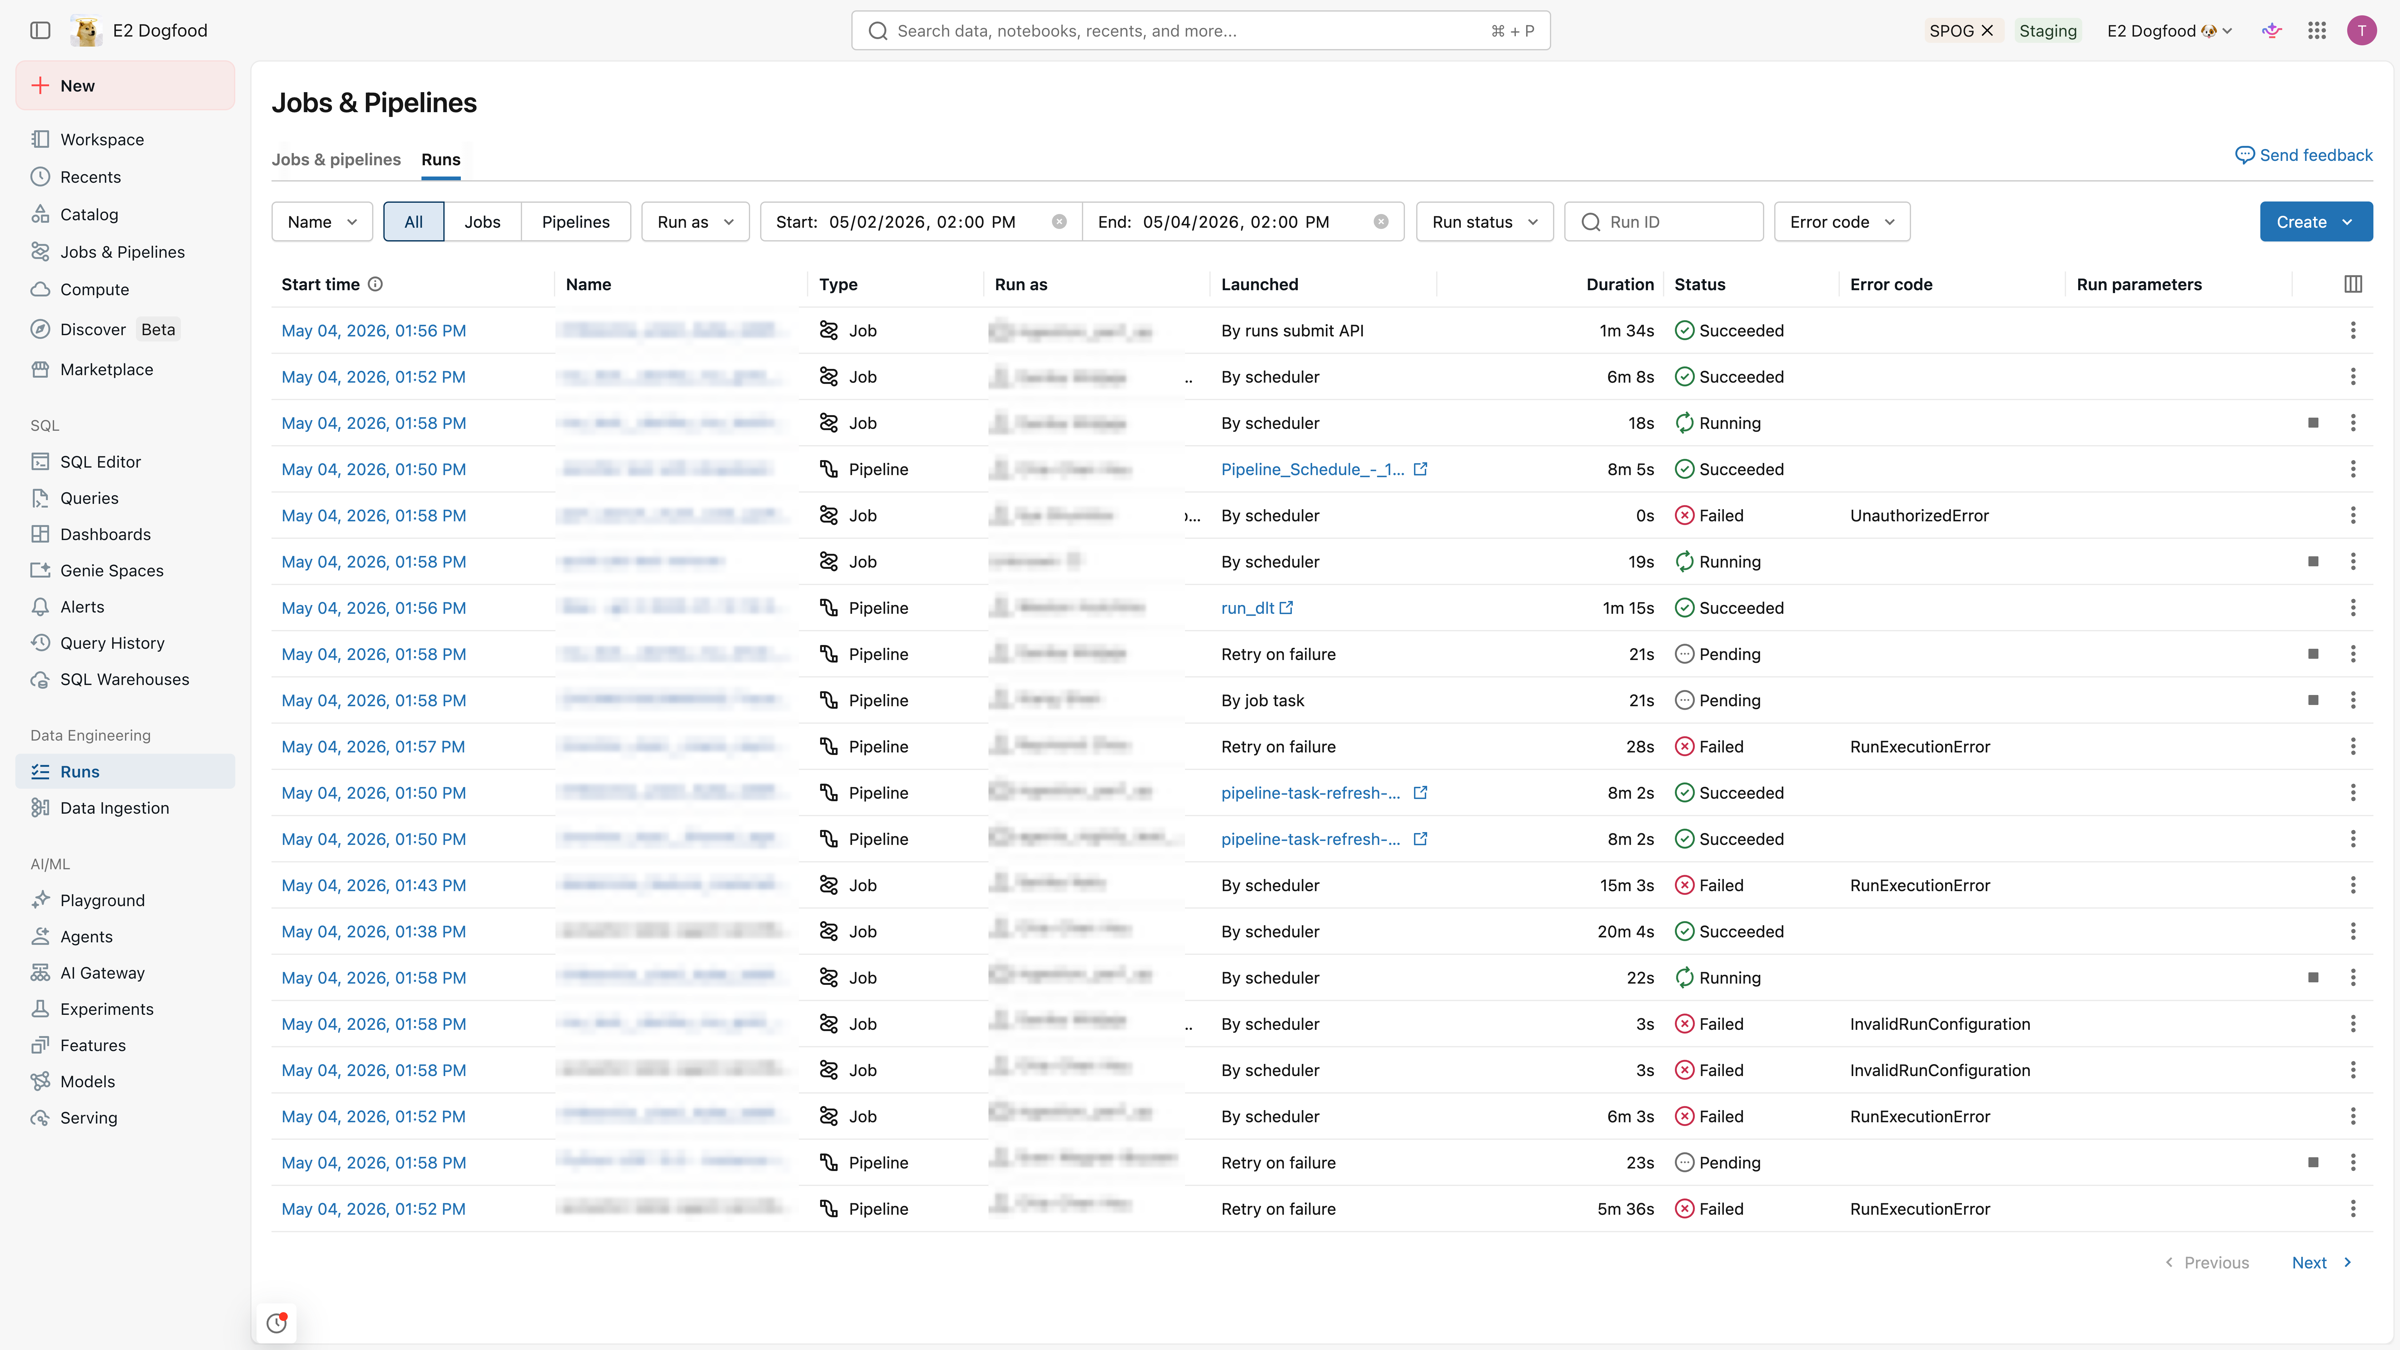
The filters at the top of the Runs tab apply to the list.
By default, the list of runs in the runs table displays the following:
- The start time for the run.
- The name of the job or pipeline associated with the run.
- The type (Job or Pipeline) of the run.
- The username the run runs as.
- What triggered the run (Launched): a schedule, an API request, or a manual start.
- The time elapsed for a running job or pipeline or the total running time for a completed run. The UI displays a warning if the duration exceeds a configured expected completion time.
- The status of the run: Queued, Pending, Running, Skipped, Succeeded, Succeeded with failures, Failed, Timed Out, Canceling, or Canceled.
- Any error code that the run terminated with.
- Any parameters for the run.
- To stop a running job or pipeline, click the stop button. To open actions for the run, click the (for example, to stop an active run or delete a completed run).
To change the columns displayed in the runs list, click  and select or clear columns.
To view job run details, click the link in the Start time column for the run. To view job or pipeline details, click the name in the Job column.
View runs for a single job
You can view a list of currently running and recently completed runs for a job that you have access to, including runs started by external orchestration tools such as Apache Airflow or Azure Data Factory. To view the list of recent job runs:
In your Azure Databricks workspace's sidebar, click Jobs & Pipelines.
Optionally, select the Jobs and Owned by me filters.
Click your job's Name link.
The Runs tab appears with matrix and list views of active and completed runs.
The matrix view shows a history of runs for the job, including each job task.
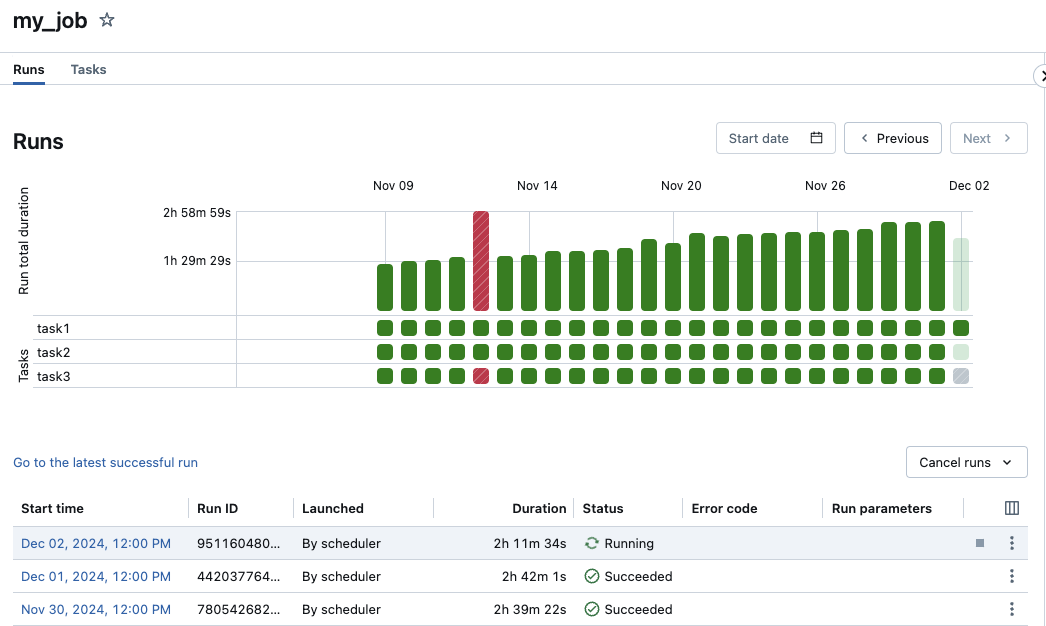
The Run total duration row of the matrix displays the run's total duration and the run's state. To view details of the run, including the start time, duration, and status, hover over the bar in the Run total duration row.
Each cell in the Tasks row represents a task and the corresponding status of the task. To view details of each task, including the start time, duration, cluster, and status, hover over the cell for that task.
The job run and task run bars are color-coded to indicate the status of the run. Successful runs are green. Unsuccessful runs are red, skipped runs are pink, and waiting for retry is yellow. Pending, canceled, or timed out are grey. The height of the individual job run and task run bars visually indicates the run duration.
If you have configured an expected completion time, the matrix view displays a warning when the duration of a run exceeds the configured time.
By default, the runs list view displays the following:
- The start time for the run.
- The run identifier. See Job run URL and ID for how to find and share the run URL.
- Whether the run was triggered by a job schedule or an API request, or was manually started.
- The time elapsed for a currently running job or the total running time for a completed run. A warning is displayed if the duration exceeds a configured expected completion time.
- The status of the run, either Queued, Pending, Running, Skipped, Succeeded, Succeeded with failures, Failed, Timed Out, Canceling, or Canceled.
- The error code the run terminated with.
- The run parameters.
Currently active runs display a stop button. To stop all active and queued runs, select Cancel runs or Cancel all queued runs from the drop-down menu.
To access context-specific actions for the run, click the kebab menu (for example, to stop an active run or delete a completed run).
To change the columns displayed in the runs list view, click  and select or deselect columns.
To view details for a job run, click the link for the run in the Start time column in the runs list view. To view details for this job's most recent successful run, click Go to the latest successful run.
Azure Databricks maintains a history of your job runs for up to 60 days. If you need to preserve job runs, Databricks recommends exporting results before they expire. For more information, see Export job run results.
View job run details
The job run details page contains job output and links to logs, including information about the success or failure of each task in the job run. You can access job run details from the Runs tab for the job.
To view job run details from the Runs tab, click the link for the run in the Start time column in the runs list view. To return to the Runs tab for the job, click the Job ID value.
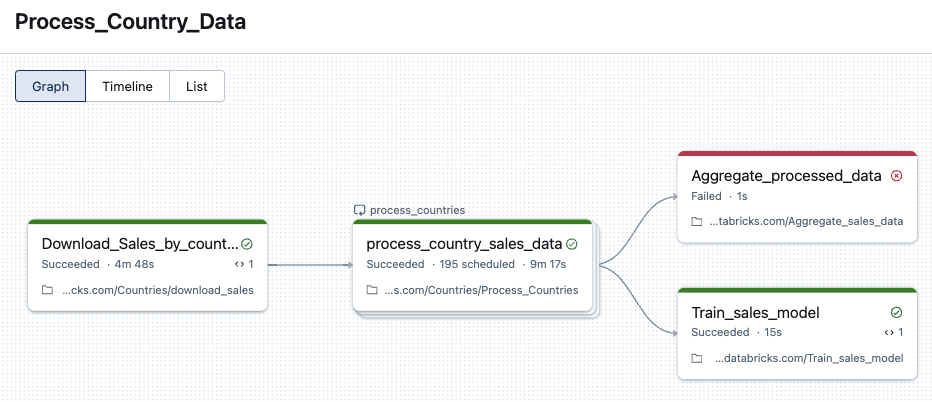
Jobs with multiple tasks additionally have a graph, timeline, and list view.
Graph view
Click a task node in the graph to view task run details, including:
- Task details including run as, how the job was launched, start time, end time, duration, and status.
- The source code.
- The cluster that ran the task and links to its query history and logs.
- Metrics for the task.
Timeline view
Jobs that contain multiple tasks have a timeline view to identify tasks that are taking a long time to complete, understand dependencies and overlap to help debug and optimize these jobs.
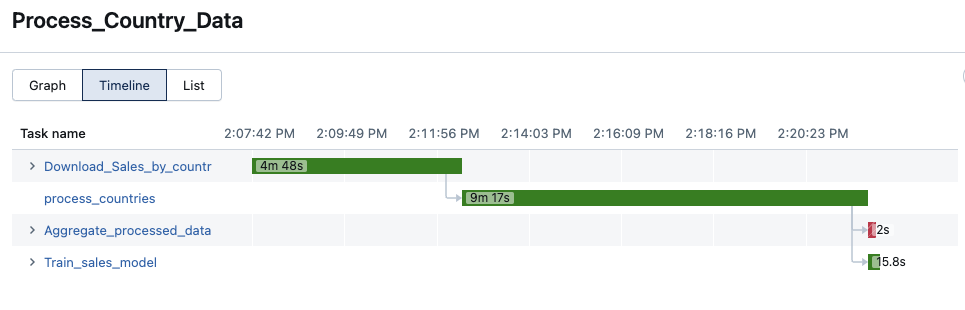
For serverless jobs, queries and query profiles are integrated into the timeline view. Click the arrow next to a task name to view the query statements and their durations, then click a statement to navigate to the corresponding query profile. See View query details for job runs.
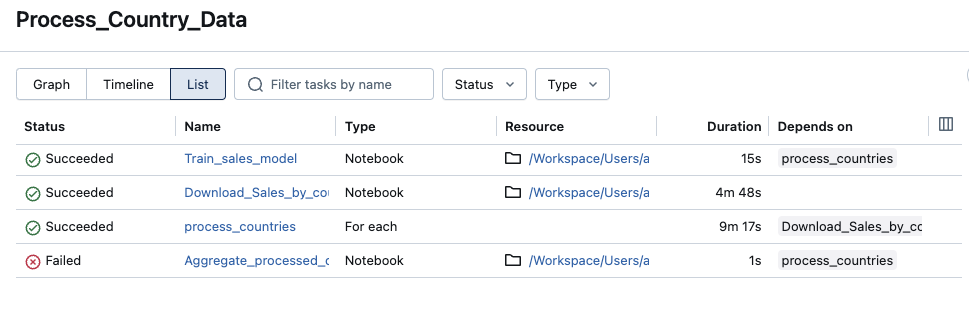
List view
By default, the list view shows the status, name, type, resource, duration, and dependencies. You can add and remove columns in this view.
You can search for a task by name, filter by task status or task type, and sort tasks by status, name, or duration.
Click the Job ID value to return to the Runs tab for the job.
To see where time is spent in a run and what you can do to reduce it, view the phase breakdown. See View the run breakdown by phase.
How Azure Databricks determines job run status
Azure Databricks determines whether a job run was successful based on the outcome of the job's leaf tasks. A leaf task is a task that has no downstream dependencies. A job run can have one of the following outcomes:
- Succeeded: All tasks were successful.
- Succeeded with failures: Some tasks failed, but all leaf tasks were successful.
- Failed: One or more leaf tasks failed.
- Skipped: The job run was skipped (for example, a task might be skipped because you exceeded the maximum concurrent runs for your job or your workspace).
- Timed Out: The job run took too long to complete and timed out.
- Canceled: The job run was canceled (for example, a user manually canceled the ongoing run).
Individual tasks can also terminate with a Disabled status when you explicitly disable them in the job settings, or when Lakeflow Jobs disables them for a run because an upstream task is disabled. Disabled tasks show a  in the upper right corner of the DAG. See Disabled tasks in Lakeflow Jobs.
View job performance metrics
Streaming task metrics and serverless query performance metrics are documented with the other job performance tools. See Diagnose Lakeflow Jobs performance.
View task run history
To view the run history of a task, including successful and unsuccessful runs:
- Click a task on the Job run details page. The Task run details page appears.
- Select the task run in the run history drop-down menu.
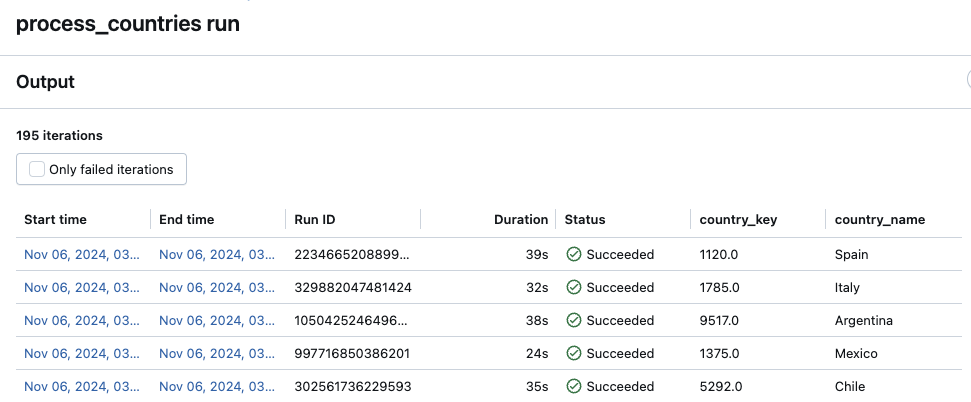
View task run history for a For each task
Accessing the run history of a For each task is the same as for a standard Lakeflow Jobs task. You can click the For each task node on the Job run details page or the corresponding cell in the matrix view. However, unlike a standard task, the run details for a For each task are presented as a table of the nested task's iterations.
To view only failed iterations, click Only failed iterations.
To view the output of an iteration, click the Start time or End time values of the iteration.
View lineage information for a job
If Unity Catalog is enabled in your workspace, you can view lineage information for any Unity Catalog tables in your workflow. If lineage information is available for your workflow, you see a link with a count of upstream and downstream tables in the Job details pane for your job, the Job run details pane for a job run, or the Task run details pane for a task run. Click the link to show the list of tables. Click a table to see detailed information in Catalog Explorer.
View and run a job created with Declarative Automation Bundles
You can use the Lakeflow Jobs UI to view and run jobs deployed by Declarative Automation Bundles. By default, these jobs are read-only in the Jobs UI. To edit a job deployed by a bundle, change the bundle configuration file and redeploy the job. Applying changes only to the bundle configuration ensures that the bundle source files always capture the current job configuration.
However, if you must make immediate changes to a job, you can disconnect the job from the bundle configuration to enable editing the job settings in the UI. To disconnect the job, click Disconnect from source. In the Disconnect from source dialog, click Disconnect to confirm.
Any changes you make to the job in the UI are not applied to the bundle configuration. To apply changes you make in the UI to the bundle, you must manually update the bundle configuration. To reconnect the job to the bundle configuration, redeploy the job using the bundle.
Export job run results
You can export notebook run results and job run logs for all job types.
Export notebook run results
You can persist job runs by exporting their results. For notebook job runs, you can export a rendered notebook that can later be imported into your Azure Databricks workspace.
To export notebook run results for a job with a single task:
- On the job detail page, click the View Details link for the run in the Run column of the Completed Runs (past 60 days) table.
- Click Export to HTML.
To export notebook run results for a job with multiple tasks:
- On the job detail page, click the View Details link for the run in the Run column of the Completed Runs (past 60 days) table.
- Click the notebook task to export.
- Click Export to HTML.
Export job run logs
You can also export the logs for your job run. You can set up your job to automatically deliver logs to DBFS while configuring jobs compute (see Compute configuration reference) or through the Job API. See the new_cluster.cluster_log_conf object in the request body passed to the Create a new job operation (POST /jobs/create) in the Jobs API.