Azure App Service quotas and alerts
Azure App Service provides built-in monitoring functionality for web apps, mobile, and API apps in the Azure portal.
In the Azure portal, you can review quotas and metrics for an app and App Service plan, and set up alerts and autoscaling rules based metrics.
Understand quotas
Apps that are hosted in App Service are subject to certain limits on the resources they can use. The limits are defined by the App Service plan that's associated with the app.
Note
App Service Free and Shared (preview) service plans are base tiers that run on the same Azure virtual machines as other App Service apps. Some apps might belong to other customers. These tiers are intended only for development and testing purposes.
If the app is hosted in a Free or Shared plan, the limits on the resources that the app can use are defined by quotas.
If the app is hosted in a Basic, Standard, or Premium plan, the limits on the resources that they can use are set by the size (Small, Medium, Large) and instance count (1, 2, 3, and so on) of the App Service plan.
Quotas for Free or Shared apps are:
| Quota | Description |
|---|---|
| CPU (Short) | The amount of CPU allowed for this app in a 5-minute interval. This quota resets every five minutes. |
| CPU (Day) | The total amount of CPU allowed for this app in a day. This quota resets every 24 hours at midnight UTC. |
| Memory | The total amount of memory allowed for this app. |
| Bandwidth | The total amount of outgoing bandwidth allowed for this app in a day. This quota resets every 24 hours at midnight UTC. |
| Filesystem | The total amount of storage allowed. |
The only quota applicable to apps that are hosted in Basic, Standard, and Premium is Filesystem.
For more information about the specific quotas, limits, and features available to the various App Service SKUs, see Azure Subscription service limits.
Quota enforcement
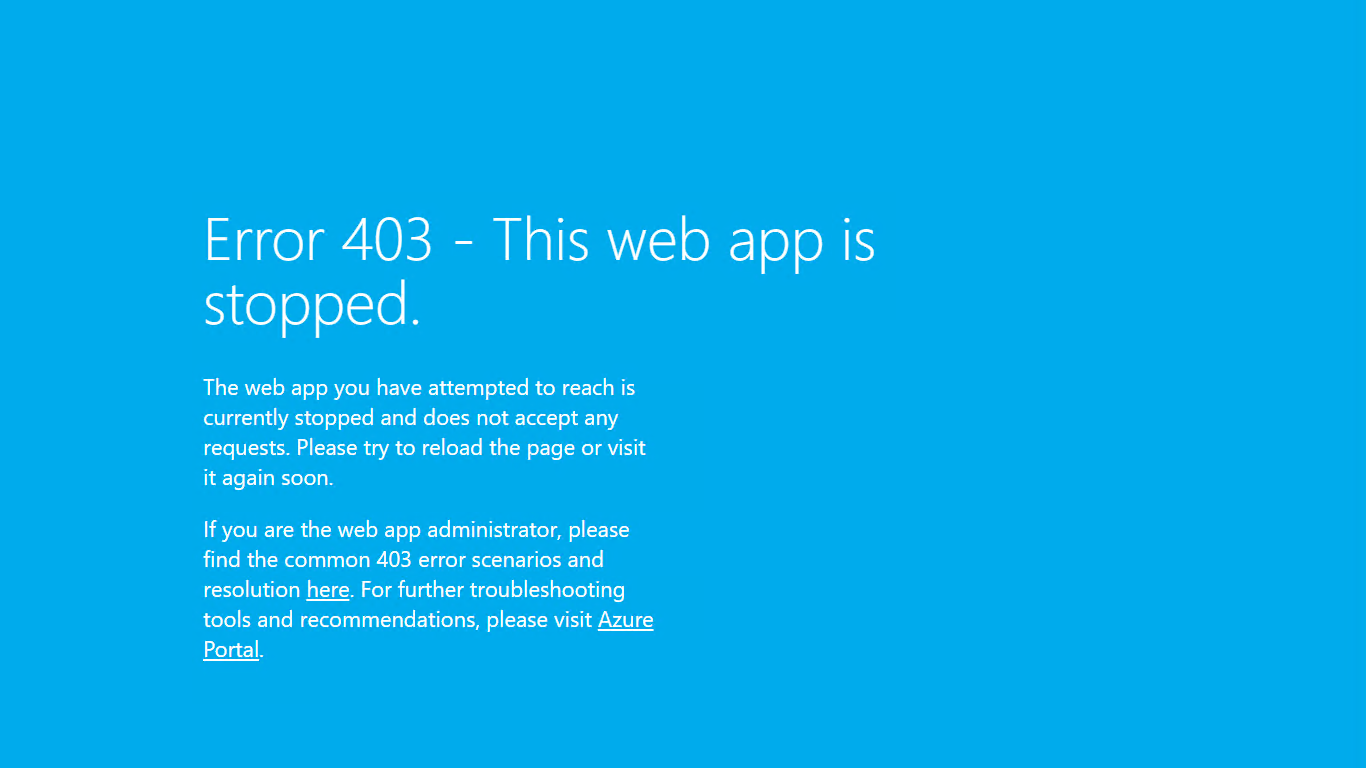
If an app exceeds the CPU (short), CPU (Day), or bandwidth quota, the app is stopped until the quota resets. During this time, all incoming requests result in an HTTP 403 error.
If the app Memory quota is exceeded, the app is stopped temporarily.
If the Filesystem quota is exceeded, any write operation fails. Write operation failures include any writes to logs.
You can increase or remove quotas from your app by upgrading your App Service plan.
Understand metrics
Important
Average Response Time will be deprecated to avoid confusion with metric aggregations. Use Response Time as a replacement.
Note
Metrics for an app include the requests to the app's SCM site(Kudu). This includes requests to view the site's logstream using Kudu. Logstream requests may span several minutes, which will affect the Request Time metrics. Users should be aware of this relationship when using these metrics with autoscale logic.
Http Server Errors only records requests that reach the backend service (the worker(s) hosting the app). If the requests are failing at the FrontEnd, they are not recorded as Http Server Errors. The Health Check feature / Application Insights availability tests can be used for outside in monitoring.
Metrics provide information about the app or the App Service plan's behavior.
For a list of available metrics for apps or for App Service plans, see Supported metrics for Microsoft.Web.
Note
App Service plan metrics are available only for plans in Basic, Standard, Premium, and Isolated tiers.
CPU time vs CPU percentage
There are two metrics that reflect CPU usage:
CPU Time: Useful for apps hosted in Free or Shared plans, because one of their quotas is defined in CPU minutes used by the app.
CPU percentage: Useful for apps hosted in Basic, Standard, and Premium plans, because they can be scaled out. CPU percentage is a good indication of the overall usage across all instances.
Metrics granularity and retention policy
Metrics for an app and app service plan are logged and aggregated by the service and retained according to these rules.
Monitoring quotas and metrics in the Azure portal
To review the status of the various quotas and metrics that affect an app, go to the Azure portal.
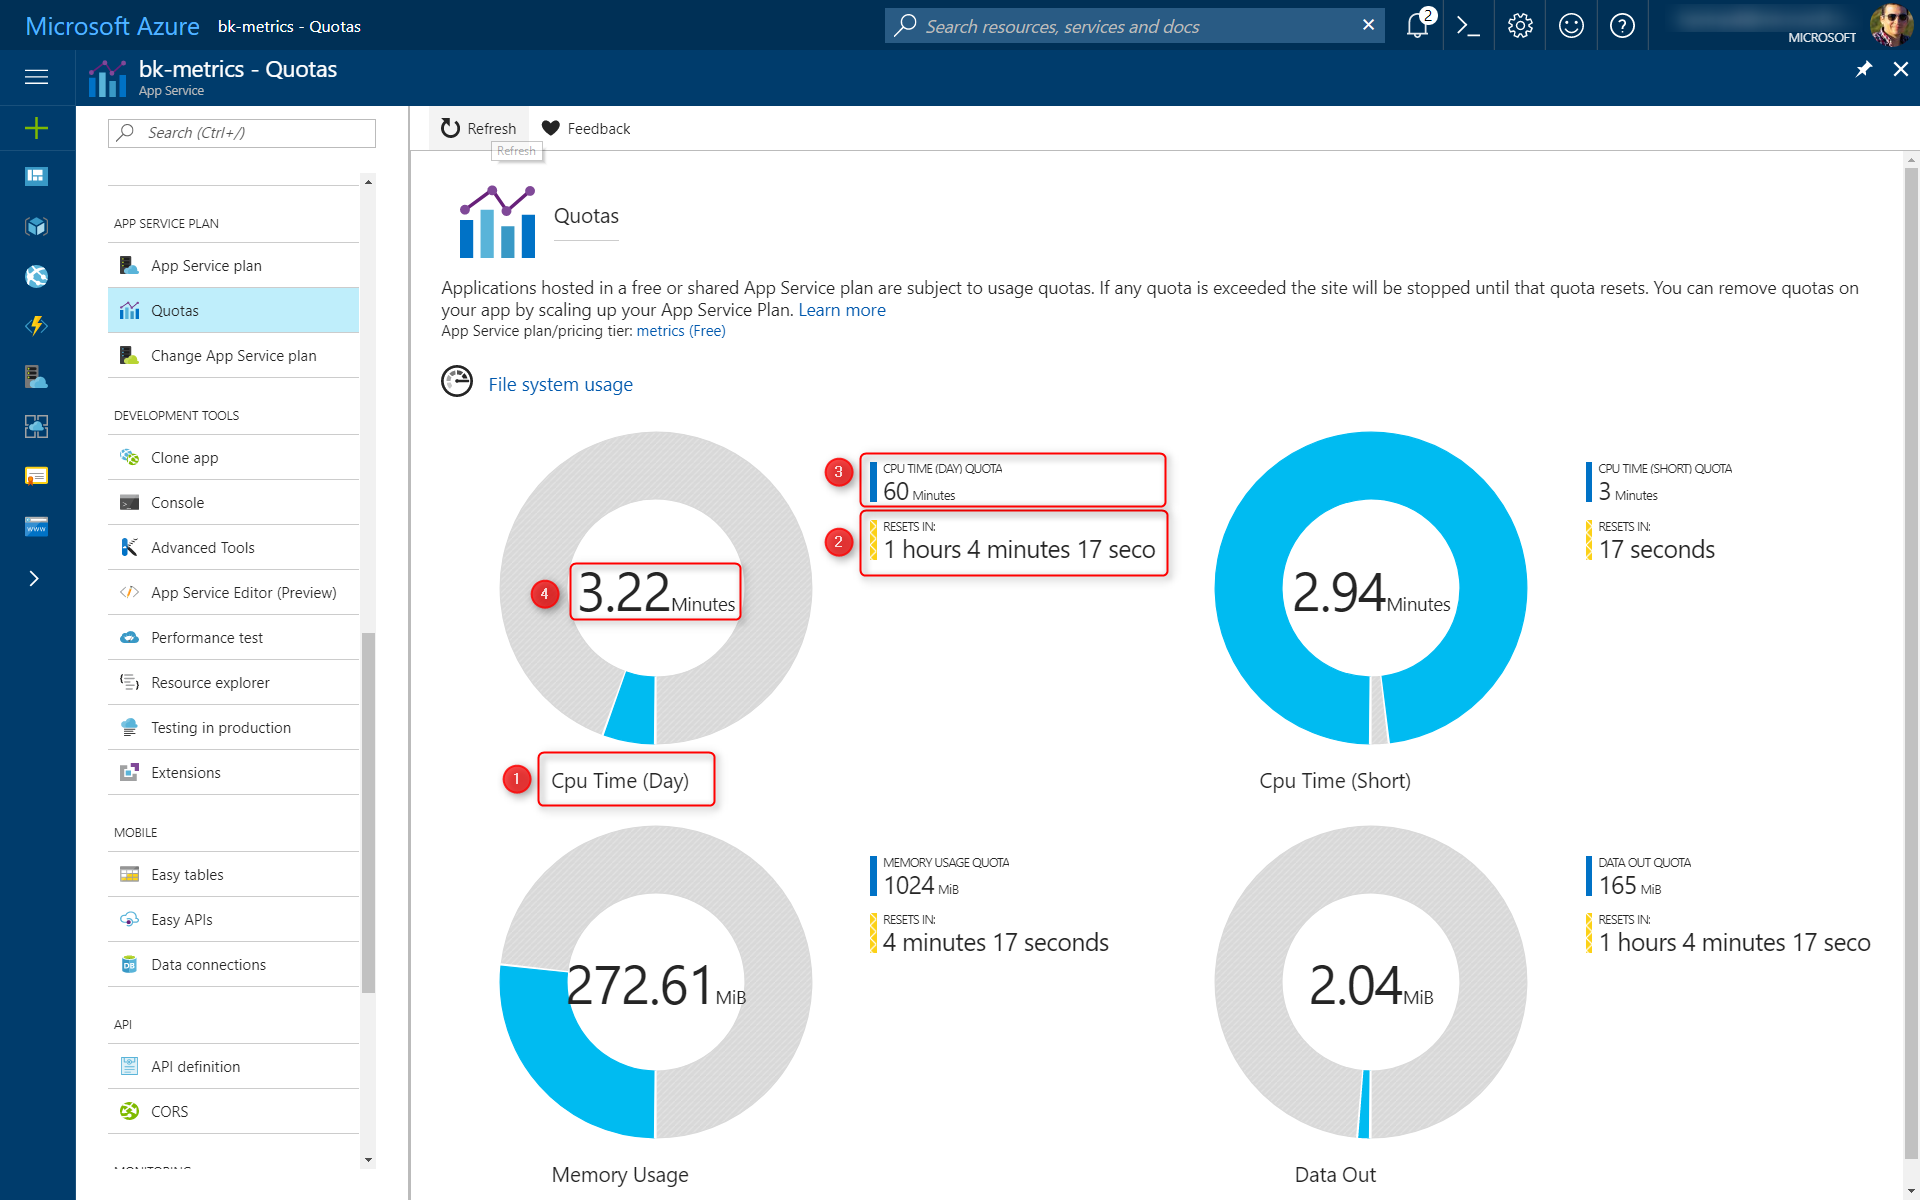
To find quotas, select Settings > Quotas. On the chart, you can review:
- The quota name.
- Its reset interval.
- Its current limit.
- Its current value.
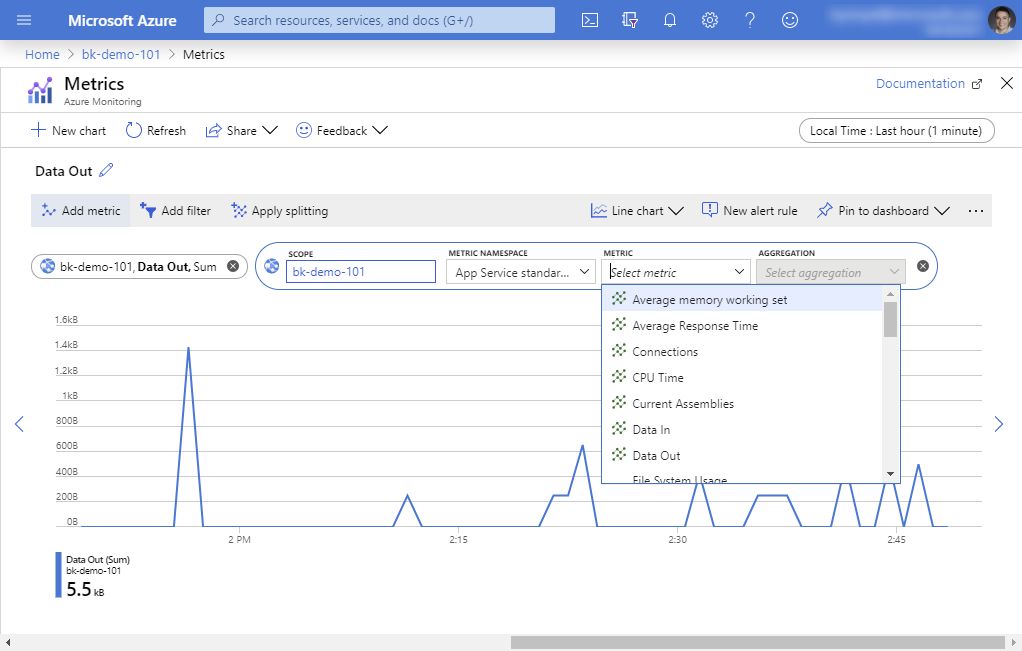 You can access metrics directly from the resource Overview page. Here you'll see charts representing some of the apps metrics.
Clicking on any of those charts will take you to the metrics view where you can create custom charts, query different metrics and much more.
To learn more about metrics, see Monitor service metrics.
Alerts and autoscale
Metrics for an app or an App Service plan can be hooked up to alerts. For more information, see Alerts.
App Service apps hosted in Basic or higher App Service plans support autoscale. With autoscale, you can configure rules that monitor the App Service plan metrics. Rules can increase or decrease the instance count, which can provide additional resources as needed. Rules can also help you save money when the app is over-provisioned.
For more information about autoscale, see How to scale and Best practices for Azure Monitor autoscaling.
Feedback
Coming soon: Throughout 2024 we will be phasing out GitHub Issues as the feedback mechanism for content and replacing it with a new feedback system. For more information see: https://aka.ms/ContentUserFeedback.
Submit and view feedback for