Events
17 Mar, 23 - 21 Mar, 23
Join the meetup series to build scalable AI solutions based on real-world use cases with fellow developers and experts.
Register nowThis browser is no longer supported.
Upgrade to Microsoft Edge to take advantage of the latest features, security updates, and technical support.
Azure DevOps Services | Azure DevOps Server 2022 - Azure DevOps Server 2019
Analytics supports several dashboard widgets that take advantage of the power of the service. Using these widgets, you and your team can gain valuable insights into the health and status of your work.
Analytics supports several dashboard widgets that take advantage of the power of the service. Once you enable or install Analytics on a project collection, you can add these widgets to your dashboard. To add extensions or enable the service, be an organization owner or a member of the Project Collection Administrators group. Using these widgets, you and your team can gain valuable insights into the health and status of your work.
You add an Analytics widget to a dashboard the same way you add any other type of widget. For details, see Add a widget to your dashboard.
The Analytics service is enabled for all Azure DevOps organizations.
| Category | Requirements |
|---|---|
| Permissions | - To view Analytics data: View analytics project-level permission set to Allow. By default, all project members in all security groups have this permission. |
| Access levels | At least Stakeholder access. |
| Category | Requirements |
|---|---|
| Permissions | - To view Analytics data: View analytics project-level permission set to Allow. By default, all project members in all security groups have this permission. |
| Access levels | At least Stakeholder access. |
| Services | Analytics service enabled. |
Note
If Boards is disabled, then Analytics views is also disabled. All widgets associated with work item tracking are also disabled in the widget catalog. To re-enable a service, see Turn on or off an Azure DevOps service.
The Burndown widget lets you display a trend of remaining work across multiple teams and multiple sprints. You can use it to create a release burndown, a bug burndown, or a burndown on any scope of work over time. It will help you answer questions like:
Burndown widget showing a release Burndown
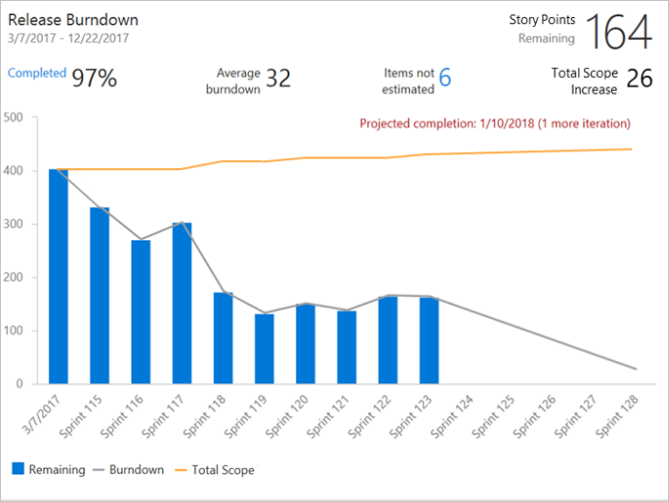
For more information, see Configure a burndown or burnup widget.
The Burnup widget lets you display a trend of completed work across multiple teams and multiple sprints. You can use it to create a release burnup, a bug burnup, or a burnup on any scope of work over time. When completed work meets total scope, your project is done!
Burnup widget showing a release Burnup
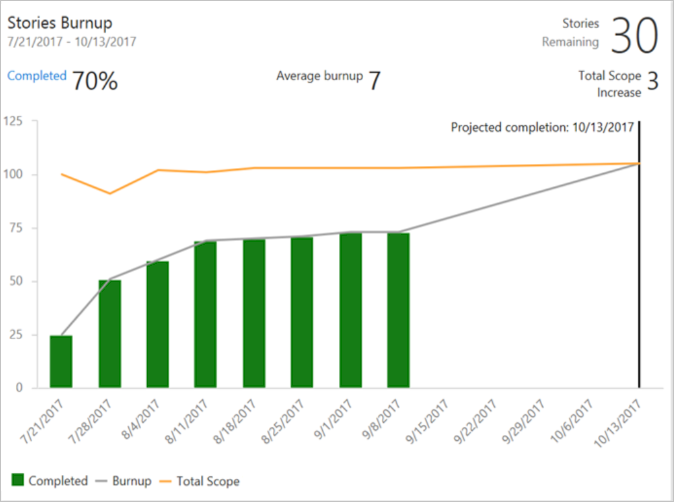
For more information, see Configure a burndown or burnup widget.
The Analytics-based Sprint Burndown widget adds a team's burndown chart for a sprint to the dashboard. This widget supports several configuration options, including selecting a team, iteration, and time period. Teams use the burndown chart to mitigate risk and check for scope creep throughout the sprint cycle.
Sprint Burndown widget
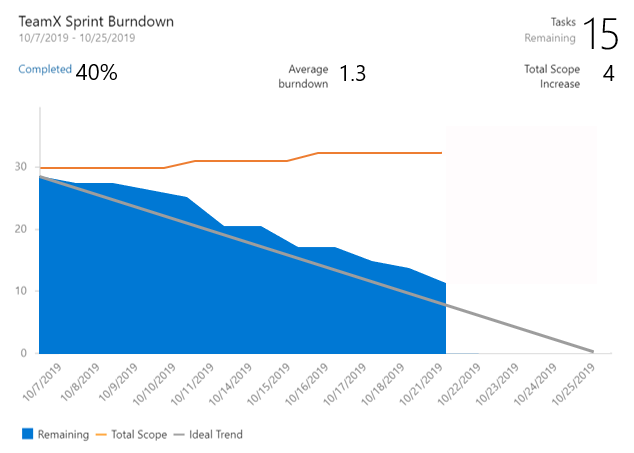
For more information, see Configure and monitor sprint burndown.
The CFD widget shows the count of work items (over time) for each column of a board. It allows you to see patterns in your team's development cycle over time. It will help you answer questions like:
Cumulative flow diagram widget showing 30 days of data
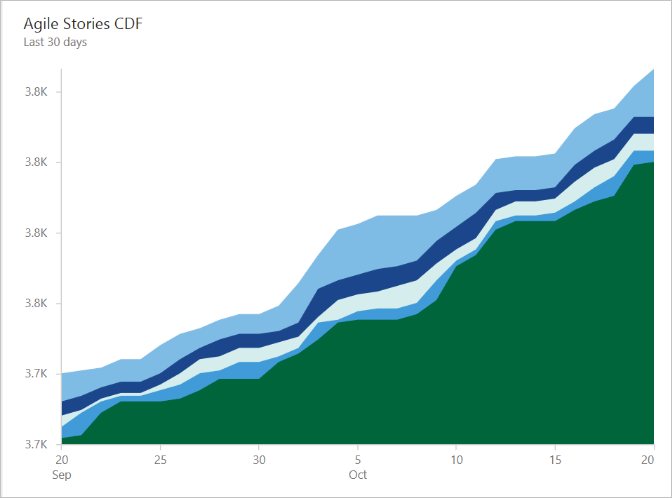
For more information, see Cumulative flow diagram widget.
The Cycle Time widget will help you analyze the time it takes for your team to complete work items once they begin actively working on them. A lower cycle time is typically indicative of a healthier team process. Using the Cycle Time widget you can answer questions like:
Cycle Time widget showing 30 days of data
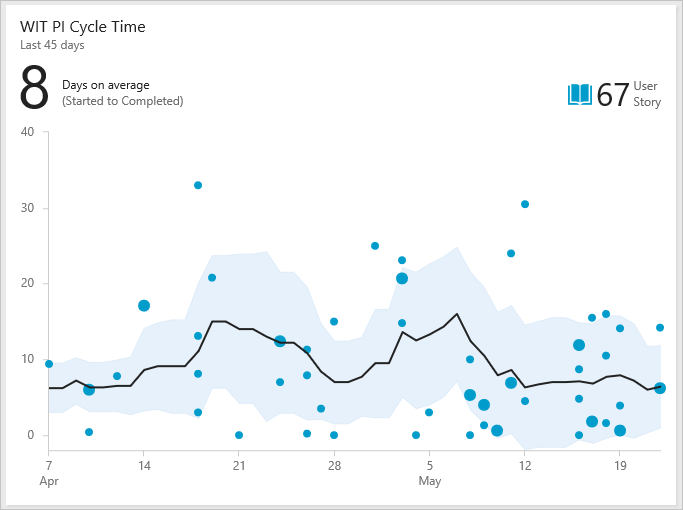
For more information, see Cycle Time and lead time control charts.
The Lead Time widget will help you analyze the time it takes to deliver work from your backlog. Lead Time measures the total time elapsed from the creation of work items to their completion. Using the Lead Time widget, you can answer questions like:
Lead Time widget showing 60 days of data
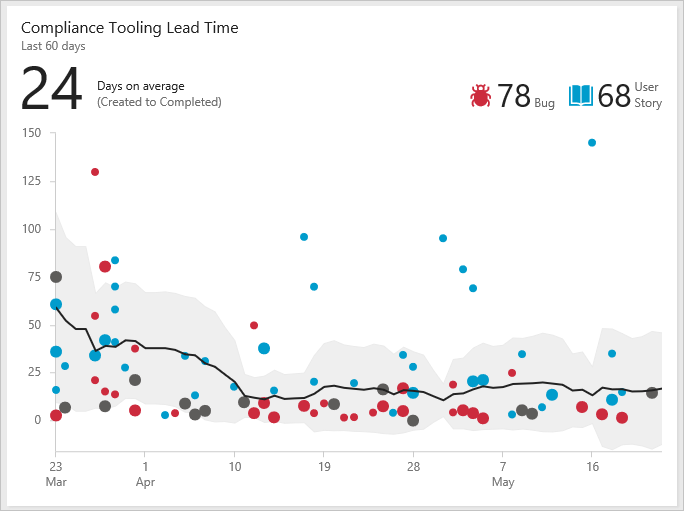
For more information, see Cycle Time and lead time control charts.
The Velocity widget will help you learn how much work your team can complete during a sprint. The widget shows the team's velocity by Story Points, work item count, or any custom field. It allows you to compare the work delivered against your plan and track work that's completed late. Using the Velocity widget, you can answer questions like:
Velocity widget showing 8 sprints of data based on Story Points
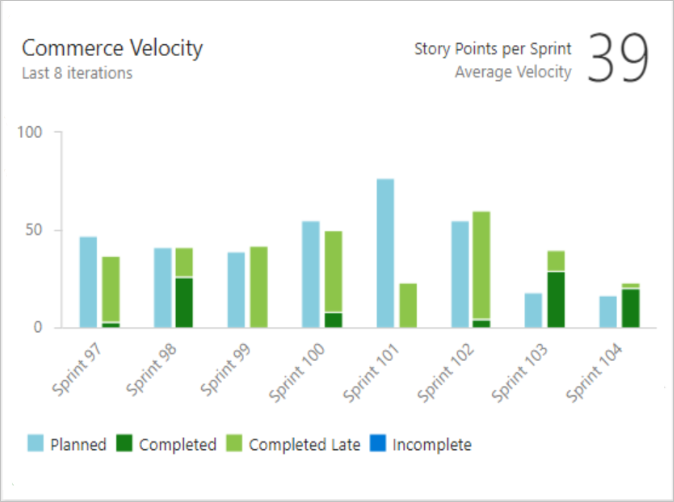
For more information, see Configure and view Velocity widgets.
With the Test Results Trend (Advanced) widget, you can track the test quality of your pipelines over time. Tracking test quality and improving test collateral are essential tasks to maintaining a healthy DevOps pipeline.
The widget shows a trend of your test results for either build or release pipelines. You can track the daily count of tests, pass rates, and test duration. The highly configurable widget allows you to use it for a wide variety of scenarios.
You can find outliers in your test results and answer questions like:
Test trend widget showing passed test results and pass rate for the last 7 days grouped by Priority
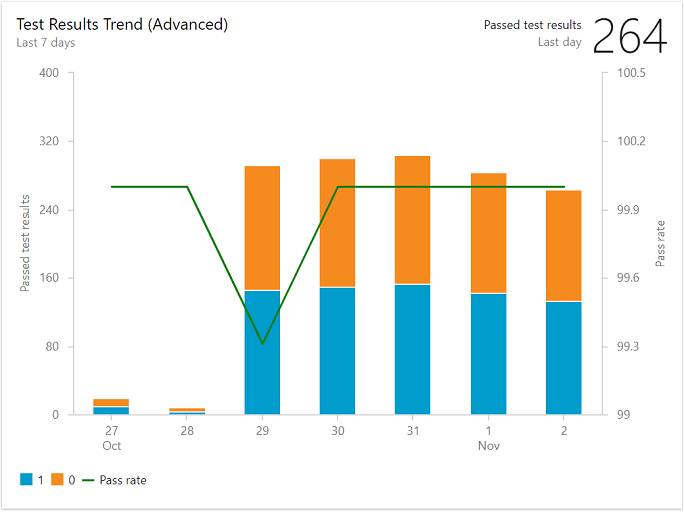
For more information, see Configure a test results widget.
Events
17 Mar, 23 - 21 Mar, 23
Join the meetup series to build scalable AI solutions based on real-world use cases with fellow developers and experts.
Register nowTraining
Learning path
Use advance techniques in canvas apps to perform custom updates and optimization - Training
Use advance techniques in canvas apps to perform custom updates and optimization
Certification
Microsoft Certified: Power BI Data Analyst Associate - Certifications
Demonstrate methods and best practices that align with business and technical requirements for modeling, visualizing, and analyzing data with Microsoft Power BI.