Events
17 Mar, 21 - 21 Mar, 10
Join the meetup series to build scalable AI solutions based on real-world use cases with fellow developers and experts.
Register nowThis browser is no longer supported.
Upgrade to Microsoft Edge to take advantage of the latest features, security updates, and technical support.
Azure DevOps Services | Azure DevOps Server 2022 - Azure DevOps Server 2019
Analytics is the reporting platform for Azure DevOps, replacing the previous platform based on SQL Server Reporting Services. Built for reporting, Analytics is optimized for fast read-access and server-based aggregations. Use it to answer quantitative questions about the past or present state of your projects.
Note
If you are looking for information about Azure Analysis Services, see Azure Analysis Services.
Specifically, Analytics provides you with insights about your Azure DevOps projects through the following tools:
Note
The Analytics service is automatically enabled and supported in production for all Azure DevOps Services. Power BI integration and access to the OData feed of the Analytics Service are generally available. We encourage you to use it and give us feedback.
Available data is version-dependent. The latest supported version is v2.0, and the latest preview version is v4.0-preview. For more information, see OData API versioning.
Note
The Analytics service is automatically installed and supported in production for all new project collections for Azure DevOps Server 2020 and later versions. Power BI integration and access to the OData feed of the Analytics Service are generally available. We encourage you to use it and give us feedback. If you upgraded from Azure DevOps Server 2019, then you can install the Analytics service during upgrade.
Available data is version-dependent. The latest supported version is v2.0, and the latest preview version is v4.0-preview. For more information, see OData API versioning.
Note
The Analytics service is in preview for Azure DevOps Server 2019. You can enable or install it for a project collection. Power BI integration and access to the OData feed of the Analytics Service are in Preview. We encourage you to use it and give us feedback.
Available data is version-dependent. The latest supported version is v2.0, and the latest preview version is v4.0-preview. For more information, see OData API versioning.
Analytics is generally available for Azure DevOps Service and Azure DevOps Server 2020 and later versions. It is in preview for Azure DevOps Server 2019. The service provides a concise data model over Azure DevOps.
Data available via the Analytics service depends on your version and platform. For specifics, read Data available in Analytics and Data model for Analytics.
Analytics is enabled for all Azure DevOps Services projects and automatically populates itself with all available Azure DevOps data. Once populated, it updates itself as data changes occur. For more information, read Data available in Analytics and Performance and latency.
Analytics is enabled for all projects on new project collections and automatically populates itself with all available Azure DevOps data. Once populated, it updates itself as data changes occur. For more information, read Data available in Analytics and Performance and latency.
Once you've enabled or installed Analytics, the service populates itself with all available Azure DevOps data. Once populated, it updates itself as data changes occur. For more information, read Data available in Analytics and Performance and latency.
You can create dashboards and add widgets to them. We provide several widgets based on Analytics. These widgets take advantage of the power of Analytics. Widgets provide the easiest way to get insights from your data.
For example, the Velocity widget shown in the following image provides insights into a team's historical performance over six iterations.
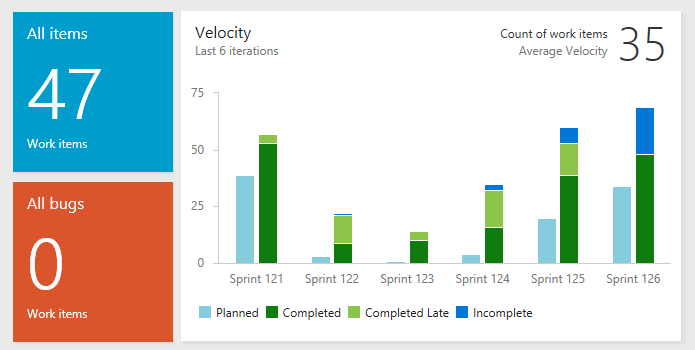
Here, the Velocity widget shows that this team has a history of closing stories late. It also shows a discrepancy between planned and completed work across all the sprints displayed. The team can drill into the data to determine the root causes. After implementing new practices, the team can use the Velocity widget to track their effectiveness.
Check out Add an Analytics widget to a dashboard for a step-by-step guide to get started with the Velocity widget.
If you want to develop your own widget based on Analytics, see Create an Analytics widget.
Work tracking in-context reports are now based on Analytics data. These reports appear on the Analytics tab of the product and portfolio backlogs and boards. Also, there are some pipelines and test in-context reports. For more information, see the following articles:
Also, you can add rollup columns to product and portfolio backlogs that provide progress bars, counts of work items, or sums of selected fields. For details, see Display rollup progress or totals.
Analytics views is a web portal feature that supports filtering work tracking data for status and trend reports. With Analytics views, you can use default or custom views to generate reports in Power BI. Power BI provides a data connector for Analytics views.
For more information, see What are Analytics views?.
Analytics is fully accessible via OData. From a web browser, you can query the Analytics metadata or data using an OData query. To learn how, see Construct OData queries for Analytics.
If you would like to prepare custom queries and tooling with our OData API, review Sample reports and quick reference index.
Power BI is a suite of business analytics tools. The following data connectors have been implemented to support importing data into Power BI.
With Power BI, you can perform impromptu analysis, produce beautiful reports, and publish dashboards for enterprise consumption.
To get started with Power BI and Azure DevOps Analytics:
Custom fields and custom work item types are automatically added to the Analytics data model. Through OData queries, you can view the properties and enumerated lists added to the Analytics service based on process customization.
Events
17 Mar, 21 - 21 Mar, 10
Join the meetup series to build scalable AI solutions based on real-world use cases with fellow developers and experts.
Register nowTraining
Learning path
Use advance techniques in canvas apps to perform custom updates and optimization - Training
Use advance techniques in canvas apps to perform custom updates and optimization
Certification
Microsoft Certified: Fabric Analytics Engineer Associate - Certifications
As a Fabric analytics engineer associate, you should have subject matter expertise in designing, creating, and deploying enterprise-scale data analytics solutions.
Documentation
Reporting roadmap - Azure DevOps
Learn about the reporting roadmap for Azure DevOps.
Analytics & Reporting - Azure DevOps
Add, view, manage, and monitor status and trends with dashboards, widgets, Analytics & Power BI.
Sample reports and quick reference index for the Analytics service - Azure DevOps
An index of articles that explain how to generate results using OData backed Analytics for Azure DevOps.