Events
Power BI DataViz World Championships
14 Feb, 16 - 31 Mar, 16
With 4 chances to enter, you could win a conference package and make it to the LIVE Grand Finale in Las Vegas
Learn moreThis browser is no longer supported.
Upgrade to Microsoft Edge to take advantage of the latest features, security updates, and technical support.
With the Power BI Publish to web option, you can easily embed interactive Power BI content in blog posts, websites, emails, or social media. You can also easily edit, update, refresh, or stop sharing your published visuals.
Warning
When you use Publish to web, anyone on the Internet can view your published report or visual. Viewing requires no authentication. It includes viewing detail-level data that your reports aggregate. Before publishing a report, make sure it's okay for you to share the data and visualizations publicly. Don't publish confidential or proprietary information. If in doubt, check your organization's policies before publishing.
Note
You can embed your content securely in an internal portal or website. Use the Embed or Embed in SharePoint Online options. These options ensure that all permissions and data security are enforced when your users view your internal data.
See the Considerations and limitations section below for a complete list of cases where Publish to web isn't supported.
Follow these steps to use Publish to web. Review the Warning earlier in this article before publishing to web.
Open a report in a workspace that you can edit, and select File > Embed report > Publish to web (public).

If your Power BI admin hasn't allowed you to create embed codes, you may need to contact them.
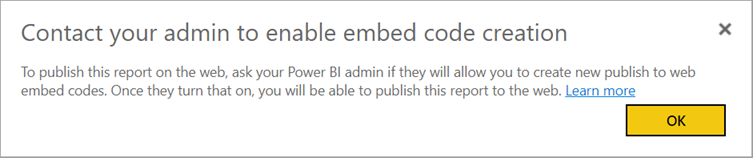
For help with finding the person who can enable Publish to web in your organization, see How to find your Power BI administrator later in this article.
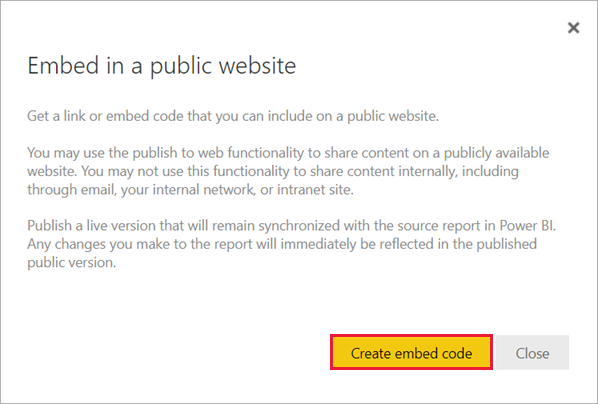
Review the dialog content and select Create embed code.
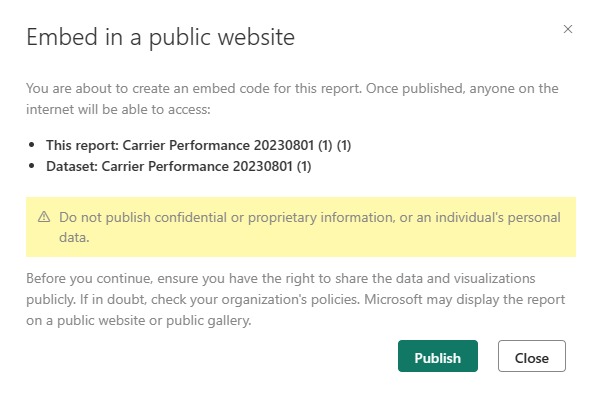
Review the warning, as shown here, and confirm that the data is okay to embed in a public website. If it is, select Publish.
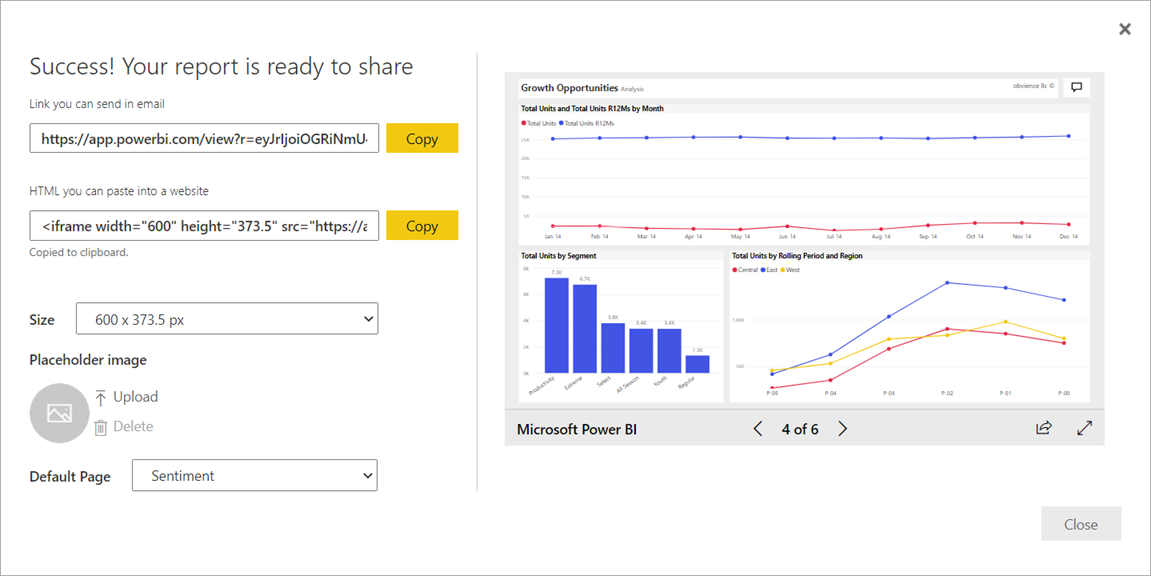
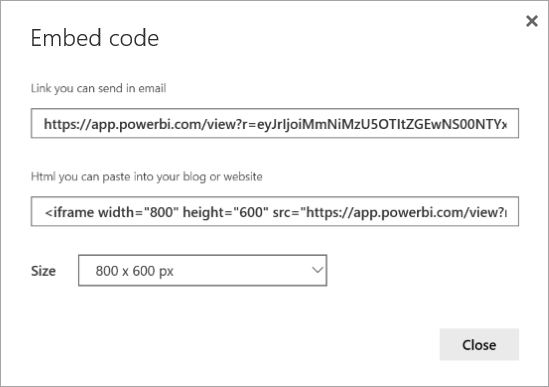
In the Success dialog, you see a preview of how the report will look. Select the Size and Default page.
You can also add a Placeholder image, to make the web page load faster. With a placeholder image, people viewing your report on the web see a View interactive content button they can select to view the report itself.
Make those changes first. Then copy the link to send it in email, or copy the HTML to paste into a website. You can embed it in code such as an iFrame, or paste it directly into a web page or blog.
If you previously created an embed code for a report and you select Publish to web, you won't see the dialogs in steps 2-4. Instead, you see the Embed code dialog.
You can only create one embed code for each report.
When you embed content within a blog post, you typically need to fit it within a specific screen size. You can adjust the height and the width in the iFrame tag as needed. However, you need to ensure your report fits within the given iFrame area, so set an appropriate View Mode when you're editing the report.
The following table provides guidance about the View Mode, and how it will appear when embedded.
| View Mode | How it looks when embedded |
|---|---|
 |
Fit to page respects your report's page height and width. If you set your page to dynamic ratios like 16:9 or 4:3, your content scales to fit within the iFrame. When embedded in an iFrame, using Fit to page can result in letterboxing: a gray background is shown in iFrame areas after the content scales to fit within the iFrame. To minimize letterboxing, set the height and width of the iFrame appropriately. |
 |
Actual size ensures the report preserves its size as set on the report page. This can result in scrollbars appearing in your iFrame. Set the iFrame height and width to avoid scrollbars. |
 |
Fit to width ensures the content fills the horizontal area of the iFrame. A border is still shown, but the content scales to use all the horizontal space available. |
A Publish to web embed code looks like the following example:
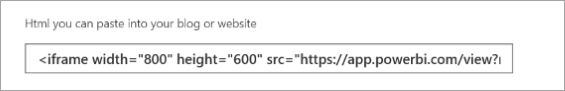
You can edit the width and height manually to ensure it's precisely how you want it to fit in the page where you're embedding it.
To achieve a more perfect fit, you can try adding 56 pixels to the height of the iFrame to accommodate the current size of the bottom bar. If your report page uses the dynamic size, the table below provides some sizes you can use to achieve a fit without letterboxing.
| Ratio | Size | Dimension (width x height) |
|---|---|---|
| 16:9 | Small | 640 x 416 px |
| 16:9 | Medium | 800 x 506 px |
| 16:9 | Large | 960 x 596 px |
| 4:3 | Small | 640 x 536 px |
| 4:3 | Medium | 800 x 656 px |
| 4:3 | Large | 960 x 776 px |
Once you create a Publish to web embed code, you can manage your codes from the Settings menu in Power BI. Managing embed codes includes the ability to remove the destination visual or report for a code (rendering the embed code unusable), or getting the embed code.
To manage your Publish to web embed codes, open the workspace the report resides in, select the Settings gear, and select Manage embed codes.

The embed codes for the reports in that workspace appear.
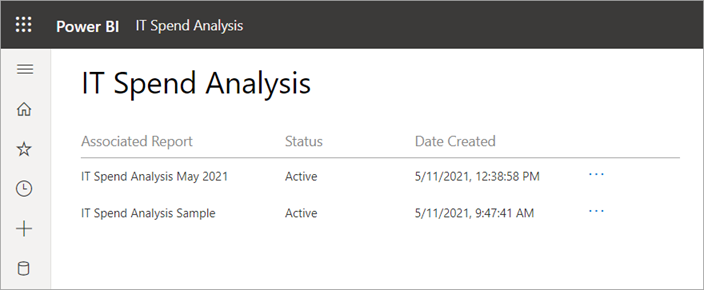
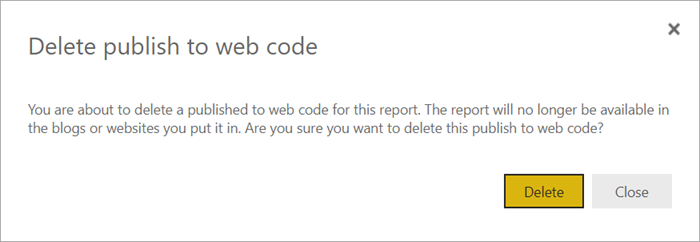
You can either retrieve or delete an embed code. Deleting it disables any links to that report or visual.

If you select Delete, you're asked for a confirmation.
After you create your Publish to web embed code and share it, the report updates with any changes you make. The embed code link is immediately active. Anyone who opens the link can view it. The data is cached for one hour from the time it is retrieved. We don’t recommend using Publish to web for data that needs to refresh frequently. To learn more, see the How it works section later in this article.
Data refreshes are automatically reflected in your embedded report or visual. When data is refreshed for an import data model in the Power BI service, the service clears the data cache, making data update quickly. To disable automatic refresh, select don't refresh on the schedule for the semantic model the report uses.
A heavy usage experience can occur when a report receives too many queries in a short amount of time. When heavy usage occurs, users can't view or interact with the report until the period of heavy usage passes.
We recommend setting a placeholder image for your report. If heavy usage occurs, users see the placeholder image.
To help avoid the heavy usage experience, limit the number of distinct queries your report can generate and the frequency of data refresh. See the Power BI optimization guide for tips on streamlining your reports.
Power BI visuals are supported in Publish to web. When you use Publish to web, users with whom you share your published visual don't need to enable Power BI visuals to view the report.
Note
Review the embed codes you've published often. Remove any that no longer need to be available publicly.
The Manage embed codes page includes a status column. By default, embed codes are Active, but could also be one of the statuses listed below.
| Status | Description |
|---|---|
| Active | The report is available for Internet users to view and interact with. |
| Blocked | The report content violates the Power BI Terms of Service. Microsoft has blocked it. Contact support if you believe the content was blocked in error. |
| Not supported | The report's semantic model is using row-level security, or another unsupported configuration. See the Considerations and imitations section for a complete list. |
| Infringed | The embed code is outside the defined tenant policy. This status typically occurs when an embed code was created and then the Publish to web tenant setting was changed to exclude the user owning the embed code. If the tenant setting is disabled, or the user is no longer allowed to create embed codes, existing embed codes show an Infringed status. See the Find your Power BI administrator section in this article for details. |
To report a concern related to Publish to web content embedded in a website or blog, select the Share icon in the bottom bar of the Publish to web report, then select the Flag icon in the Share dialog box.

You're asked to send an email to Microsoft explaining your concern. Microsoft evaluates the content based on the Power BI Terms of Service and takes appropriate action.
When you create an embed code using Publish to web, the report is made visible to Internet users. It's publicly available, so you can expect viewers to easily share the report through social media in the future. Users view the report either by opening the direct public URL or viewing it embedded in a web page or blog. As they do, Power BI caches the report definition and the results of the queries required to view the report. This caching ensures that thousands of concurrent users can view the report without impacting performance.
The data is cached for one hour from the time it is retrieved. If you update the report definition (for example, if you change its View mode) or refresh the report data, it can take some time before changes are reflected in the version of the report that your users view. When a data refresh occurs for an import data model, the service clears the cached data and retrieves new data. In most cases, the data is updated nearly simultaneous with the import of the data. However, for reports with many distinct queries, it may take some time to update. Since each element and data value is cached independently, when a data update occurs, a user may see a mix of current and previous values. Therefore, we recommend staging your work ahead of time, and creating the Publish to web embed code only when you're satisfied with the settings. If your data will refresh, minimize the number of refreshes and perform the refreshes at off hours. We don’t recommend using Publish to web for data that needs to refresh frequently.
The Power BI admin portal has settings that control who can publish to the web. Work with your organization's Power BI administrator to change the Publish to web tenant settings in the admin portal.
For smaller organizations or individuals who signed up for Power BI, you may not have a Power BI administrator yet. Follow our process for admin takeover. Once you have a Power BI administrator, they can enable creating embed codes for you.
Established organizations usually already have a Power BI administrator. Users with the Fabric administrator role in Microsoft Entra ID can act as a Power BI administrator.
You need to find one of these people in your organization and ask them to update the Publish to web tenant settings in the admin portal.
Publish to web is supported for the vast majority of data sources and reports in the Power BI service. However, the following kinds of reports are currently not supported or available with Publish to web:
More questions? Try the Power BI Community
Events
Power BI DataViz World Championships
14 Feb, 16 - 31 Mar, 16
With 4 chances to enter, you could win a conference package and make it to the LIVE Grand Finale in Las Vegas
Learn moreTraining
Module
Publish and share in Power BI - Training
Publish and share your Power BI reports and dashboards to teammates in your organization or to everyone on the web.
Certification
Microsoft Certified: Power BI Data Analyst Associate - Certifications
Demonstrate methods and best practices that align with business and technical requirements for modeling, visualizing, and analyzing data with Microsoft Power BI.