Events
Power BI DataViz World Championships
14 Feb, 16 - 31 Mar, 16
With 4 chances to enter, you could win a conference package and make it to the LIVE Grand Finale in Las Vegas
Learn moreThis browser is no longer supported.
Upgrade to Microsoft Edge to take advantage of the latest features, security updates, and technical support.
In this quickstart, you connect to data using Power BI Desktop, which is the first step in building data models and creating reports.

If you're not signed up for Power BI, sign up for a free trial before you begin.
To complete the steps in this article, you need the following resources:
Once you install Power BI Desktop, launch the application so it's running on your local computer. You're presented with a Power BI tutorial. Follow the tutorial or close the dialog to start with a blank canvas. The canvas is where you create visuals and reports from your data.

With Power BI Desktop, you can connect to many different types of data. These sources include basic data sources, such as a Microsoft Excel file. You can connect to online services that contain all sorts of data, such as Salesforce, Microsoft Dynamics, Azure Blob Storage, and many more.
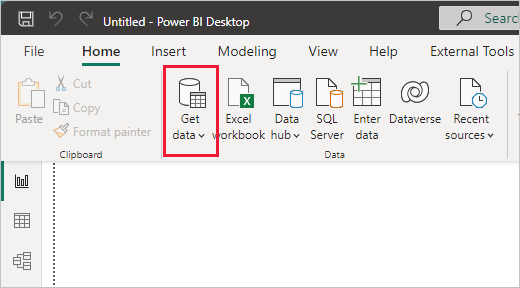
To connect to data, from the Home ribbon select Get data.
The Get Data window appears. You can choose from the many different data sources to which Power BI Desktop can connect. In this quickstart, use the Excel workbook that you downloaded in Prerequisites.
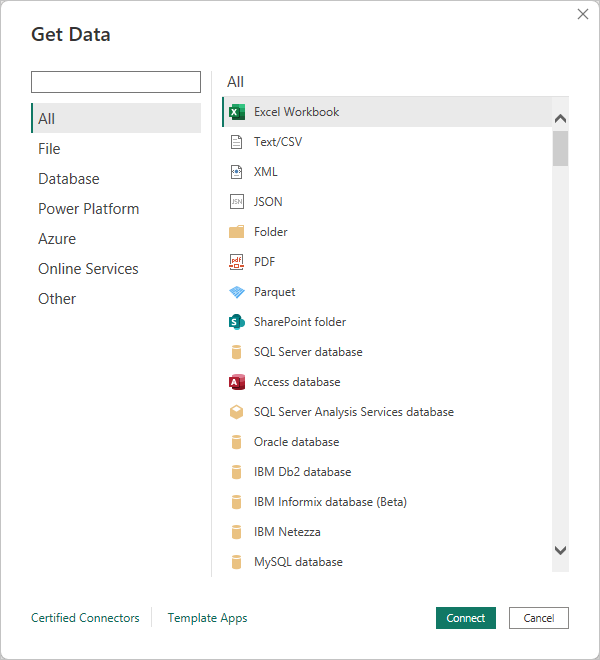
Since this data source is an Excel file, select Excel from the Get Data window, then select the Connect button.
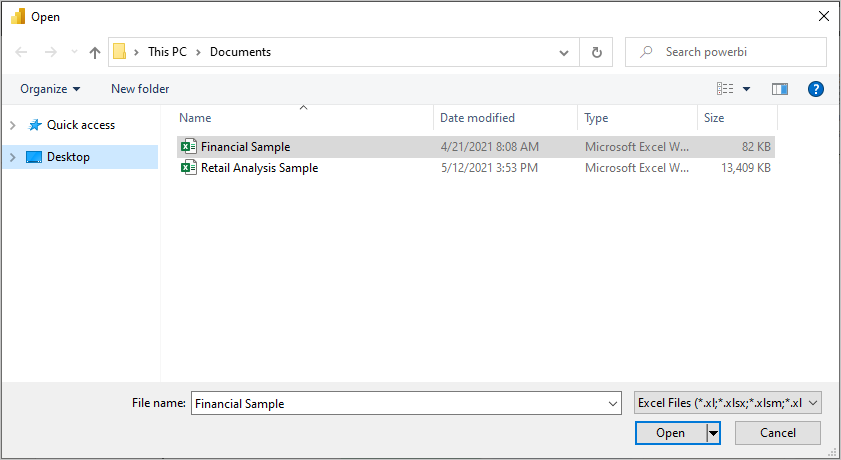
Power BI prompts you to provide the location of the Excel file to which to connect. The downloaded file is called Financial Sample. Select that file, and then select Open.
Power BI Desktop then loads the workbook and reads its contents, and shows you the available data in the file using the Navigator window. In that window, you can choose which data you would like to load into Power BI Desktop. Select the tables by marking the checkboxes beside each table you want to import. Import both available tables.

Once you've made your selections, select Load to import the data into Power BI Desktop.
Once you've loaded the tables, the Fields pane shows you the data. You can expand each table by selecting the arrow beside its name. In the following image, the financials table is expanded, showing each of its fields.

And that's it! You've connected to data in Power BI Desktop, loaded that data, and now you can see all the available fields within those tables.
There are all sorts of things you can do with Power BI Desktop once you've connected to data. You can create visuals and reports. Take a look at the following resource to get you going:
Events
Power BI DataViz World Championships
14 Feb, 16 - 31 Mar, 16
With 4 chances to enter, you could win a conference package and make it to the LIVE Grand Finale in Las Vegas
Learn moreTraining
Module
Get data with Power BI Desktop - Training
How can you find, collect, and clean data from different sources? Power BI is a tool for making sense of your data. You will learn tricks to make data-gathering easier.
Certification
Microsoft Certified: Power BI Data Analyst Associate - Certifications
Demonstrate methods and best practices that align with business and technical requirements for modeling, visualizing, and analyzing data with Microsoft Power BI.
Documentation
Connect to data in Power BI - documentation - Power BI
Power BI documentation provides expert information for connecting to data with tools such as gateways, template apps, and data refresh.
Connect to data in Power BI Desktop - Power BI
Practice how to bring connect to data and transform it for use in Power BI Desktop by using sample data from the internet.
Data sources for the Power BI service - Power BI
Learn about different data sources and how to get and refresh data sources and semantic models in the Power BI service.