Note
Access to this page requires authorization. You can try signing in or changing directories.
Access to this page requires authorization. You can try changing directories.
MLflow Tracing provides comprehensive observability for production AI agents deployed outside of Databricks by capturing execution details and sending them to your Databricks workspace, where you can view them in the MLflow UI.
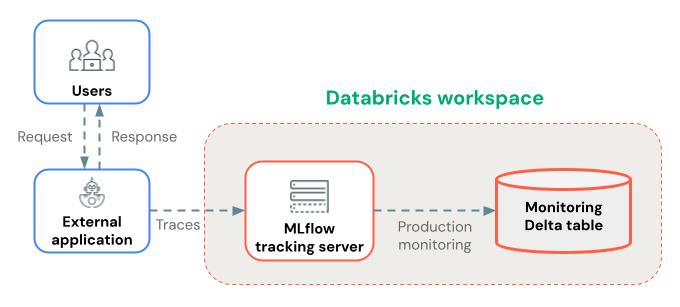
This page covers deploying agents outside of Databricks with tracing enabled. If your agent is deployed on Databricks, see Trace agents deployed on Databricks.
Store traces in Unity Catalog
Traces from your externally hosted agent are sent to your Azure Databricks workspace and logged to an MLflow experiment, which is the entry point for viewing them in the MLflow UI. What differs is the storage location that backs the experiment. You have two choices:
- Unity Catalog storage (recommended for production): Bind the experiment to a Unity Catalog trace location so traces land in Unity Catalog Delta tables. This takes some setup before you deploy. In return, you get long-term retention of large trace volumes with no per-experiment limit. Traces are governed by Unity Catalog catalog, schema, and table permissions, and you can query them directly with SQL through a Databricks SQL warehouse.
- Experiment-based storage (default): If you don't configure a trace location, traces are stored as experiment artifacts. This is convenient for development, but has a per-experiment trace limit and isn't optimized for querying large volumes of production traces.
Because Unity Catalog storage runs outside Azure Databricks here, create the Unity Catalog-backed experiment from a Azure Databricks notebook, then reference it by name or ID in the environment variables below. See Store OpenTelemetry traces in Unity Catalog for the full setup, prerequisites, and permissions.
Prerequisites
Install the required packages. The following table describes your options:
| Package | Recommended use case | Benefits |
|---|---|---|
mlflow-tracing Python SDK or TypeScript SDK |
Production deployments | Minimal dependencies for lean, fast deployments Performance optimized for high-volume tracing Focused on client-side tracing for production monitoring |
mlflow[databricks] |
Development and experimentation | Full MLflow experimentation feature set (UI, LLM-as-a-judge, dev tools, and more) Includes all development tools and utilities |
## Install mlflow-tracing for production deployment tracing
%pip install --upgrade "mlflow-tracing==3.1.0"

## Install mlflow for experimentation and development
%pip install --upgrade "mlflow[databricks]==3.1.0"
Basic tracing setup
Configure your application deployment to connect to your Databricks workspace so Databricks can collect traces.
Configure the following environment variables:
# Required: Set the Databricks workspace host and authentication token
export DATABRICKS_HOST="https://your-workspace.cloud.databricks.com"
export DATABRICKS_TOKEN="your-databricks-token"

# Required: Set MLflow Tracking URI to "databricks" to log to Databricks
export MLFLOW_TRACKING_URI=databricks

# Required: Configure the experiment name for organizing traces (must be a workspace path)
export MLFLOW_EXPERIMENT_NAME="/Shared/production-genai-app"
Deployment examples
After the environment variables are set, pass them to your application. Click the tabs to see how to pass the connection details to different frameworks.
Docker
For Docker deployments, pass the environment variables through the container configuration:
# Dockerfile
FROM python:3.11-slim

# Install dependencies
COPY requirements.txt .
RUN pip install -r requirements.txt

# Copy application code
COPY . /app
WORKDIR /app

# Set default environment variables (can be overridden at runtime)
ENV DATABRICKS_HOST=""
ENV DATABRICKS_TOKEN=""
ENV MLFLOW_TRACKING_URI=databricks
ENV MLFLOW_EXPERIMENT_NAME="/Shared/production-genai-app"

CMD ["python", "app.py"]
Run the container with environment variables:
docker run -d \
  -e DATABRICKS_HOST="https://your-workspace.cloud.databricks.com" \
  -e DATABRICKS_TOKEN="your-databricks-token" \
  -e MLFLOW_TRACKING_URI=databricks \
  -e MLFLOW_EXPERIMENT_NAME="/Shared/production-genai-app" \
  -e APP_VERSION="1.0.0" \
  your-app:latest
Kubernetes
For Kubernetes deployments, pass the environment variables using ConfigMaps and Secrets:
# configmap.yaml
apiVersion: v1
kind: ConfigMap
metadata:
  name: databricks-config
data:
  DATABRICKS_HOST: 'https://your-workspace.cloud.databricks.com'
  MLFLOW_TRACKING_URI: databricks
  MLFLOW_EXPERIMENT_NAME: '/Shared/production-genai-app'

---
# secret.yaml
apiVersion: v1
kind: Secret
metadata:
  name: databricks-secrets
type: Opaque
stringData:
  DATABRICKS_TOKEN: 'your-databricks-token'

---
# deployment.yaml
apiVersion: apps/v1
kind: Deployment
metadata:
  name: genai-app
spec:
  template:
    spec:
      containers:
        - name: app
          image: your-app:latest
          envFrom:
            - configMapRef:
                name: databricks-config
            - secretRef:
                name: databricks-secrets
          env:
            - name: APP_VERSION
              value: '1.0.0'
Verify trace collection
After deploying your app, verify that traces are collected properly:
import mlflow
from mlflow.client import MlflowClient
import os

# Ensure MLflow is configured for Databricks
mlflow.set_tracking_uri("databricks")

# Check connection to MLflow server
client = MlflowClient()
try:
    # List recent experiments to verify connectivity
    experiments = client.search_experiments()
    print(f"Connected to MLflow. Found {len(experiments)} experiments.")

    # Check if traces are being logged
    traces = mlflow.search_traces(
        experiment_names=[os.getenv("MLFLOW_EXPERIMENT_NAME", "/Shared/production-genai-app")],
        max_results=5
    )
    print(f"Found {len(traces)} recent traces.")
except Exception as e:
    print(f"Error connecting to MLflow: {e}")
    print(f"Check your authentication and connectivity")
Additional resources
- View traces in the Databricks MLflow UI - View traces in the MLflow UI.
- Store OpenTelemetry traces in Unity Catalog - Store production traces in governed Delta tables for long-term retention and analysis.
- Production monitoring - Run scorers on production traces to monitor application quality.
- Add context to traces - Attach user or session IDs, custom tags, or user feedback for better debugging and insights.