Note
Access to this page requires authorization. You can try signing in or changing directories.
Access to this page requires authorization. You can try changing directories.
Field parameters in Power BI let report readers dynamically change the measures or dimensions they're analyzing in a report. Readers can explore and customize the analysis by selecting different measures or dimensions from a slicer.
In the following video, learn how to create field parameters in Power BI Desktop and how report readers interact with them.
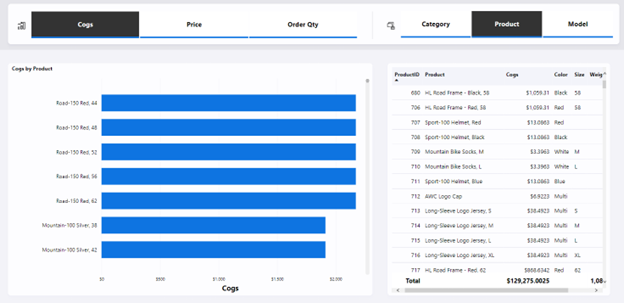
In the following example, the report reader can dynamically update the bar chart and table by selecting a field in the horizontal slicers above the visuals. Currently, the bar chart and table are measuring cost of goods sold (COGS) and analyzing by Product, based on the reader's selection in the slicers.
Create a field parameter
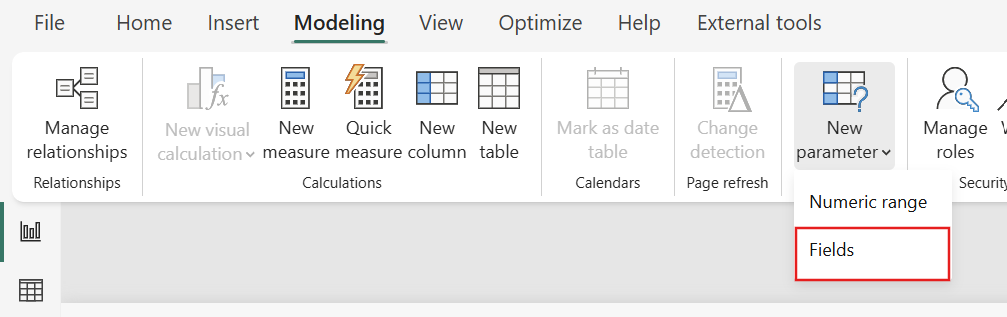
To create a new field parameter, go to the Modeling tab and select New parameter > Fields.
To build the parameter, provide a name for the parameter and select the fields you want to use. In this example, see the selected dimensions Customer, Color, Category, and Product.
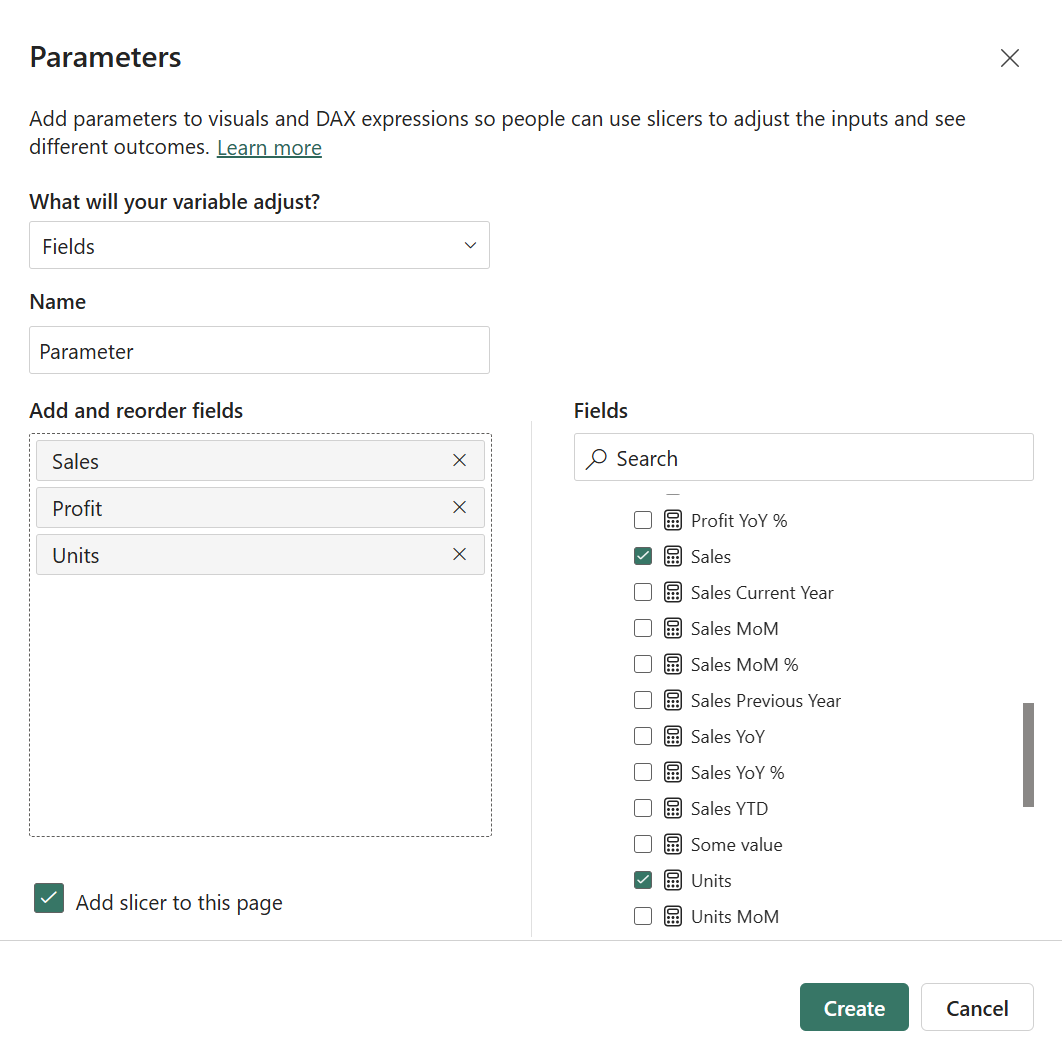
In this dialog, you can drag to change the order of the fields or double-click any of the selected fields to change the display name.
You can also mix and match measures and dimensions within the same parameter. For example, create a dynamic table where the columns can be either measures or dimensions.
Use a field parameter in visuals
After you create a field parameter, use the parameter to control the values and axis used in a visual.
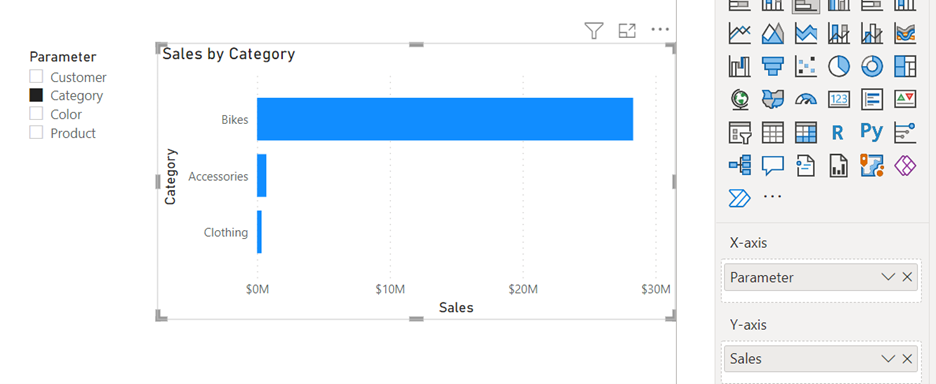
Use a column-based field parameter in the axis field wells of a visual, and use a measure-based field parameter in the values field wells. If the visual supports multiple measures, selecting multiple measures in the field parameter shows them side by side in the visual.
Use a field parameter in a slicer
When you use a field parameter in a slicer, you can display it in one of two ways: as a list of the fields in the parameter or as the values within each field.
By default, when you first add a field parameter to a slicer, the slicer shows the field names. Report viewers select a field name to control the fields used in other visuals bound to the parameter.
To show the values within each field instead:
- In the Build pane, right-click the field parameter.
- Select Show values of the selected field.
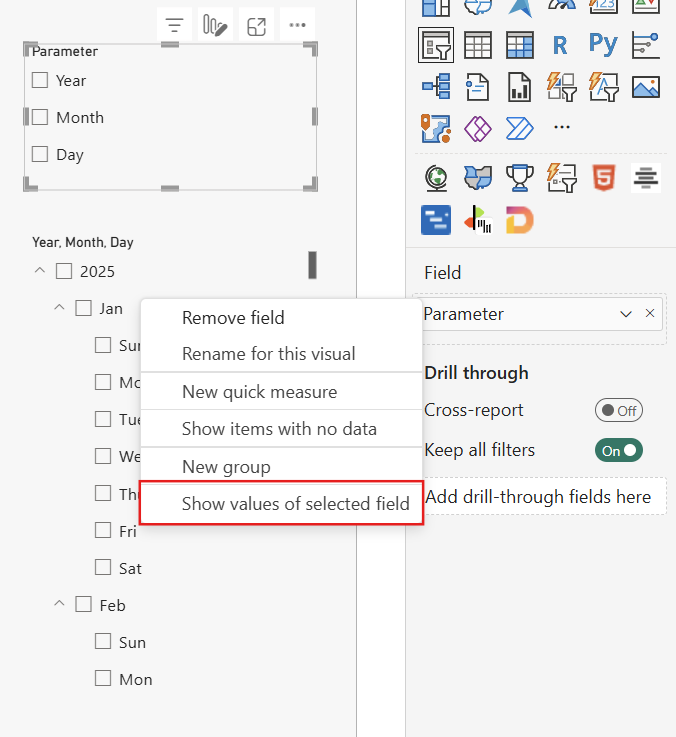
The slicer becomes a hierarchy slicer that displays the values of each field as a level in the hierarchy. This behavior applies to the slicer and list slicer visuals. The button slicer doesn't support hierarchies, so it shows only the values of the first field in the parameter.
To return to the list of field names, right-click the field parameter in the Build pane and select Show selected field.
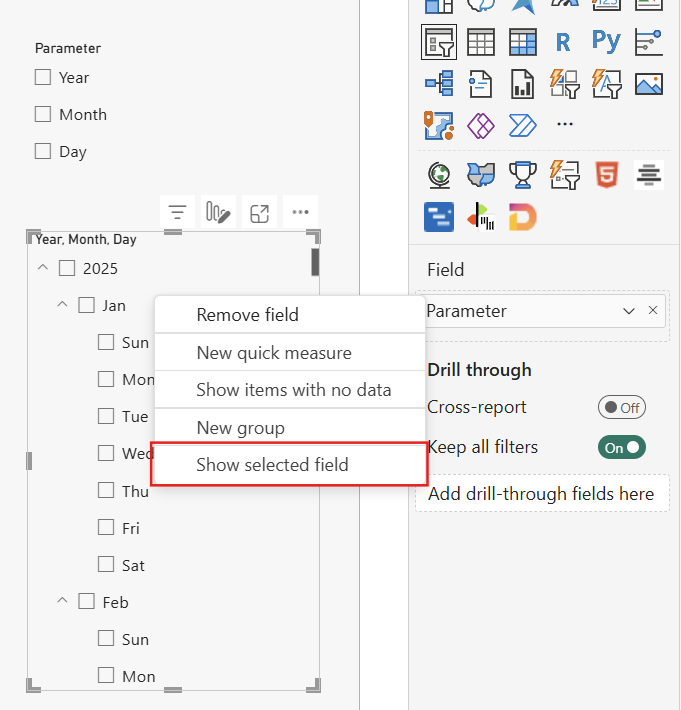
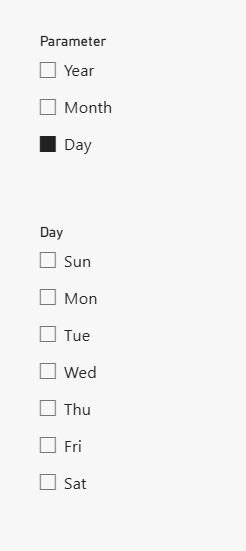
Showing values is useful in two scenarios:
- Force a selection before other slicers show values. With single select turned on for the slicer, report viewers must pick a value from the field parameter before another slicer bound to the parameter can show its values.
- Present a natural hierarchy in a single slicer. When the fields form a natural hierarchy, such as Year, Month, and Day of the week, report viewers can filter through the hierarchy or on a single level of the hierarchy without you needing to offer multiple slicers. For example, viewers can filter to Sunday across all years and months, or to Sunday within a specific year and month.
Note
This option is available only for field parameters that contain columns. It isn't available for field parameters that contain measures.
Edit a field parameter
To edit an existing field parameter, modify the Data Analysis Expressions (DAX) directly.
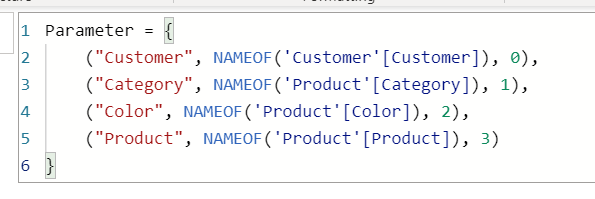
For example, if you want to add a new field to an existing parameter, select Shift + Enter to start a new entry. Add a comma between entries, and match the format shown in this example. The number after the comma indicates the order of the fields:
Parameter = {
    ("Customer", NAMEOF('Customer'[Customer]), 0),
    ("Category", NAMEOF('Product'[Category]), 1),
    ("Color", NAMEOF('Product'[Color]), 2),
    ("Product", NAMEOF('Product'[Product]), 3)
}
Note
The DAX defines four fields in the parameter, and for each field, three columns are provided: a name, column reference, and the order number. Although you can define extra columns in the DAX, this feature isn't supported and can lead to unexpected results. Define three columns for each field and use unique values for all columns.
Configure hierarchy-level persistence for field parameters
By default, Power BI retains the hierarchy level displayed in a matrix as field parameter selections change. You can turn off this behavior by using the Persist hierarchy level setting in the report settings. To find this option:
- In Power BI Desktop, go to Options and settings > Options > Current File > Report settings > Field Parameters > Persist hierarchy level.
- In Microsoft Fabric, go to the report settings and find Persist hierarchy level under Field parameter options.
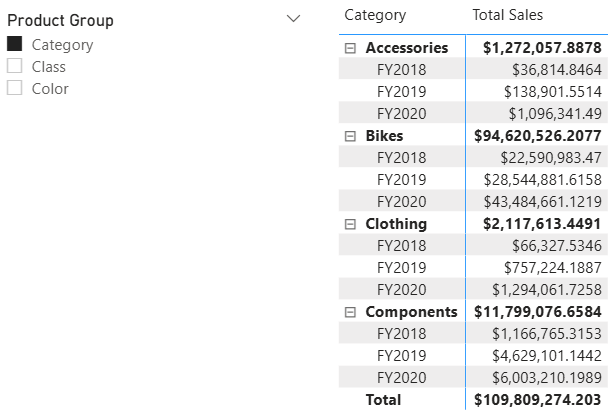
To illustrate the difference, consider a matrix showing a field parameter called Product Group and a column called Year on the rows, displaying Total sales. The field parameter allows selection of Category, Class, Color, or any combination. In this example, Category is selected, and the Categories are expanded, so you can see values broken down by Year:
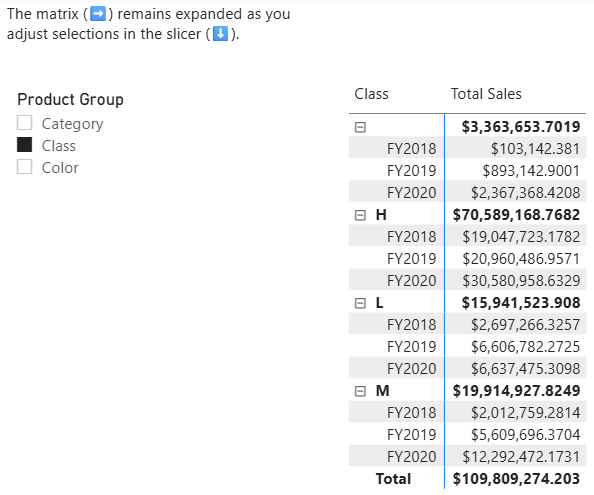
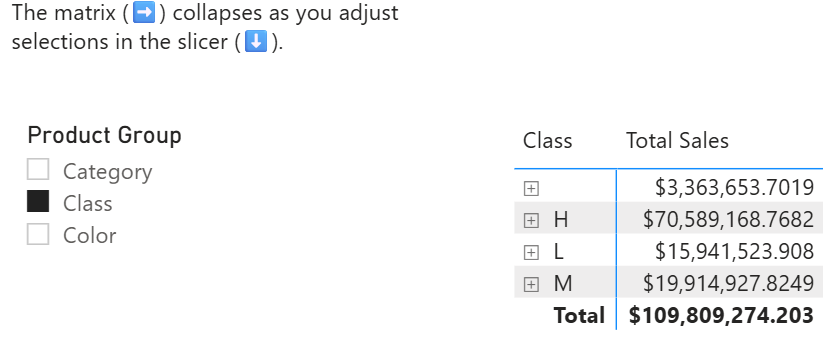
Now, when you change the field parameter from Category to Class, what happens depends on the Persist hierarchy level setting. If it's on, the matrix remains expanded, keeping the Year column visible; if it's off, the matrix collapses and displays only values for Class. The following comparison shows both behaviors based on whether the toggle is enabled or disabled.
| Persist hierarchy level setting on | Persist hierarchy level setting off |
|---|---|
|
|
Known limitations of field parameters
- If you use a date column in a field parameter with auto date/time, the Date Hierarchy is no longer associated with the date column in the field parameter. The behavior is the same as placing the date column directly on a visual axis without the hierarchy. To get Date Hierarchy behavior, create a field parameter using the hierarchy levels (Year, Quarter, Month, Day) explicitly.
- AI visuals and Q&A aren't supported with field parameters.
- There's no way for your report users to select the "none" or no fields option. Selecting no fields in the slicer or filter card is the same as selecting all fields.
- You can't create parameters in live connection data sources without a local model. However, if you use DirectQuery for Power BI semantic models and Analysis Services, you can add a local model to create field parameters. For more information about using DirectQuery for live connections, see Composite models on Power BI semantic models and Analysis Services.
- You can't use implicit measures, so if you need an aggregated column as one of your fields, you need to create an explicit DAX measure for it. For more information, see implicit vs. explicit measures.
- You can't use field parameters as the linked fields of a drill-through or tooltip page. The workaround is to use the individual fields referenced within the field parameter instead. For example, if your field parameter includes Customer and Product fields, you can link these two fields to your drill-through or tooltip page so that visuals with the field parameter can launch your drill-through or tooltip page.
Considerations for using field parameters
- When you use field parameters with Copilot, Copilot responds based on the current state of the visuals in the report.
- The order in which fields from a field parameter appear in a visual depends on the selection order. If you use a hierarchy slicer, the hierarchy slicer determines the field order instead.
Related content
For more information, see the following articles: