Visual Studio 2019 C++ debugger won't let me set data breakpoints

Norm Birkett 1 Reputation point
2020-08-17T21:31:15.77+00:00

I'm debugging native C++ code in a native DLL that is being called from a .NET assembly at run time.

Under Debug > New Breakpoint and Breakpoint window New button, Data Breakpoint is grayed out.

I know this feature is available only for native-code debugging. Does that mean I can't use it in native code within a .NET application?

Or is there something else I should try?

C++
C++
A high-level, general-purpose programming language, created as an extension of the C programming language, that has object-oriented, generic, and functional features in addition to facilities for low-level memory manipulation.
3,758 questions
Visual Studio Debugging
Visual Studio: A family of Microsoft suites of integrated development tools for building applications for Windows, the web and mobile devices.Debugging: The act or process of detecting, locating, and correcting logical or syntactical errors in a program or malfunctions in hardware. In hardware contexts, the term troubleshoot is the term more frequently used, especially if the problem is major.
1,004 questions
0 comments No comments
{count} votes

2 answers

Sort by: Most helpful
  1. Darran Rowe 1,031 Reputation points
    2020-08-18T03:45:12.317+00:00

    After looking around, it seems like won't happen in a mixed mode debugging session. The Visual Studio debugger will only allow you to set a data breakpoint if the debugger is the native C++ debugger. This means if the start up project is a C# project then you just can't set them.
    There is a post from all the way back in 2008 where a debugger program manager mentioned this. I also can't find any mention of this being changed during the last 12 years.
    There does seem to be sneaky ways of getting the debugger into native mode by selecting the C++ DLL project as the start up project and setting the C# executable as the start up command, also being sure to set the C++ debugger type to native only. This has the obvious problem of not being able to debug the managed side of the application though. But there seems to be no way to set C++ data breakpoints in the way you want to.

    1 person found this answer helpful.
    0 comments No comments

  2. Dylan Zhu-MSFT 6,421 Reputation points
    2020-08-18T09:14:15.2+00:00

    Hi NormBirkett-8967,

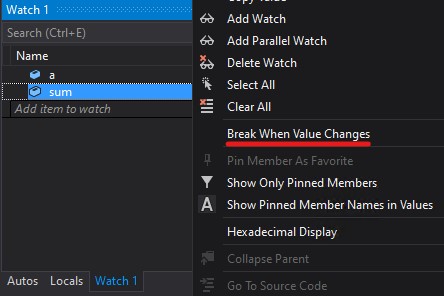
    Except for native C++ project, you can just set data breakpoint in .Net core 3.0 or higher project. When the debugger breaks at one breakpoint, you could right-click the value in Watch(/Autos/Locals) window, then select 'Break when value changes'. But you still cannot set it in Debug/New Breakpoint/Data Breakpoint.
    18335-annotation-2020-08-18-1228122232.jpg

    In addition, please note that the data breakpoint does not apply to:

    • Properties that are not expandable in the tooltip, Locals, Autos, or Watch window
    • Static variables
    • Classes with the DebuggerTypeProxy Attribute
    • Fields inside of structs

    Best Regards,
    Dylan

    0 comments No comments

Your answer

Answers can be marked as Accepted Answers by the question author, which helps users to know the answer solved the author's problem.