Note
Access to this page requires authorization. You can try signing in or changing directories.
Access to this page requires authorization. You can try changing directories.
Lakeflow Designer lets you build data transformation workflows on a visual, drag-and-drop canvas. This page explains how to create a visual data prep — from adding a data source and chaining operators to previewing results and writing to Unity Catalog.
Requirements
To use Lakeflow Designer, you must have:
- A Azure Databricks workspace with Unity Catalog enabled.
CAN USEpermission on at least one general purpose compute resource (serverless or all-purpose).
Select which compute to use from the compute picker in the top right of Designer, next to the Schedule button.
Create a new visual data prep
To create a new visual data prep, click  New in the sidebar and select Visual data prep.
Designer opens with a welcome screen where you can add a data source or explore a sample visual data prep.
To find your existing visual data prep files, open the Visual data prep page from the sidebar. This page lists all of your visual data prep files and includes a getting-started video to help you start using Lakeflow Designer.
Add a data source
Every visual data prep starts with one or more data sources. The Source operator represents a data source on the canvas.
To add a data source:
- Add a Source operator. From the welcome screen, click Select source operator. From the canvas, open the operator menu and select Source.
- In the Source configuration pane, choose how to bring in your data:
- Select an existing table.
- Upload a local CSV or Excel file.
- Create a table from a file.
- Import from Google Drive or SharePoint.
- Select or configure your data source. The Source operator appears on the canvas.
You can also drag and drop a CSV or Excel file directly onto the canvas to quickly create a Source operator.
To change the source later, open the Source operator and click Select a new data source. Changing the source invalidates the output cache for all downstream operators.
For the full details on each ingestion option, see Ingest data into Lakeflow Designer.
Add and configure operators
To add an operator, open the operator menu in the side pane on the left side of the canvas. Click an operator to add it to the canvas, or drag an operator from the menu onto the canvas. You can also click the + button next to any existing operator to add a new operator with an automatic connection.
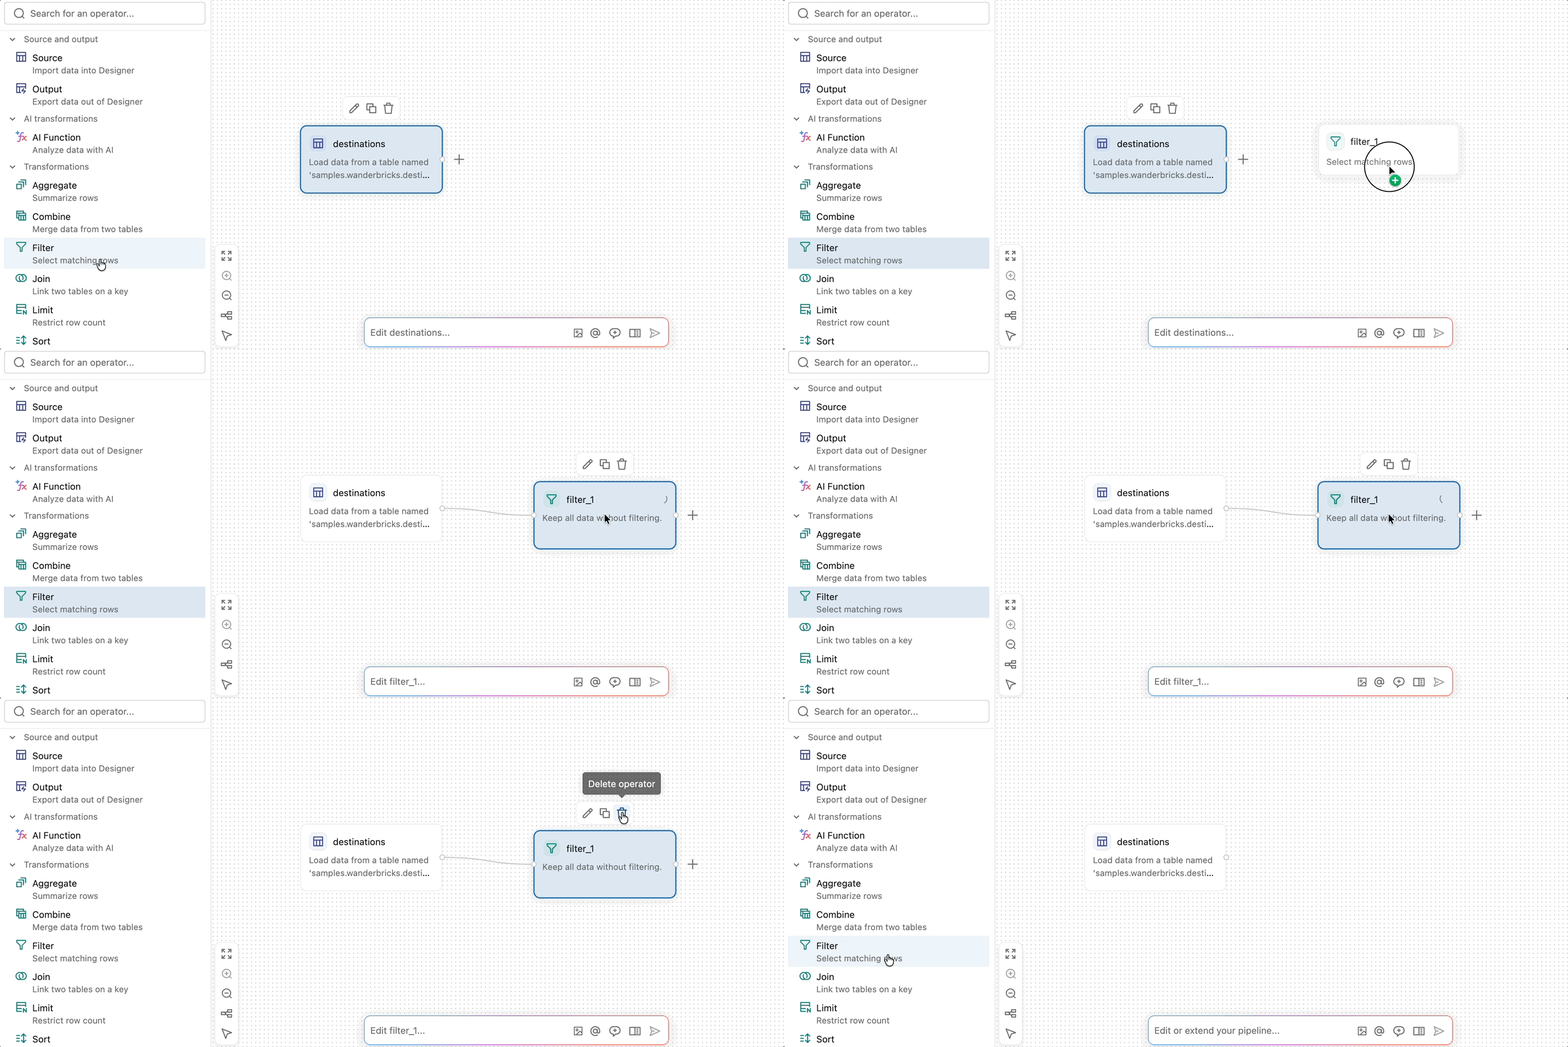
To configure an operator, double-click it, or hover over it and click  (Edit operator), to open the configuration pane. Set the options for that operator type, then click Apply.
For details on each available operator, see Built-in operators in Lakeflow Designer. For details on creating your own user-defined operators, see User-defined operators in Lakeflow Designer.
Connect operators
To connect two operators, click and drag from the output handle (the small circle on the right edge of an operator) to the input handle (the small circle on the left edge of the next operator). This specifies that data flows from the first operator into the second. Data flows from left to right through the visual data prep.
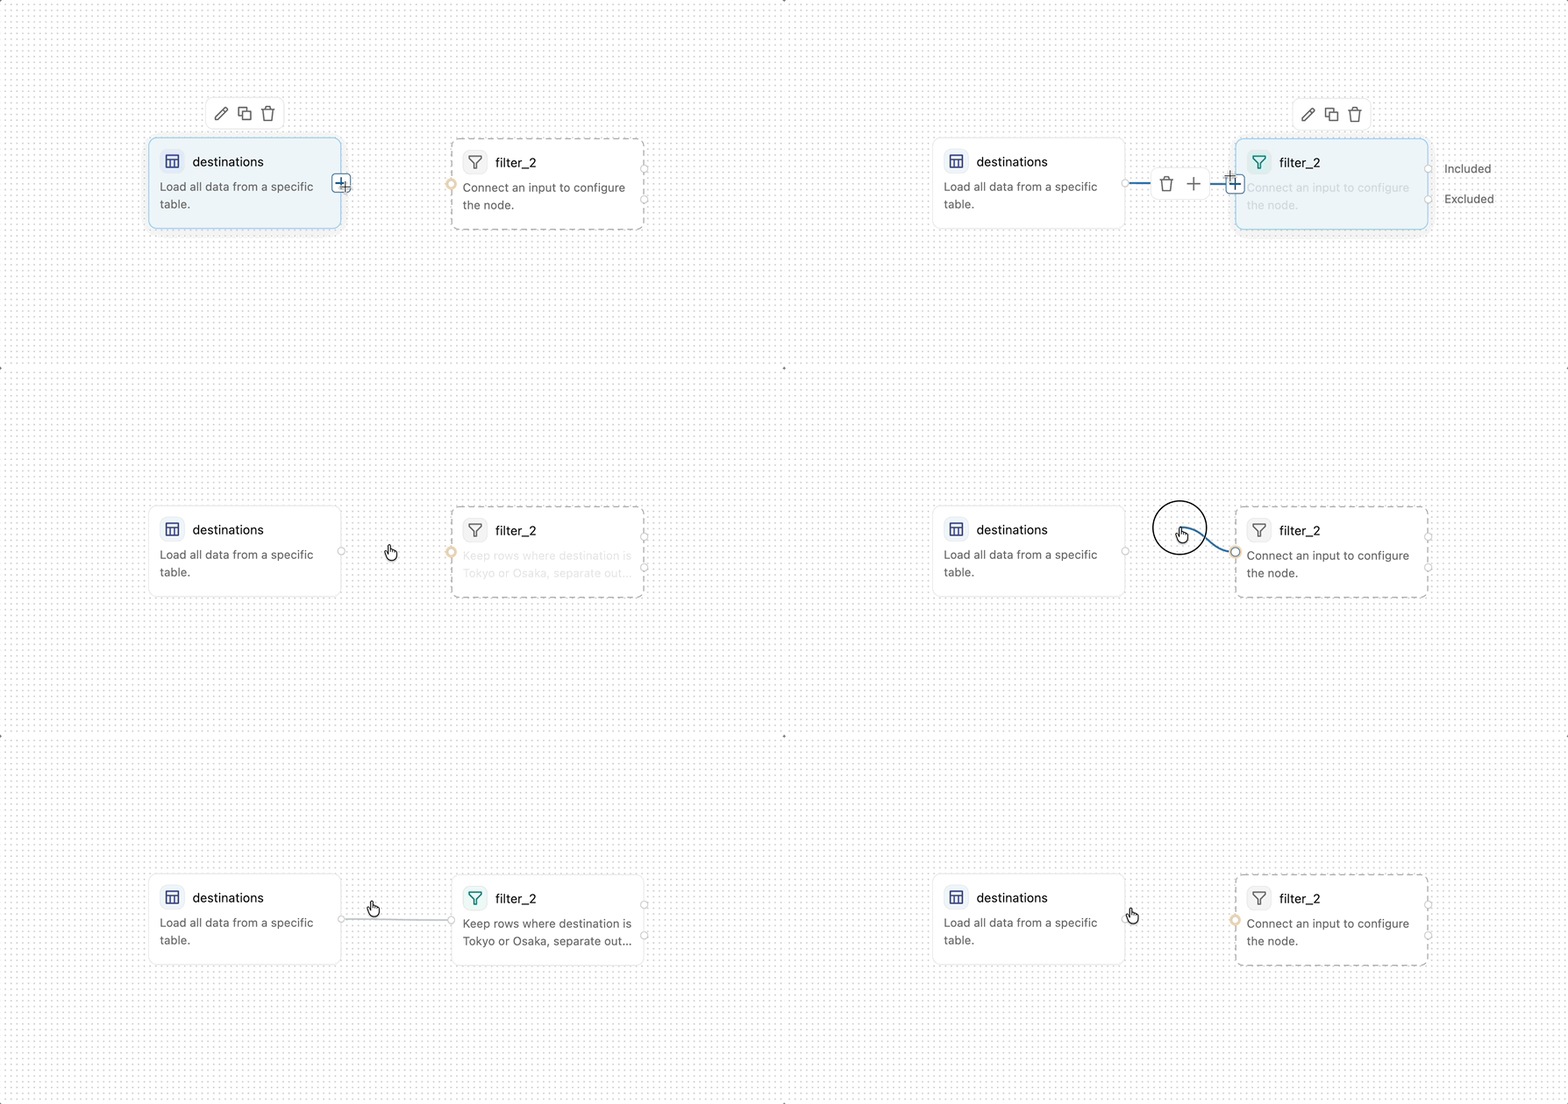
Some operators, such as Join and Combine, accept multiple inputs.
To remove a connection, hover over it and click  in the toolbar that appears over the connection.
Use Genie Code
At any time while editing in Lakeflow Designer, you can create prompts to Genie Code to help. See Genie Code.
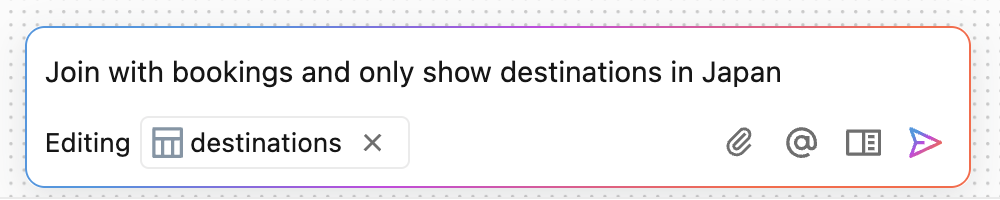
When using Genie Code, the following buttons provide additional functionality:
 : Attaches a file to use as part of the prompt.
 : Use to mention objects, such as tables or files, to use as part of the prompt.
 : Starts a new chat thread with new agent context.
 : Opens the side pane for conversation history, and a more detailed view of what the agent is doing.
Genie Code shows a one-line summary of its most recent edit above the input box.
Preview results
Select any operator to see the results in the output pane at the bottom of the screen. For most operator types, the input data is on the left and output data is on the right. Operators that produce non-table results, such as plots, HTML, or images, render those outputs directly in the output pane.
Use the view control in the output pane to switch between input and output (the default), input only, or output only. In the combined view, drag the divider to resize the input and output panes.
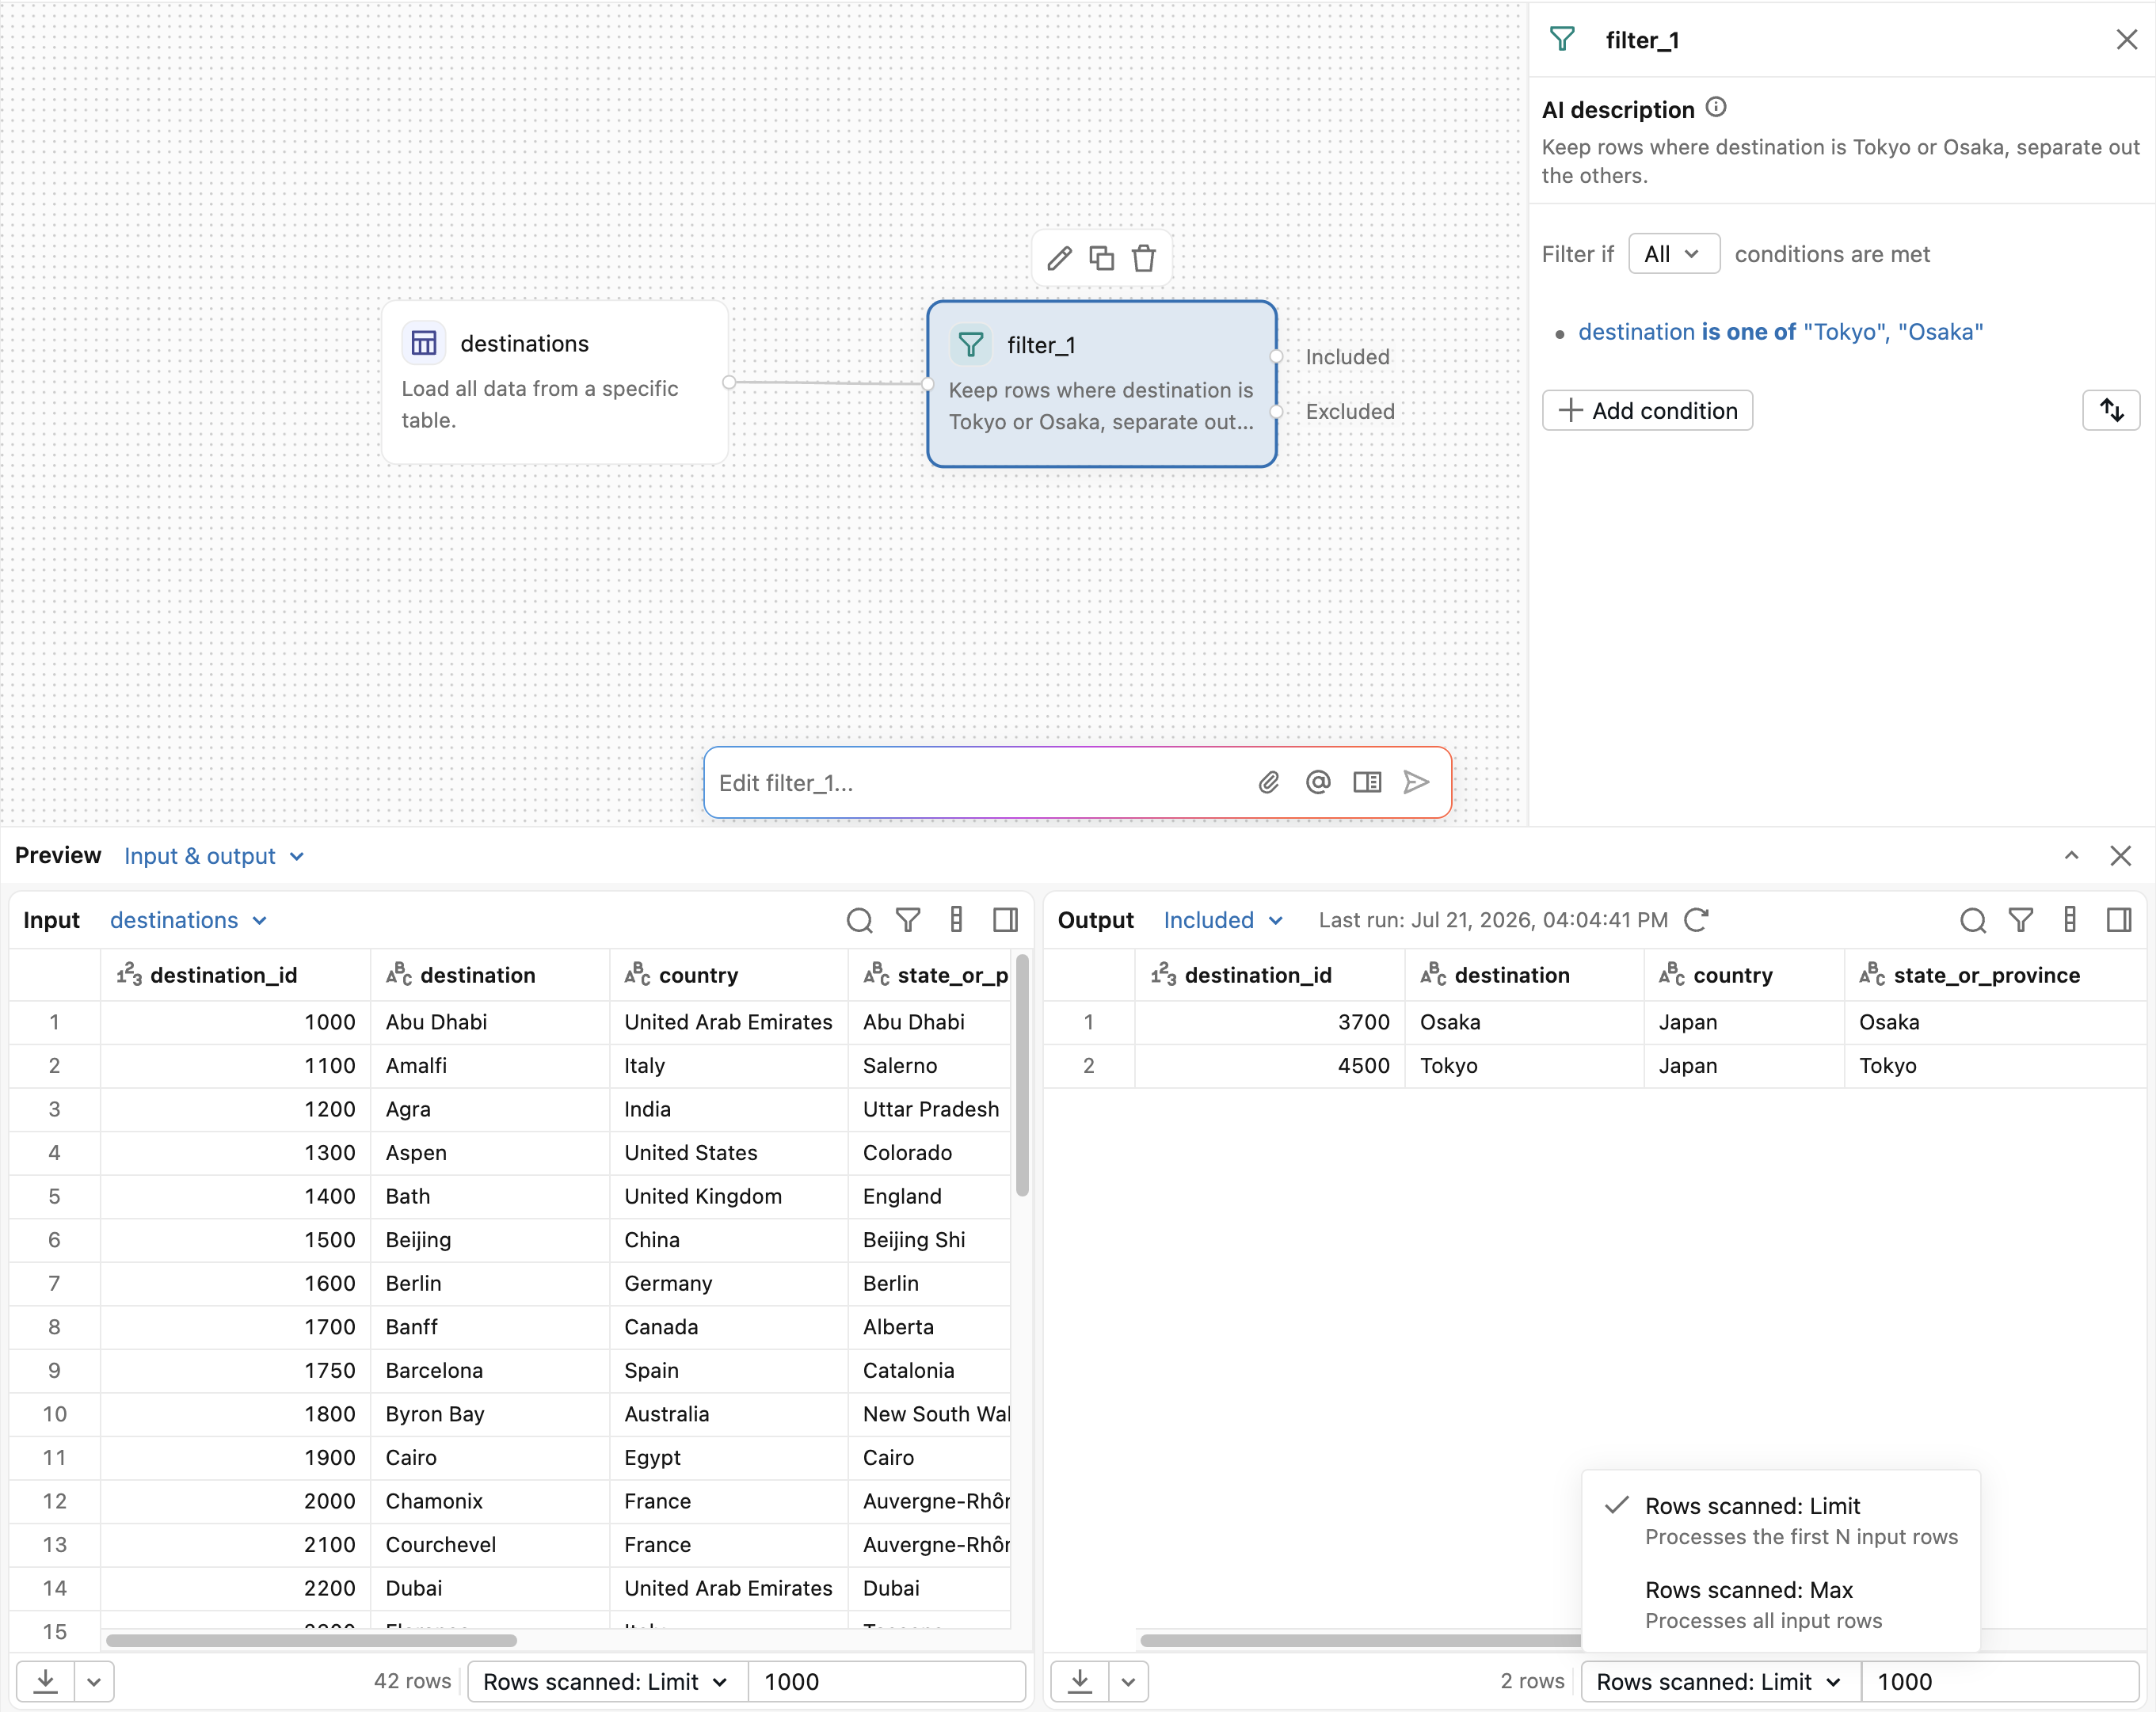
By default, operators process a limited sample of data, for previews. Use the Rows scanned drop-down menu in the output pane to control how many rows to process:
- Rows scanned: Limit: Processes the first N input rows. Specify the number of rows in the field next to the drop-down menu.
- Rows scanned: Max: Processes all input rows.
Warning
Running with Rows scanned: Max reruns all upstream operators with the complete, unbounded dataset and can take a long time.
The Rows scanned setting controls preview processing only. Scheduled runs and job runs always process the complete dataset.
Write results
Add an Output operator to write your results. The Output operator can write to a Unity Catalog table, publish results as a materialized view, or write a CSV, Excel, or JSON file to a Unity Catalog volume.
- Open the operator menu and select Output, or click + next to your last operator and select Output.
- Connect the output handle of your last transformation to the Output operator's input handle if not already connected.
- Double-click the Output operator to open its configuration pane.
- Select an Output type and configure the destination. For a table, enter a Table name, select the Output location (catalog and schema), and select a Write mode.
- Click Run.
For the full set of output types and write modes, see Output.
Schedule or run in production
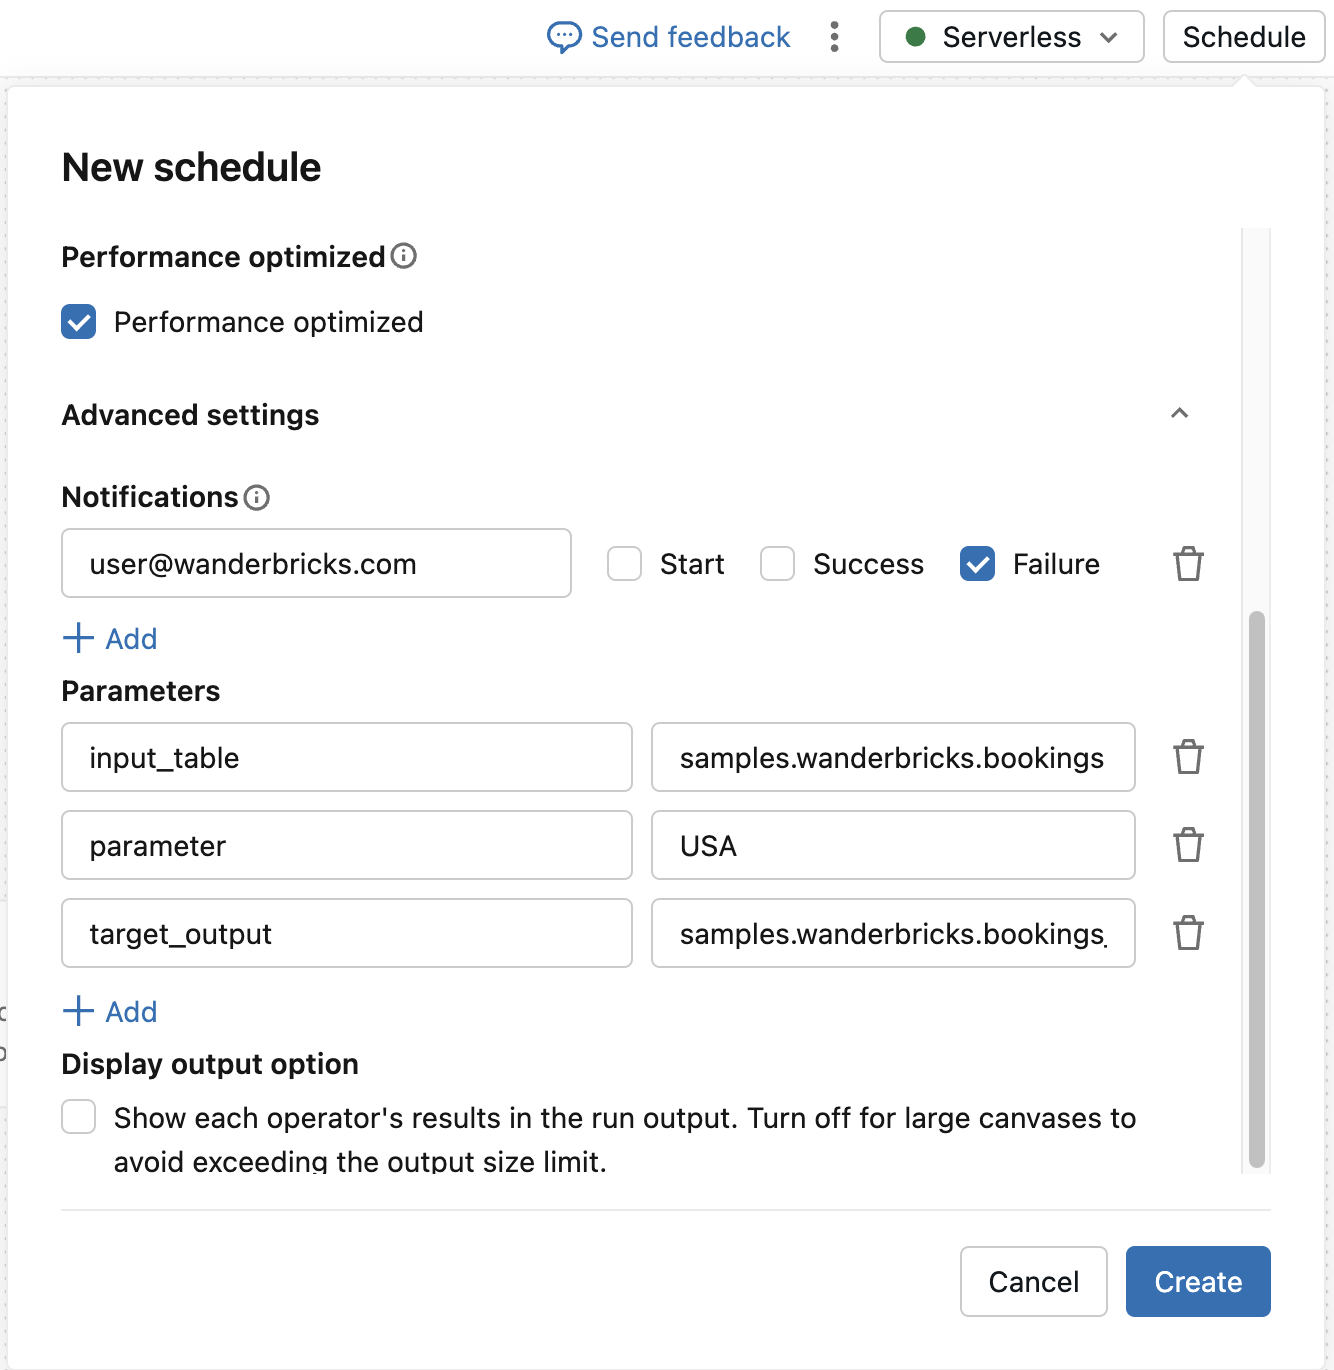
You can automate your workflows by scheduling them as jobs. Click the Schedule button in the top menu to create a scheduled job for your visual data prep, or add the visual data prep to a larger Azure Databricks job as a task.
To move a visual data prep to production, including storing it in Git, deploying it with Declarative Automation Bundles, and parameterizing it across environments, see Move a visual data prep file to production.
Export and import a visual data prep file
Visual data prep files are stored natively in the workspace. You can export them and import them to move them between workspaces or share them.
To export a visual data prep file:
- Click
 in the top-right corner.
 - Select File > Export.
- The file is exported as
<file_name>.designer.ipynb.
To import a visual data prep file:
- In the workspace file system, click .
- Select Import.
- Select the visual data prep file to import.
To version a visual data prep file with Git and take it to production, see Move a visual data prep file to production.
Rename a visual data prep file
To rename a visual data prep file, click the tab showing its name at the top of the editor, then enter a new name.
Delete a visual data prep file
To delete a visual data prep file, open the kebab menu for the file and select Move to trash.
To delete multiple visual data prep files at once, open Workspace from the left navigation, select the files you want to remove, and select Move to trash at the top of the list.
Additional tips when working in the canvas
The following actions are available on the canvas to help you edit your visual data prep.
- Rename an operator: Click the box at the top of any configuration pane to rename the operator. Descriptive names make your visual data prep easier to understand at a glance. Some operators, such as the SQL operator, can reference the output of other operators by name.
- Copy an operator: Hover over an operator and click
 , or select an operator and press Cmd/Ctrl+C then Cmd/Ctrl+V.
 - Delete an operator: Hover over an operator and click in the toolbar that appears above it, or select the operator and press Delete.
- Auto-layout: Click
 in the header toolbar to automatically arrange all operators in a compact layout.
 - Fit view: Click
 in the header toolbar to see all operators in the current viewport.
 - Undo and redo: Press Cmd/Ctrl+Z and Cmd/Ctrl+Shift+Z, or use the undo and redo buttons in the header toolbar.
- Open the command palette: Press Cmd+Shift+P on macOS or Ctrl+Shift+P on Windows to quickly access editor actions.
- View generated code: Open the Table of contents tab in the left menu, select an operator, then expand the Generated code section to see the code Designer generates for it. For more, see The table of contents.
- View version history: Click
 in the right pane to open the visual data prep's version history, which lists its changes. Select a version to compare it with the following version.