Note
Access to this page requires authorization. You can try signing in or changing directories.
Access to this page requires authorization. You can try changing directories.
Deploy AI apps on Databricks so that production traces are captured automatically. Databricks recommends deploying with Custom Agents on Databricks Apps; you can also deploy to Model Serving. Regardless of which deployment method you choose, Azure Databricks logs traces to your MLflow experiment for real-time viewing.
For apps deployed outside Databricks, see Trace agents deployed outside of Databricks.
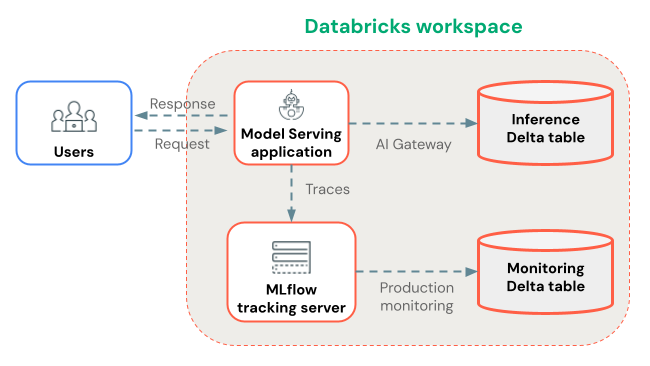
Store traces in Unity Catalog
Every trace is logged to an MLflow experiment, which is always the entry point for viewing traces in the MLflow UI. What differs is the storage location that backs the experiment. You have two choices:
- Unity Catalog storage (recommended for production): Bind the experiment to a Unity Catalog trace location so traces land in Unity Catalog Delta tables. This takes some setup before you deploy. In return, you get long-term retention of large trace volumes with no per-experiment limit. Traces are governed by Unity Catalog catalog, schema, and table permissions, and you can query them directly with SQL through a Databricks SQL warehouse.
- Experiment-based storage (default): If you don't configure a trace location, traces are stored as experiment artifacts. This is convenient for development, but has a per-experiment trace limit and isn't optimized for querying large volumes of production traces.
See Store OpenTelemetry traces in Unity Catalog for the full setup, prerequisites, and permissions.
Deploy with Custom Agents on Databricks Apps (recommended)
Databricks recommends deploying AI apps with Custom Agents on Databricks Apps. MLflow Tracing works automatically, with no additional instrumentation required.
By default, traces are stored as artifacts in the app's MLflow experiment. For production, point the app at an experiment backed by a Unity Catalog trace location, as described in Store traces in Unity Catalog. Set the experiment in one of the following ways:
Declare an experiment resource
- Add the Unity Catalog-backed experiment as an Databricks Apps resource, and set the
MLFLOW_EXPERIMENT_IDenvironment variable to reference it. - Declare the resource in your app configuration, or add it from the App resources UI in the workspace.
- Grant the app's identity
CAN_EDITon the experiment.
Set the experiment in agent code
Call
mlflow.set_experiment()in your agent code:import os import mlflow mlflow.set_experiment(experiment_id=os.environ["MLFLOW_EXPERIMENT_ID"])If you deploy from a Databricks Git folder, point at a non-Git-associated experiment. Real-time tracing does not work otherwise.
For the full authoring and deployment walkthrough, see Author an agent and deploy it on Databricks Apps.
Deploy on Model Serving (alternative)
You can also deploy your agent to a Model Serving endpoint. MLflow Tracing works automatically and traces are stored in the agent's MLflow experiment. Create the experiment with a Unity Catalog trace location before you deploy.
Deploy with Custom Agents on Model Serving using agents.deploy(...). This provisions an agent-optimized endpoint that configures authentication, the review app, and real-time tracing for you, including the ENABLE_MLFLOW_TRACING and MLFLOW_EXPERIMENT_ID environment variables. See Author an agent and deploy it on Model Serving for the full walkthrough.
If you deploy a model to a serving endpoint manually instead of using agents.deploy(...), you must configure additional credentials for the endpoint to write traces to Unity Catalog. See Store OpenTelemetry traces in Unity Catalog for the required setup.
Note
If you are deploying an agent from a notebook stored in a Databricks Git folder, MLflow 3 real-time tracing does not work by default. To enable real-time tracing, set the experiment to a non-Git-associated experiment using mlflow.set_experiment() before running agents.deploy().
Deploy a Custom Agent to Model Serving with MLflow Tracing
Additional resources
- View traces in the Databricks MLflow UI - View traces in the MLflow UI.
- Store OpenTelemetry traces in Unity Catalog - Store production traces in governed Delta tables for long-term retention and analysis.
- Production monitoring - Run scorers on production traces to monitor application quality.
- Add context to traces - Attach metadata for request tracking, user sessions, and environment data.