Note
Access to this page requires authorization. You can try signing in or changing directories.
Access to this page requires authorization. You can try changing directories.
If you're troubleshooting an issue with the Azure portal, and you need to contact Microsoft support, you may want to first capture some additional information. For example, it can be helpful to share a browser trace, a step recording, and console output. This information can provide important details about what exactly is happening in the portal when your issue occurs.
Warning
Browser traces often contain sensitive information and might include authentication tokens linked to your identity. We generally recommend ensuring that sensitive information is not included in any trace files that you share.
In certain cases, such as when investigating issues related to signing in to Azure, Microsoft support may request a trace file that includes this sensitive information. Microsoft support uses these traces for troubleshooting purposes only.
You can capture a browser trace in any supported browser: Microsoft Edge, Google Chrome, Safari (on Mac), or Firefox. Steps for each browser are shown below.
Microsoft Edge
The following steps show how to use the developer tools in Microsoft Edge to capture a browser trace. For more information, see Microsoft Edge DevTools.
Sign in to the Azure portal. It's important to sign in before you start the trace so that the trace doesn't contain sensitive information related to your account.
Start recording the steps you take in the portal, using Steps Recorder.
In the portal, navigate to the step prior to where the issue occurs.
Press F12 to launch Microsoft Edge DevTools. You can also launch the tools from the toolbar menu under More tools > Developer tools.
By default, the browser keeps trace information only for the page that's currently loaded. Set the following options so the browser keeps all trace information, even if your repro steps require going to more than one page.
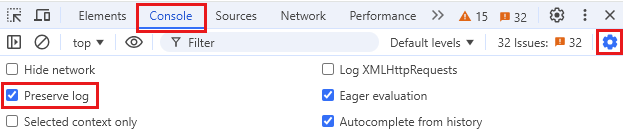
Select the Console tab, select Console settings, then select Preserve Log.
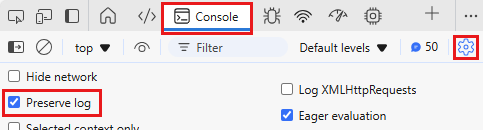
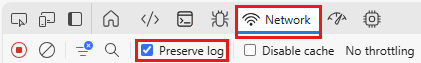
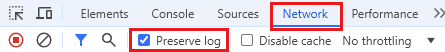
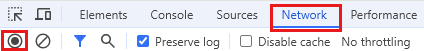
Select the Network tab. If that tab isn't visible, click the More tools (+) button and select Network. Then, from the Network tab, select Preserve log.
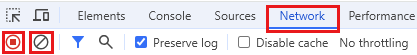
On the Network tab, select Stop recording network log and Clear.
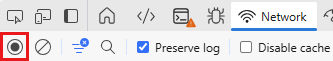
Select Record network log, then reproduce the issue in the portal.
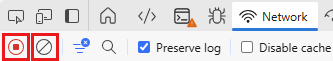
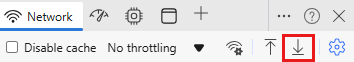
After you have reproduced the unexpected portal behavior, select Stop recording network log again, then select Export HAR (sanitized)... and save the file. If you don't see the Export HAR icon, expand the width of your Edge developer tools window.
Stop the Steps Recorder, and save the recording.
Back in the browser developer tools pane, select the Console tab. Right-click one of the messages, then select Save as..., and save the console output to a text file.
Package the browser trace HAR file, console output, and screen recording files in a compressed format such as .zip.
Share the compressed file with Microsoft support by using the File upload option in your support request.
Google Chrome
The following steps show how to use the developer tools in Google Chrome to capture a browser trace. For more information, see Chrome DevTools.
Sign in to the Azure portal. It's important to sign in before you start the trace so that the trace doesn't contain sensitive information related to your account.
Start recording the steps you take in the portal, using Steps Recorder.
In the portal, navigate to the step prior to where the issue occurs.
Press F12 to launch the developer tools. You can also launch the tools from the toolbar menu under More tools > Developer tools.
By default, the browser keeps trace information only for the page that's currently loaded. Set the following options so the browser keeps all trace information, even if your repro steps require going to more than one page:
Select the Console tab, select Console settings, then select Preserve Log.
Select the Network tab, then select Preserve log.
On the Network tab, select Stop recording network log and Clear.
Select Record network log, then reproduce the issue in the portal.
After you have reproduced the unexpected portal behavior, select Stop recording network log, then select Export HAR (sanitized)... and save the file.

Stop the Steps Recorder, and save the recording.
Back in the browser developer tools pane, select the Console tab. Right-click one of the messages, then select Save as..., and save the console output to a text file.
Package the browser trace HAR file, console output, and screen recording files in a compressed format such as .zip.
Share the compressed file with Microsoft support by using the File upload option in your support request.
Safari
The following steps show how to use the developer tools in Apple Safari on Mac. For more information, see Safari Developer Tools.
Enable the developer tools in Safari:
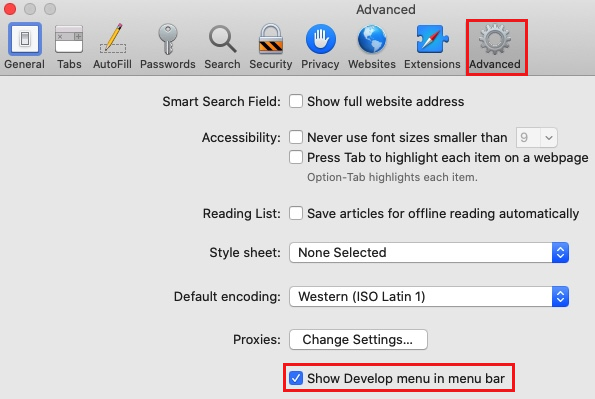
Select Safari, then select Preferences.
Select the Advanced tab, then select Show Develop menu in menu bar.
Sign in to the Azure portal. It's important to sign in before you start the trace so that the trace doesn't contain sensitive information related to your account.
Start recording the steps you take in the portal. For more information, see How to record the screen on your Mac.
In the portal, navigate to the step prior to where the issue occurs.
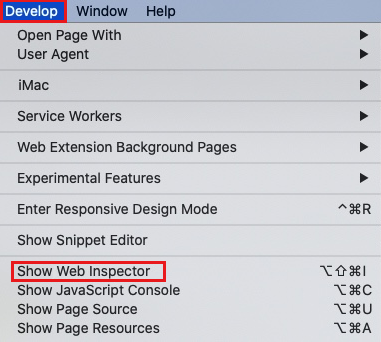
Select Develop, then select Show Web Inspector.
By default, the browser keeps trace information only for the page that's currently loaded. Set the following options so the browser keeps all trace information, even if your repro steps require going to more than one page:
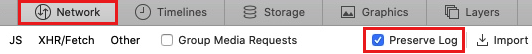
Select the Console tab, then select Preserve Log.

Select the Network tab, then select Preserve Log.
On the Network tab, select Clear Network Items.

Reproduce the issue in the portal.
After you have reproduced the unexpected portal behavior, select Export and save the file.

Stop the screen recorder, and save the recording.
Back in the browser developer tools pane, select the Console tab, and expand the window. Place your cursor at the start of the console output then drag and select the entire contents of the output. Use Command-C to copy the output and save it to a text file.
Package the browser trace HAR file, console output, and screen recording files in a compressed format such as .zip.
Share the compressed file with Microsoft support by using the File upload option in your support request.
Firefox
The following steps show how to use the developer tools in Firefox. For more information, see Firefox DevTools User Docs.
Sign in to the Azure portal. It's important to sign in before you start the trace so that the trace doesn't contain sensitive information related to your account.
Start recording the steps you take in the portal. Use Steps Recorder on Windows, or see How to record the screen on your Mac.
In the portal, navigate to the step prior to where the issue occurs.
Press F12 to launch the developer tools. You can also launch the tools from the toolbar menu under More tools > Web developer tools.
By default, the browser keeps trace information only for the page that's currently loaded. Set the following options so the browser keeps all trace information, even if your repro steps require going to more than one page:
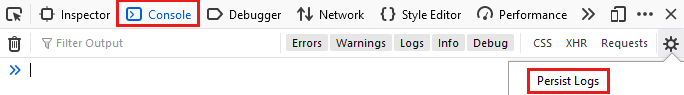
Select the Console tab, select the Settings icon, and then select Persist Logs.
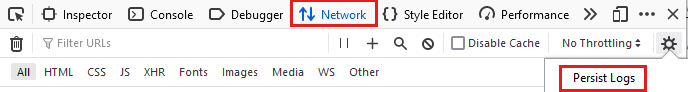
Select the Network tab, select the Settings icon, and then select Persist Logs.
On the Network tab, select Clear.

Reproduce the issue in the portal.
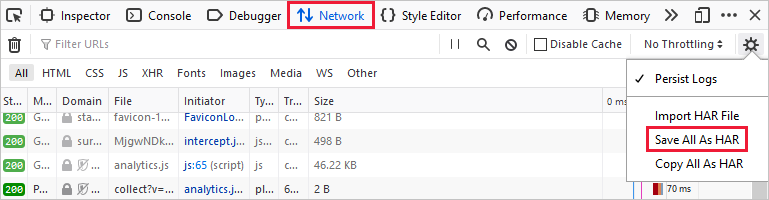
After you have reproduced the unexpected portal behavior, select Save All As HAR.
Stop the Steps Recorder on Windows or the screen recording on Mac, and save the recording.
Back in the browser developer tools pane, select the Console tab. Right-click one of the messages, then select Save All Messages to File, and save the console output to a text file.
Package the browser trace HAR file, console output, and screen recording files in a compressed format such as .zip.
Share the compressed file with Microsoft support by using the File upload option in your support request.
Next steps
- Read more about the Azure portal.
- Learn how to open a support request in the Azure portal.
- Learn more about file upload requirements for support requests.