Note
Access to this page requires authorization. You can try signing in or changing directories.
Access to this page requires authorization. You can try changing directories.
APPLIES TO:
NoSQL
MongoDB
Cassandra
Gremlin
Table
Azure Cosmos DB provides insights for throughput, storage, consistency, availability, and latency. The Azure portal provides an aggregated view of these metrics. You can also view Azure Cosmos DB metrics from Azure Monitor API. The dimension values for the metrics such as container name are case-insensitive. Therefore, you need to use case-insensitive comparison when doing string comparisons on these dimension values. To learn how to view metrics from Azure monitor, see Monitor Azure Cosmos DB.
This article walks through common use cases and how Azure Cosmos DB insights can be used to analyze and debug these issues. By default, the metric insights are collected every five minutes and are kept for seven days.
The following sections explain common scenarios where you can use Azure Cosmos DB metrics.
Note
When filtering by database or collections in metrics, it is possible that you may see "__Empty" or "<Empty>" as the resourceName. This is because metric data is being collected at an account-level for that particular request. Therefore, there is no associated database or collection as the metric value.
Understand how many requests are succeeding or causing errors
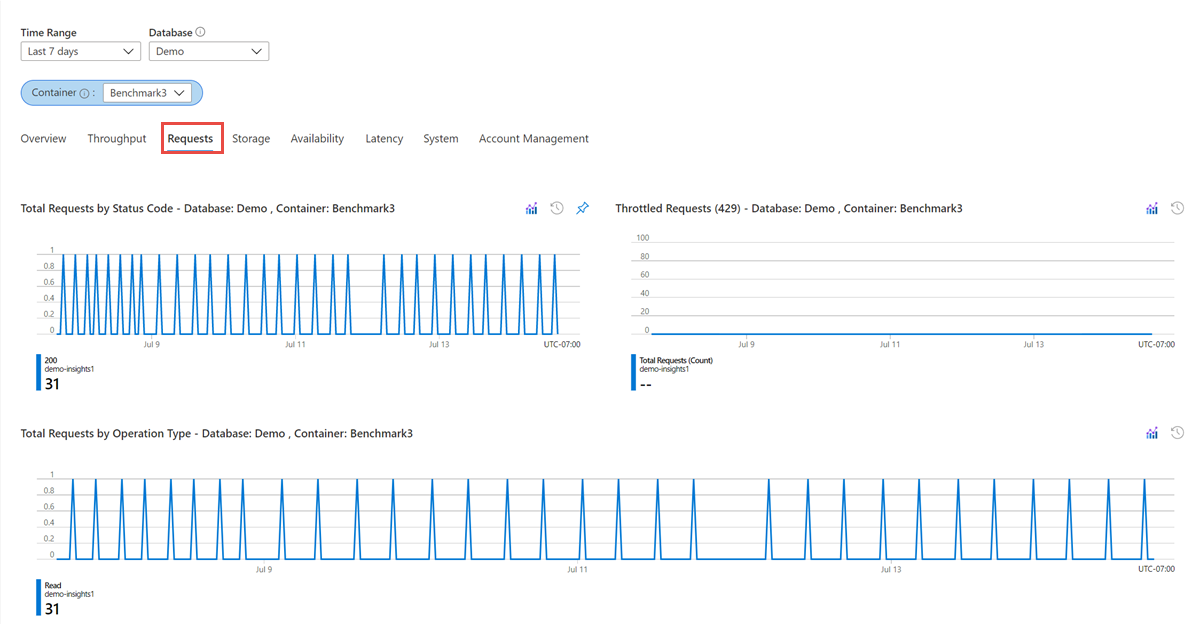
To get started, head to the Azure portal and navigate to the Insights pane. From this pane, open the Requests tab. The Requests tab shows a chart with the total requests segmented by the status code and operation type. For more information about HTTP status codes, see HTTP status codes for Azure Cosmos DB.
The most common error status code is 429 (rate limiting/throttling). This error means that requests to Azure Cosmos DB are more than the provisioned throughput. The most common solution to this problem is to scale up the RUs for the given collection. For more information, see Introduction to provisioned throughput in Azure Cosmos DB
Determine the throughput consumption by a partition key range
Having a good cardinality of your partition keys is essential for any scalable application. To determine the throughput distribution of any partitioned container broken down by partition key range IDs, navigate to the Insights pane. Open the Throughput tab. The normalized RU/s consumption across different partition key ranges is shown in the chart.
With the help of this chart, you can identify if there's a hot partition. The PartitionKeyRangeIDs corresponds to physical partitions. The Normalized RU Consumption metric is a value between 0% and 100% that helps measure the utilization of provisioned throughput on a database or container. An uneven throughput distribution might cause hot partitions, which can result in throttled requests and might require repartitioning. After identifying which partition key is causing the skew in distribution, you might have to repartition your container with a more distributed partition key. For more information about partitioning in Azure Cosmos DB, see Partitioning and horizontal scaling in Azure Cosmos DB.
Determine the data and index usage
It's important to determine the storage distribution of any partitioned container by data usage, index usage, and document usage. You can minimize the index usage, maximize the data usage, and optimize your queries. To get this data, navigate to the Insights pane and open the Storage tab.
Compare data size against index size
In Azure Cosmos DB, the total consumed storage is the combination of both the data size and index size. Typically, the index size is a fraction of the data size. To learn more, see the Index size article. In the Metrics pane in the Azure portal, the Storage tab showcases the breakdown of storage consumption based on data and index.
// Measure the document size usage (which includes the index size)
ResourceResponse<DocumentCollection> collectionInfo = await client.ReadDocumentCollectionAsync(UriFactory.CreateDocumentCollectionUri("db", "coll"));
 Console.WriteLine("Document size quota: {0}, usage: {1}", collectionInfo.DocumentQuota, collectionInfo.DocumentUsage);
If you would like to conserve index space, you can adjust the indexing policy.
Debug slow queries
In the API for NoSQL SDKs, Azure Cosmos DB provides query execution statistics.
IDocumentQuery<dynamic> query = client.CreateDocumentQuery(
 UriFactory.CreateDocumentCollectionUri(DatabaseName, CollectionName),
 "SELECT * FROM c WHERE c.city = 'Seattle'",
 new FeedOptions
 {
 PopulateQueryMetrics = true,
 MaxItemCount = -1,
 MaxDegreeOfParallelism = -1,
 EnableCrossPartitionQuery = true
 }).AsDocumentQuery();
FeedResponse<dynamic> result = await query.ExecuteNextAsync();

// Returns metrics by partition key range Id
IReadOnlyDictionary<string, QueryMetrics> metrics = result.QueryMetrics;
QueryMetrics provides details on how long each component of the query took to execute. The most common root cause for long running queries is scans, meaning the query was unable to apply the indexes. This problem can be resolved with a better filter condition.
Monitor control plane requests
Azure Cosmos DB applies limits on the number of metadata requests that can be made over consecutive 5 minute intervals. Control plane requests which go over these limits may experience throttling. Metadata requests may in some cases, consume throughput against a master partition within an account that contains all of an account's metadata. Control plane requests which go over the throughput amount will experience rate limiting (429s).
To get started, head to the Azure portal and navigate to the Insights pane. From this pane, open the System tab. The System tab shows two charts. One that shows all metadata requests for an account. The second shows metadata requests throughput consumption from the account's master partition that stores an account's metadata.
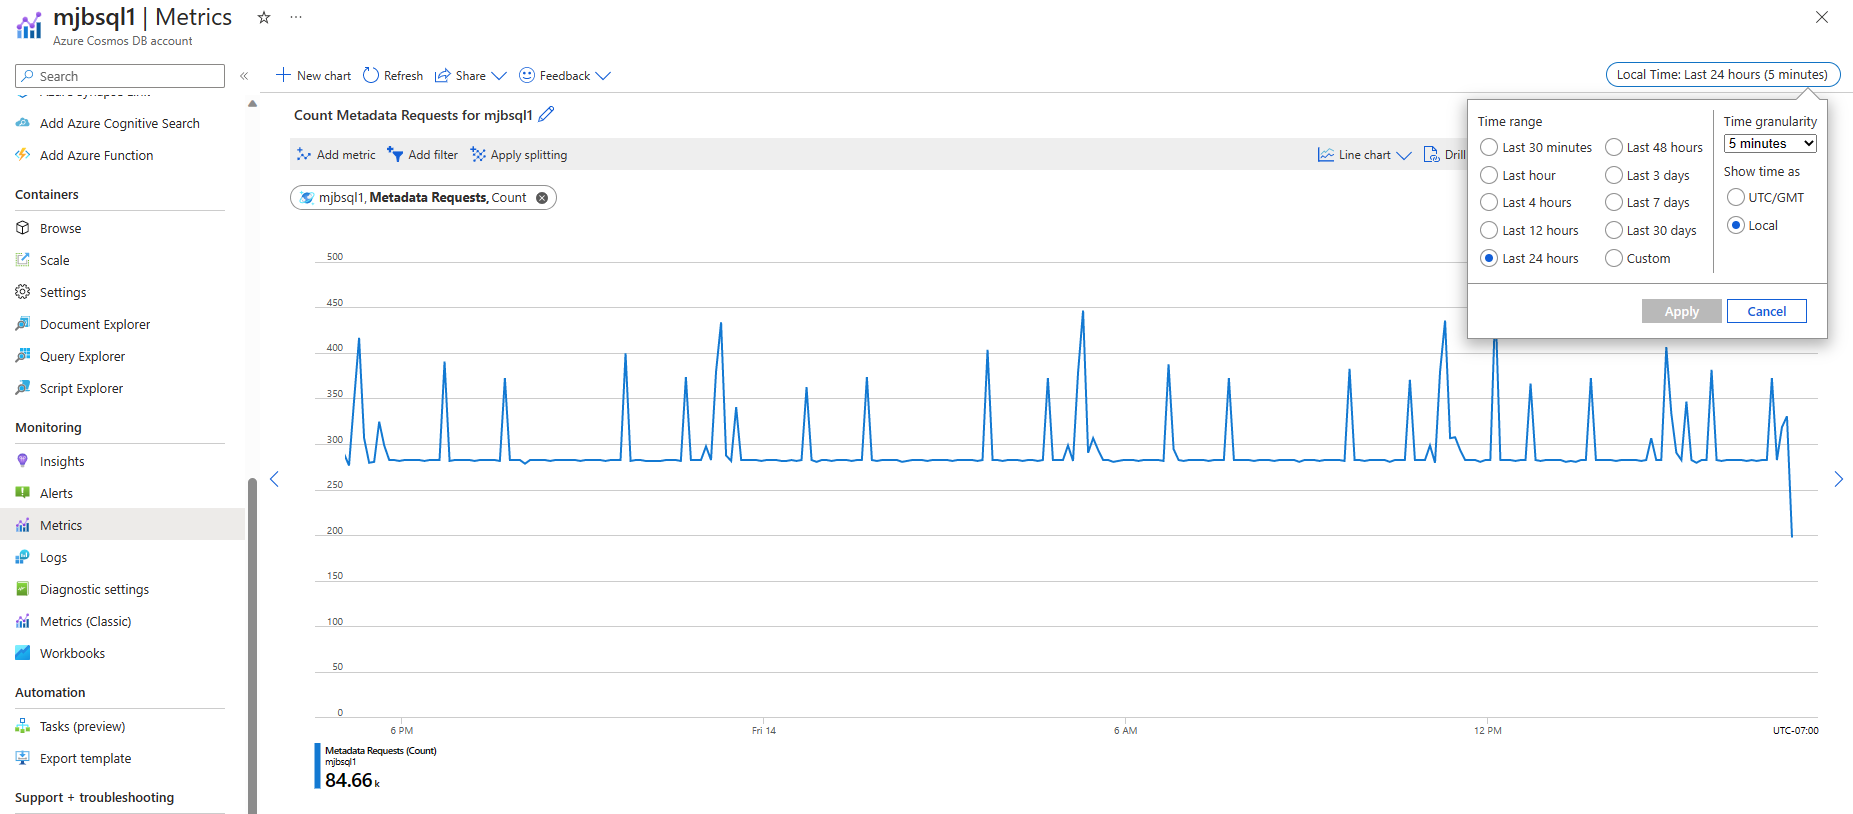
The Metadata Request by Status Code graph above aggregates requests at increasing larger granularity as you increase the Time Range. The largest Time Range you can use for a 5 minute time bin is 4 hours. To monitor metadata requests over a greater time range with specific granularity, use Azure Metrics. Create a new chart and select Metadata requests metric. In the upper right corner select 5 minutes for Time granularity as seen below. Metrics also allow for users to Create Alerts on them which makes them more useful than Insights.
Next steps
You might want to learn more about improving database performance by reading the following articles:


