Note
Access to this page requires authorization. You can try signing in or changing directories.
Access to this page requires authorization. You can try changing directories.
Important
This feature is in Beta. Account admins can control access to this feature from the account console Previews page. See Manage Azure Databricks previews.
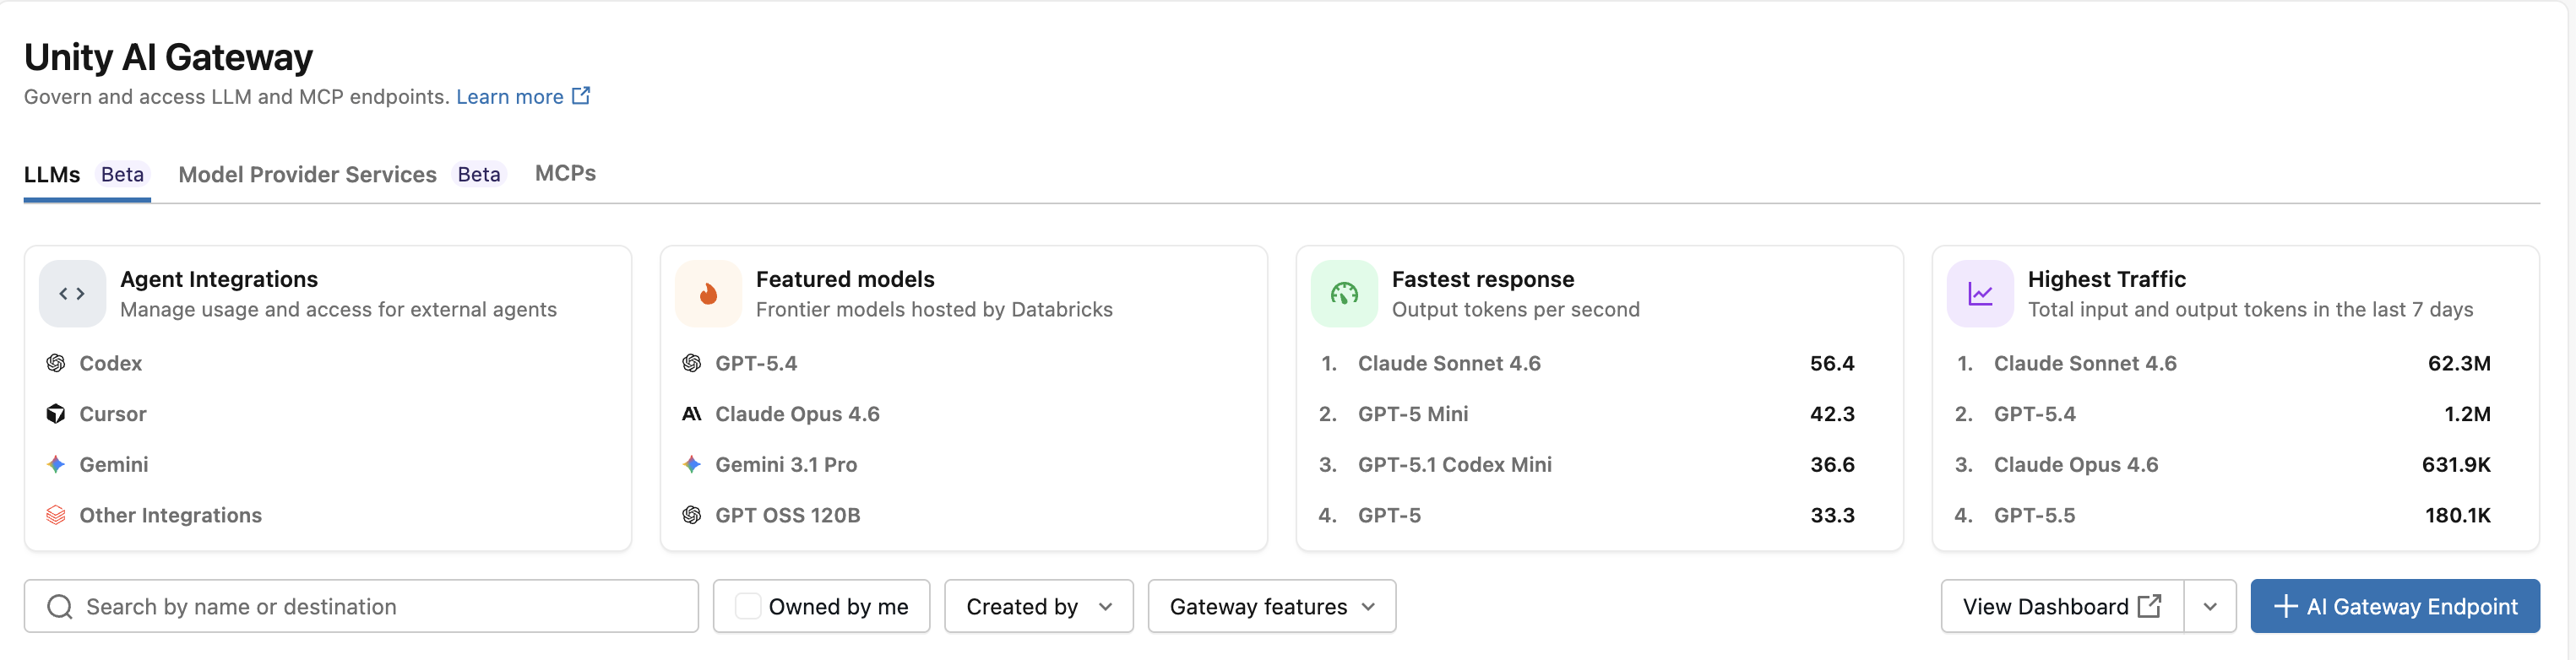
With the Azure Databricks coding agent integration, you can manage access and usage for coding agents like Cursor, Gemini CLI, and Codex CLI. Built on Unity AI Gateway, it provides rate limiting, usage tracking, and inference tables for your coding tools.
Features
- Access: Direct access to various coding tools and models, all under one invoice.
- Observability: A single unified dashboard to track usage, spend, and metrics across all your coding tools.
- Unified governance: Admins can manage model permissions and rate limits directly through Unity AI Gateway.
Requirements
- Unity AI Gateway preview enabled for your account. See Manage Azure Databricks previews.
- A Azure Databricks workspace in a Unity AI Gateway supported region.
- Unity Catalog enabled for your workspace. See Enable a workspace for Unity Catalog.
Setup
The fastest way to get started is with ucode, a CLI from Azure Databricks that installs, authenticates, and configures supported coding agents with Unity AI Gateway in one command.
Use ucode (recommended)
ucode (Unity AI Gateway Coding CLI) is the single entry point for running coding agents against Unity AI Gateway. It handles OAuth, writes each agent's config file, and routes traffic through any LLM or MCP server you've registered. Supported agents:
- Codex CLI
- Gemini CLI
- OpenCode
- GitHub Copilot CLI
- Pi
- and more
Step 1: Install ucode
uv tool install git+https://github.com/databricks/ucode
Requires Python 3.12 or later and uv.
Step 2: Open a coding agent
Run the agent you want. On first launch, ucode prompts for your Azure Databricks workspace URL, authenticates, and writes the agent's config file automatically. Subsequent launches go straight to the agent.
ucode codex      # OpenAI Codex
ucode gemini     # Gemini CLI
ucode opencode   # OpenCode
ucode copilot    # GitHub Copilot CLI
ucode pi         # Pi
ucode passes flags after the agent name through to the underlying tool, for example:
ucode codex --full-auto
To configure multiple coding agents at the same time, run:
ucode configure
To register Azure Databricks MCP servers (Unity Catalog functions, Vector Search, SQL warehouses, and discovered external connections) with MCP-capable agents:
ucode configure mcp
To see your Unity AI Gateway usage summary for the last 7 days:
ucode usage
For the full command reference, run:
ucode --help
Dashboard
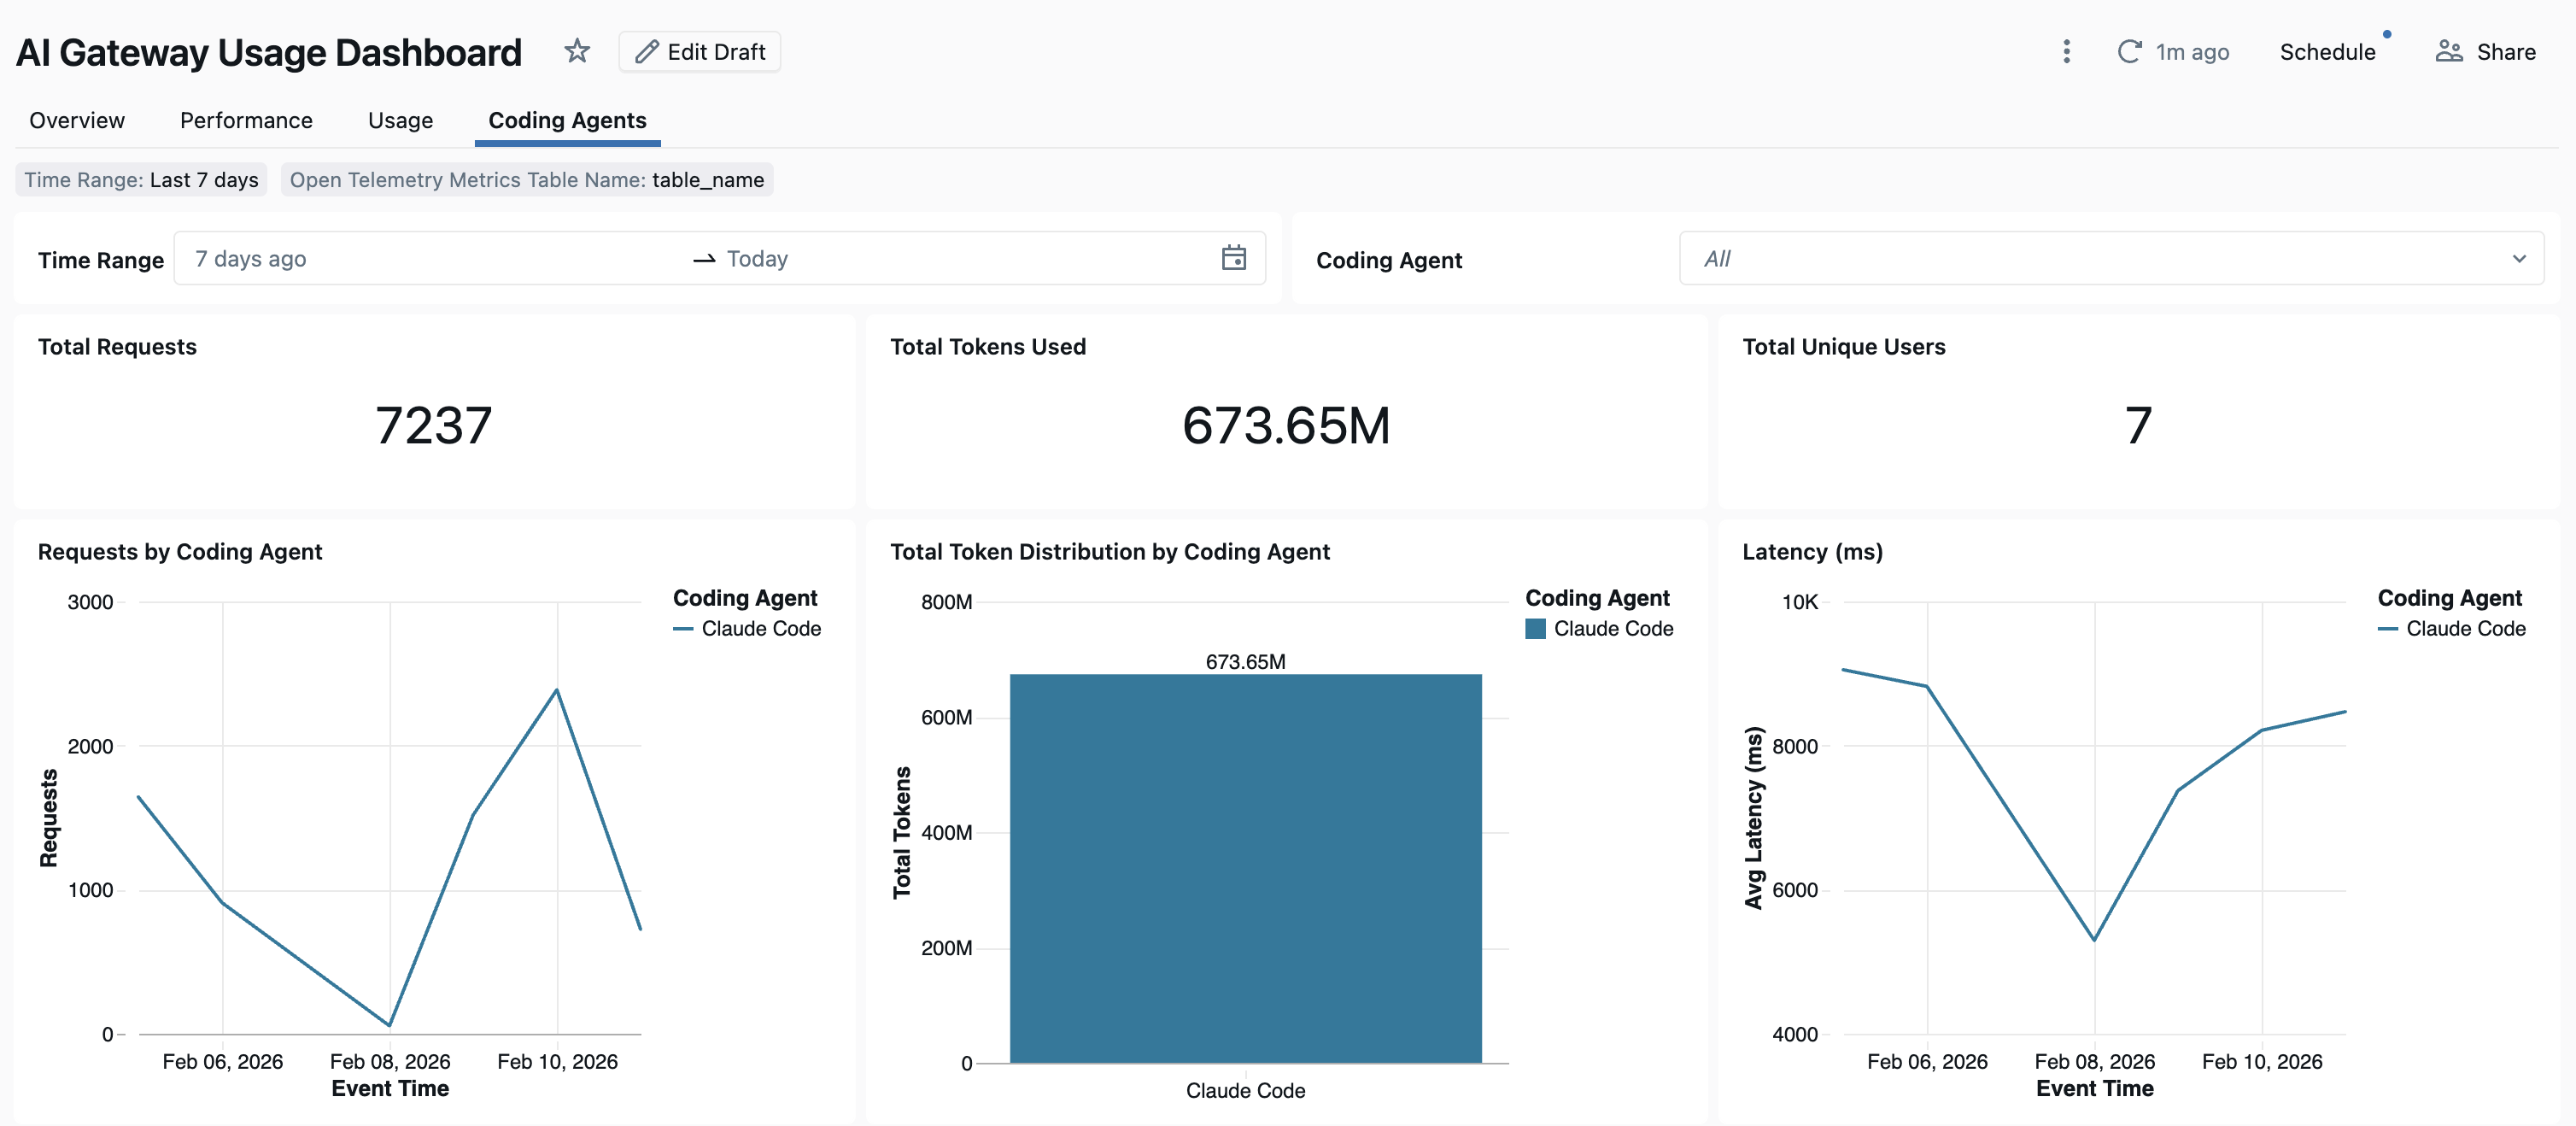
After coding agent usage is tracked through Unity AI Gateway, you can view and monitor your metrics in the built-in dashboard.
To open the dashboard, select View dashboard from the AI Gateway page. This action creates a pre-configured dashboard with graphs for coding tool usage.
Manual setup
If you prefer to configure agents yourself, follow the instructions for:
Cursor IDE
To configure Cursor to use Unity AI Gateway endpoints:
Step 1: Configure base URL and API key
Open Cursor and navigate to Settings > Cursor Settings > Models > API Keys.
Enable Override OpenAI Base URL and enter the URL:
https://<workspace-url>/ai-gateway/cursor/v1Replace
<workspace-url>with your Azure Databricks workspace URL.Paste your Azure Databricks personal access token into the OpenAI API Key field.
Step 2: Add custom models
- Click + Add Custom Model in Cursor Settings.
- Add your Unity AI Gateway endpoint name and enable the toggle.
Note
Currently, only Azure Databricks-created foundation model endpoints are supported.
Step 3: Test the integration
- Open Ask mode with
Cmd+L(macOS) orCtrl+L(Windows/Linux) and select your model. - Send a message. All requests now route through Azure Databricks.
Codex CLI
Step 1: Install or update Codex CLI
Install or update to Codex CLI version 0.118 or later:
npm install -g @openai/codex@latest
Step 2: Create or update the Codex config file
Create or edit the Codex configuration file at ~/.codex/config.toml:
profile = "default"

[profiles.default]
model_provider = "Databricks"

[model_providers.Databricks]
name = "Databricks :re[ai-gateway]"
base_url = "<workspace-url>/ai-gateway/codex/v1"
wire_api = "responses"

[model_providers.Databricks.auth]
command = "sh"
args = ["-c", "databricks auth token --host <workspace-url> --output json | jq -r '.access_token'"]
timeout_ms = 5000
refresh_interval_ms = 1800000
Replace <workspace-url> with your Azure Databricks workspace URL.
Step 3: Authenticate to your workspace
Note
This only needs to be done once. You do not need to re-authenticate every time you start Codex.
First, make sure you have the Azure Databricks CLI installed. See Install or update the Databricks CLI for instructions.
Then authenticate:
databricks auth login --host <workspace-url>
Replace <workspace-url> with your Azure Databricks workspace URL.
Step 4: Start Codex
codex
To change the model, use /model.
Gemini CLI
Step 1: Install the latest version of Gemini CLI
npm install -g @google/gemini-cli@nightly
Step 2: Configure environment variables
Create a file ~/.gemini/.env and add the following configuration. See the Gemini CLI authentication docs for more details.
GEMINI_MODEL=databricks-gemini-2-5-flash
GOOGLE_GEMINI_BASE_URL=https://<workspace-url>/ai-gateway/gemini
GEMINI_API_KEY_AUTH_MECHANISM="bearer"
GEMINI_API_KEY=<databricks_pat_token>
Replace <workspace-url> with your Azure Databricks workspace URL and <databricks_pat_token> with your personal access token.
Set up OpenTelemetry data collection
Azure Databricks supports exporting OpenTelemetry metrics and logs from coding agents to Unity Catalog managed Delta tables. All metrics are time series data exported using the OpenTelemetry standard metrics protocol, and logs are exported using the OpenTelemetry logs protocol.
Requirements
- OpenTelemetry on Azure Databricks preview enabled. See Manage Azure Databricks previews.
Step 1: Create OpenTelemetry tables in Unity Catalog
Create Unity Catalog managed tables preconfigured with the OpenTelemetry metrics and logs schemas.
Metrics table
CREATE TABLE <catalog>.<schema>.<table_prefix>_otel_metrics (
  name STRING,
  description STRING,
  unit STRING,
  metric_type STRING,
  gauge STRUCT<
    start_time_unix_nano: LONG,
    time_unix_nano: LONG,
    value: DOUBLE,
    exemplars: ARRAY<STRUCT<
      time_unix_nano: LONG,
      value: DOUBLE,
      span_id: STRING,
      trace_id: STRING,
      filtered_attributes: MAP<STRING, STRING>
    >>,
    attributes: MAP<STRING, STRING>,
    flags: INT
  >,
  sum STRUCT<
    start_time_unix_nano: LONG,
    time_unix_nano: LONG,
    value: DOUBLE,
    exemplars: ARRAY<STRUCT<
      time_unix_nano: LONG,
      value: DOUBLE,
      span_id: STRING,
      trace_id: STRING,
      filtered_attributes: MAP<STRING, STRING>
    >>,
    attributes: MAP<STRING, STRING>,
    flags: INT,
    aggregation_temporality: STRING,
    is_monotonic: BOOLEAN
  >,
  histogram STRUCT<
    start_time_unix_nano: LONG,
    time_unix_nano: LONG,
    count: LONG,
    sum: DOUBLE,
    bucket_counts: ARRAY<LONG>,
    explicit_bounds: ARRAY<DOUBLE>,
    exemplars: ARRAY<STRUCT<
      time_unix_nano: LONG,
      value: DOUBLE,
      span_id: STRING,
      trace_id: STRING,
      filtered_attributes: MAP<STRING, STRING>
    >>,
    attributes: MAP<STRING, STRING>,
    flags: INT,
    min: DOUBLE,
    max: DOUBLE,
    aggregation_temporality: STRING
  >,
  exponential_histogram STRUCT<
    attributes: MAP<STRING, STRING>,
    start_time_unix_nano: LONG,
    time_unix_nano: LONG,
    count: LONG,
    sum: DOUBLE,
    scale: INT,
    zero_count: LONG,
    positive_bucket: STRUCT<
      offset: INT,
      bucket_counts: ARRAY<LONG>
    >,
    negative_bucket: STRUCT<
      offset: INT,
      bucket_counts: ARRAY<LONG>
    >,
    flags: INT,
    exemplars: ARRAY<STRUCT<
      time_unix_nano: LONG,
      value: DOUBLE,
      span_id: STRING,
      trace_id: STRING,
      filtered_attributes: MAP<STRING, STRING>
    >>,
    min: DOUBLE,
    max: DOUBLE,
    zero_threshold: DOUBLE,
    aggregation_temporality: STRING
  >,
  summary STRUCT<
    start_time_unix_nano: LONG,
    time_unix_nano: LONG,
    count: LONG,
    sum: DOUBLE,
    quantile_values: ARRAY<STRUCT<
      quantile: DOUBLE,
      value: DOUBLE
    >>,
    attributes: MAP<STRING, STRING>,
    flags: INT
  >,
  metadata MAP<STRING, STRING>,
  resource STRUCT<
    attributes: MAP<STRING, STRING>,
    dropped_attributes_count: INT
  >,
  resource_schema_url STRING,
  instrumentation_scope STRUCT<
    name: STRING,
    version: STRING,
    attributes: MAP<STRING, STRING>,
    dropped_attributes_count: INT
  >,
  metric_schema_url STRING
) USING DELTA
TBLPROPERTIES (
  'otel.schemaVersion' = 'v1'
)
Logs table
CREATE TABLE <catalog>.<schema>.<table_prefix>_otel_logs (
  event_name STRING,
  trace_id STRING,
  span_id STRING,
  time_unix_nano LONG,
  observed_time_unix_nano LONG,
  severity_number STRING,
  severity_text STRING,
  body STRING,
  attributes MAP<STRING, STRING>,
  dropped_attributes_count INT,
  flags INT,
  resource STRUCT<
    attributes: MAP<STRING, STRING>,
    dropped_attributes_count: INT
  >,
  resource_schema_url STRING,
  instrumentation_scope STRUCT<
    name: STRING,
    version: STRING,
    attributes: MAP<STRING, STRING>,
    dropped_attributes_count: INT
  >,
  log_schema_url STRING
) USING DELTA
TBLPROPERTIES (
  'otel.schemaVersion' = 'v1'
)
Step 2: Update env vars in your coding agent
In any coding agent with OpenTelemetry metric support enabled, configure the following environment variables.
{
  "OTEL_METRICS_EXPORTER": "otlp",
  "OTEL_EXPORTER_OTLP_METRICS_PROTOCOL": "http/protobuf",
  "OTEL_EXPORTER_OTLP_METRICS_ENDPOINT": "https://<workspace-url>/api/2.0/otel/v1/metrics",
  "OTEL_EXPORTER_OTLP_METRICS_HEADERS": "content-type=application/x-protobuf,Authorization=Bearer <databricks_pat_token>,X-Databricks-UC-Table-Name=<catalog>.<schema>.<table_prefix>_otel_metrics",
  "OTEL_METRIC_EXPORT_INTERVAL": "10000",
  "OTEL_LOGS_EXPORTER": "otlp",
  "OTEL_EXPORTER_OTLP_LOGS_PROTOCOL": "http/protobuf",
  "OTEL_EXPORTER_OTLP_LOGS_ENDPOINT": "https://<workspace-url>/api/2.0/otel/v1/logs",
  "OTEL_EXPORTER_OTLP_LOGS_HEADERS": "content-type=application/x-protobuf,Authorization=Bearer <databricks_pat_token>,X-Databricks-UC-Table-Name=<catalog>.<schema>.<table_prefix>_otel_logs",
  "OTEL_LOGS_EXPORT_INTERVAL": "5000"
}
Step 3: Run your coding agent.
Your data should propagate to the Unity Catalog tables within 5 minutes.