Configure the Test Results Trend (Advanced) widget
Azure DevOps Services | Azure DevOps Server 2022 - Azure DevOps Server 2019
Teams track their test collateral health to ensure effective continuous testing in a pipeline. For example, teams might track:
- Test pass percentage
- Test failures
- Test duration
With the Test Results Trend widget, you can monitor test trends over a period of time, detect patterns around test failures, test duration, and more, and generate actionable insights.
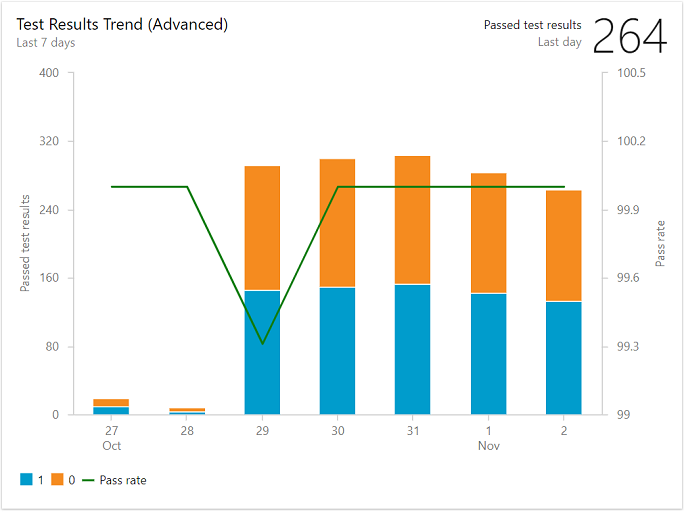
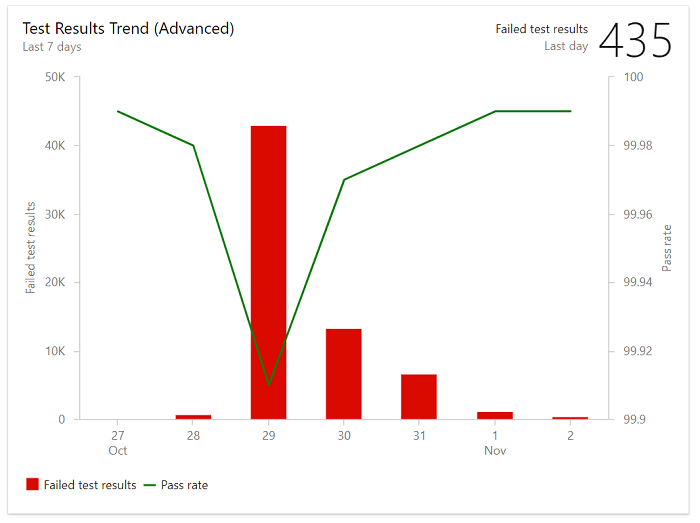
Example Test Results Trend widget showing pass percentage and test failure for last 7 days
In this article you'll learn:
- The type of insights you can get by monitoring Test Results Trend charts
- Prerequisites for gaining actionable insights from the Test Results Trend charts
- How to install and configure the Test Results Trend widget
Note
The Test Results Trend (Advanced) widget is based on Analytics and supported for Azure DevOps Server 2020 and later versions. For earlier versions, you can use the Test Results Trend widget.
Insights supported with Test Results Trend charts
With the Test Results Trend charts, you can gain the following insights:
- Identify if test health is improving over time by monitoring trends of failures and average pass rate on each day
- Identify long running tests that are impacting a pipeline's efficiency by monitoring the average test duration on each day
- Identify patterns in test outcomes. Has the test recently started to fail? Or, has the test always failed for the selected period? Or, is the test showing non-deterministic behavior?
- Obtain insights into specific areas of interest to you based on test file, branch, or stage you own by configuring specific filters.
- Obtain insights into a specific area you test by configuring the widget to focus on a test file, branch, or stage.
Test Results Trend charts require that you set up continuous testing in your build pipeline. To get deeper insights and data you can view the Test Failure report in the pipeline. For more information, see details Analyze test results.
Prerequisites
To configure the Test Results Trend widget:
- You must be a member of a project. If you haven't been added as a project member, get added now.
- Set up continuous testing for your build pipeline. For details, see Run unit tests with your builds.
- To add a widget to a team dashboard, you need to be a member of the team. You must have Basic access or greater, have dashboard permissions, or be a team admin or project admin. Default settings provide all team members with permissions.
- Enable Pipelines. If disabled, none of the Analytics widgets for pipelines will display. To re-enable it, see Turn an Azure DevOps service on or off.
- Enable Test Plans. If disabled, the Test Results Trend widget displays an "Access not supported" error message. To enable test plans, see Turn an Azure DevOps service on or off.
- You must be a member of a project. If you haven't been added as a project member, get added now.
- Set up continuous testing for your build pipeline. For details, see Run unit tests with your builds.
- Have installed the Analytics Marketplace extension. You must be a member of the Project Collection Administrators group to add extensions.
- To add a widget to a team dashboard, you need to be a member of the team. You must have Basic access or greater, have dashboard permissions, or be a team admin or project admin.
- Enable Pipelines. If disabled, none of the Analytics widgets for pipelines will display. To re-enable it, see Turn an Azure DevOps service on or off.
Configure the Test Results Trend (Advanced) widget
You can configure your Test Results Trend (Advanced) widget to show results for either build or release pipelines.
From your team's dashboard, select the
 actions icon for the Test Results Trend (Advanced) widget you want to configure and select Configure.
Modify the Title and select either Build or Release for the type of Pipelines that you'll select.
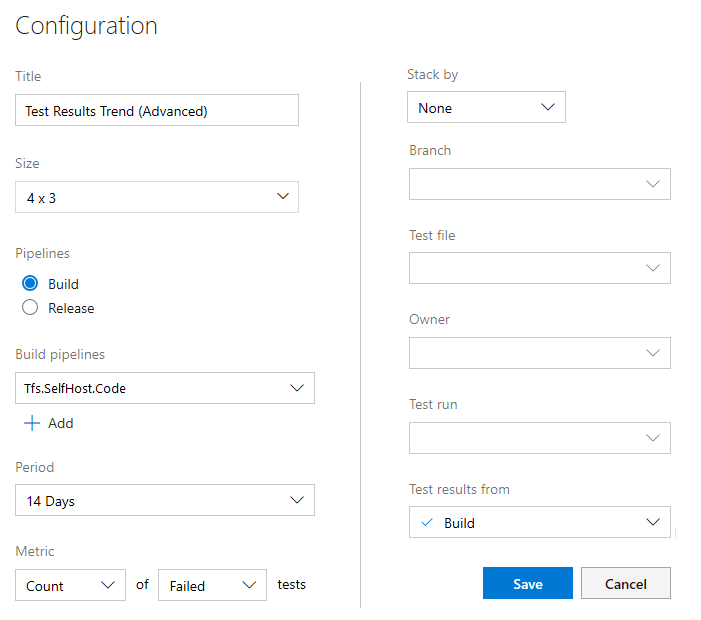
Select the
 plus icon to add one or more pipelines.
Next, select the Period, and then choose the metrics that you want to track. Optionally, apply filters for Branch, Test file, Owner, and Test run.
Select Save when you're done.
The following image shows a chart with pass rate and test results for last seven days.