Use Azure Machine Learning studio to debug pipeline failures
After you submit a pipeline job, you can select a link to the job in your workspace in Azure Machine Learning studio. The link opens the pipeline job detail page, where you can check results and debug failed pipeline jobs. This article explains how to use the pipeline job detail page and pipeline comparison (preview) to debug machine learning pipeline failures.
Important
Items marked (preview) in this article are currently in public preview. The preview version is provided without a service level agreement, and it's not recommended for production workloads. Certain features might not be supported or might have constrained capabilities. For more information, see Supplemental Terms of Use for Microsoft Azure Previews.
Use outline to quickly find a node
On the pipeline job detail page, the Outline pane at left shows the overall structure of your pipeline job. Hover on any row and select the Locate in canvas icon to highlight that node on the canvas and open an information pane for the node on the right.

In the Outline pane, you can select the Filter icon to quickly filter the view to Completed nodes only, Component only, or Data only. You can also filter the list by entering node names or component names in the Search box, or by selecting Add filter and choosing from a list of filters.

The left pane shows the matched nodes with more information including status, duration, and run time and date. You can sort the filtered nodes.

Check component logs and outputs
If your pipeline fails or gets stuck on a node, first view the logs.
Select the node to open the information pane at right.
Select the Outputs + logs tab to view all the outputs and logs from this node.
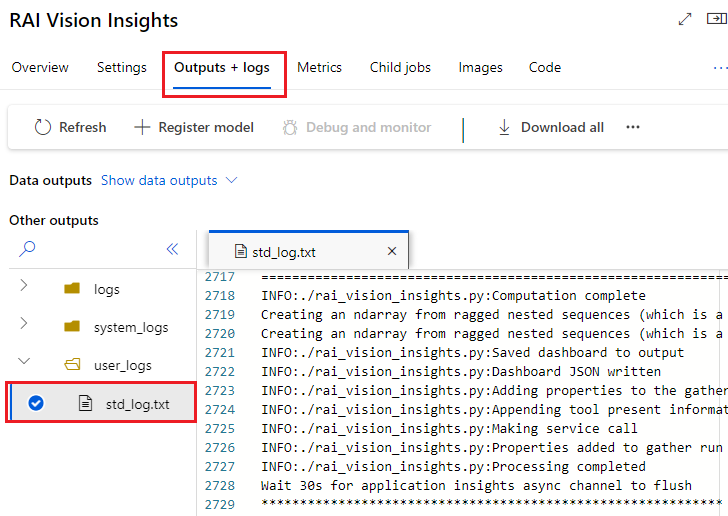
The user_logs folder contains information about user code generated logs. This folder is open by default, and the std_log.txt log is selected. Your code's logs, such as print statements, appear in the std_log.txt.
The system_logs folder contains logs generated by Azure Machine Learning. To learn more, see View and download diagnostic logs.
Note
If you don't see those folders, the compute run time update might not be released to the compute cluster yet. You can look at 70_driver_log.txt in the azureml-logs folder first.

Compare pipeline jobs (preview)
You can compare different pipeline jobs to debug failure or other unexpected issues (preview). Pipeline comparison identifies the differences, such as topology, component properties, and job properties, between pipeline jobs.
You can compare successful and failed pipeline jobs to find differences that might make one pipeline job fail. You can debug a failed pipeline job by comparing it to a completed job, or debug a failed node in a pipeline by comparing it to a similar completed node.
To enable this feature in Azure Machine Learning studio, select the megaphone icon at top right to manage preview features. In the Managed preview feature panel, make sure Compare pipeline jobs to debug failures or unexpected issues is set to Enabled.

Compare a failed pipeline job to a successful job
During iterative model development, you might clone and modify a successful baseline pipeline by changing a parameter, dataset, compute resource, or other setting. If the new pipeline fails, you can use pipeline comparison to help figure out the failure by identifying the changes from the parent pipeline.
For example, if your new pipeline failed due to an out-of-memory issue, you can use pipeline comparison to see what changes from the parent pipeline might cause memory issues.
Compare the pipeline with its parent
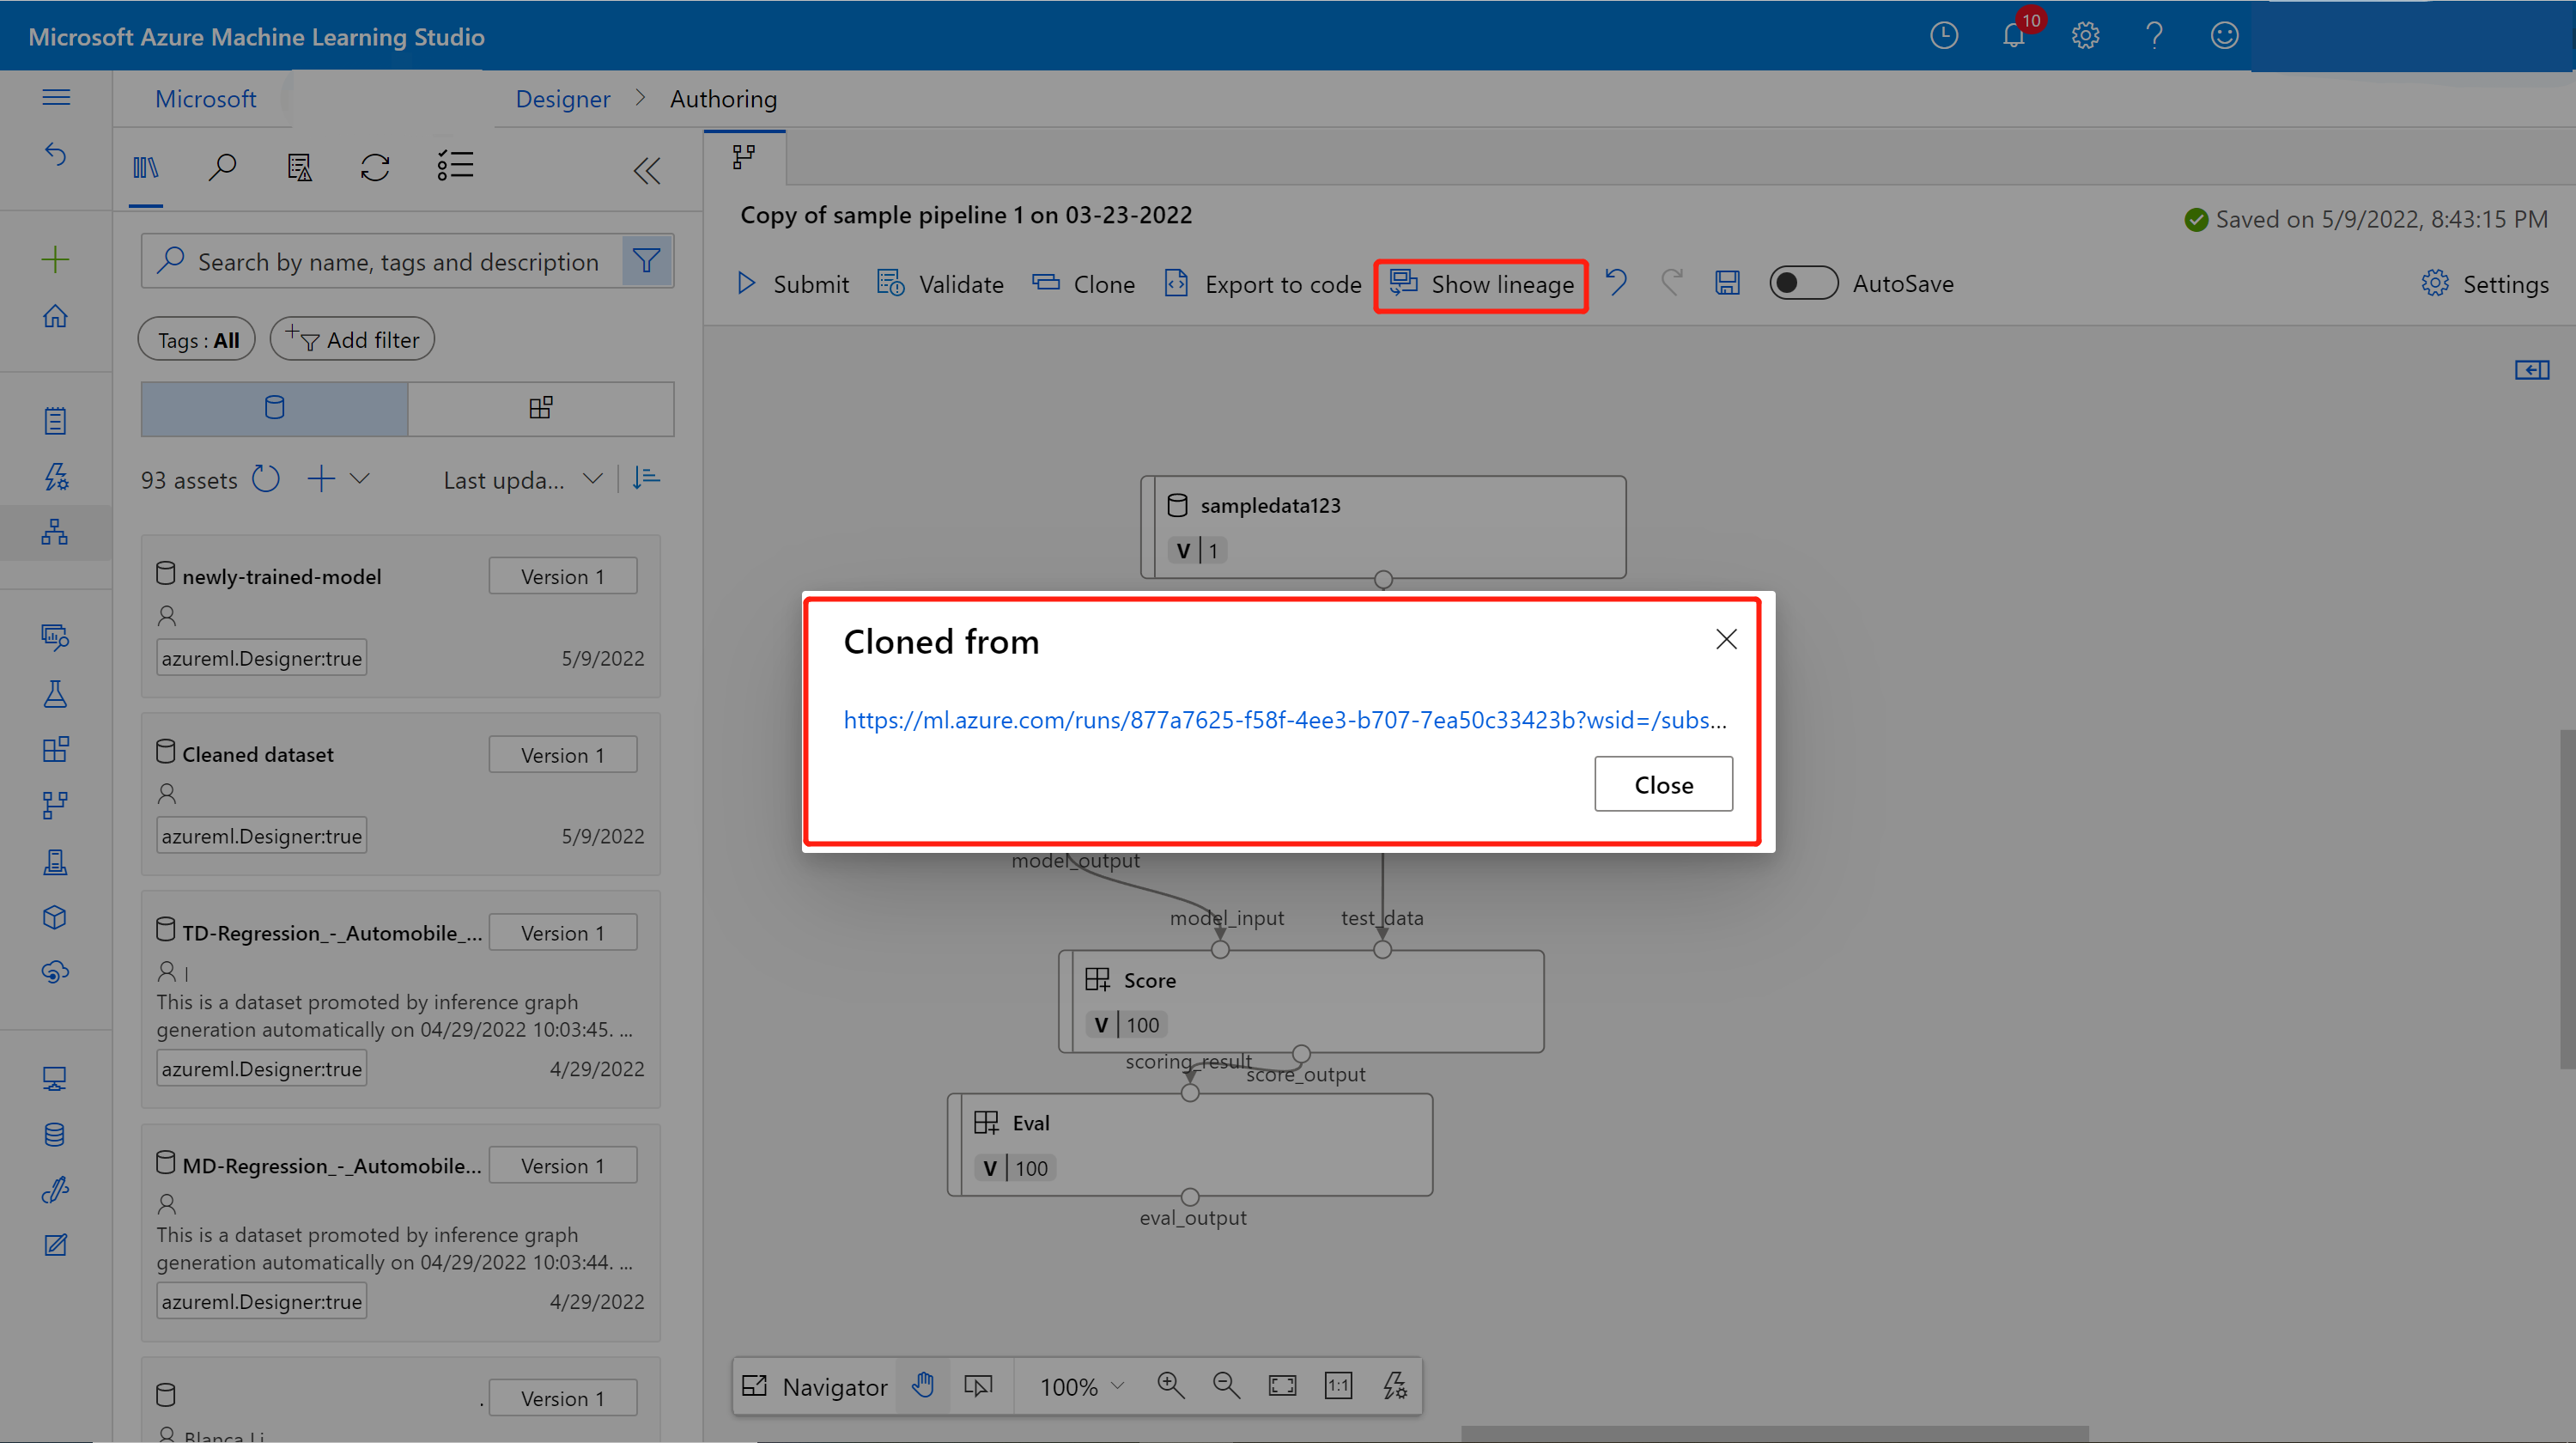
On the failed pipeline job page, select Show lineage.
Select the link in the Cloned from popup to open the parent pipeline job page in a new browser tab.
On both pages, select Add to compare on the top menu bar to add both jobs to the Compare list.
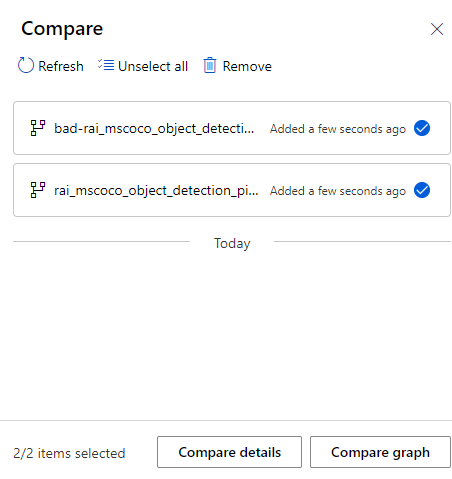


Once you add both pipelines to the comparison list, you can select Compare details or Compare graph.
Compare graph
Compare graph shows the graph topology changes between pipelines A and B. On the canvas, nodes specific to pipeline A are marked A and highlighted in red, and nodes specific to pipeline B are marked B and highlighted in green. A description of changes appears at the tops of nodes that have differences.
You can select any node to open a Component information pane, where you can see Dataset properties or Component properties like parameters, runSettings, and outputSettings. You can choose to Show only differences and to Show differences inline.

In this view, you can select Show compare details at upper right to open the pipeline Comparison overview, which shows the same information as the Details comparison page.
Compare details
To see overall pipeline and job metadata, properties, and differences, select Compare details in the compare list. The Details comparison page shows Pipeline properties and Job properties for both pipeline jobs.
- Pipeline properties include pipeline parameters, compute settings, and output settings.
- Run properties include run status, submit time and duration, and other run settings.
You can choose to Show only differences and See differences inline, or select Compare graph at upper right to open the graph topology comparison.

The following screenshot shows an example of using the detail comparison where the defaultCompute setting might be the reason for failure.

Compare a failed pipeline node to a similar completed node
If you only updated node properties, you can debug the node by comparing it with the same node in other jobs.
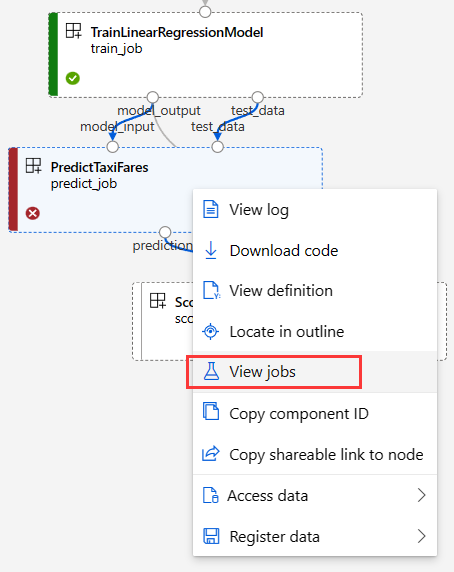
Right select a failed node and select View jobs to get a list of jobs.
Choose a completed job as a comparison target and open it.
On both job pages, select Add to compare on the top menu bar to add both jobs to the Compare list.
Once the two jobs are in the comparison list, select Compare details to show the differences.

Share debug results
To share debug results with your teammates or other stakeholders, select Share on the top menu bar. You can choose to Copy shareable link to graph or Copy pipeline job ID to share with others.
