Dimensions for Azure Stream Analytics metrics
Azure Stream Analytics provides a serverless, distributed streaming processing service. Jobs can run on one or more distributed streaming nodes, which the service automatically manages. The input data is partitioned and allocated to different streaming nodes for processing.
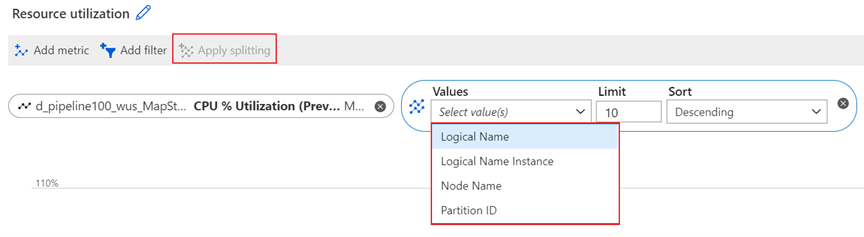
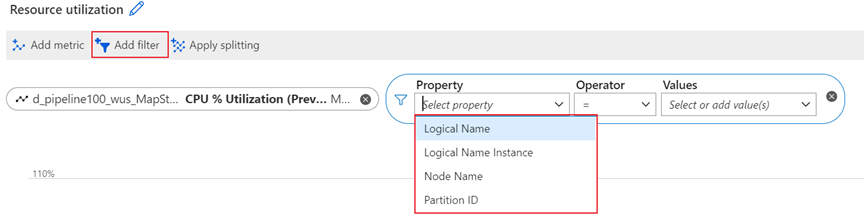
Stream Analytics has many metrics available to monitor a job's health. To troubleshoot performance problems with your job, you can split and filter metrics by using the following dimensions.
| Dimension | Definition |
|---|---|
| Logical Name | The input or output name for a Stream Analytics job. |
| Partition ID | The ID of the input data partition from an input source. For example, if the input source is an event hub, the partition ID is the event hub's partition ID. For embarrassingly parallel jobs, Partition ID in the output is the same as it is in the input. |
| Node Name | The identifier of a streaming node that's provisioned when your job runs. A streaming node represents the amount of compute and memory resources allocated to your job. |

Logical Name dimension
Logical Name is the input or output name for a Stream Analytics job. For example, assume that a Stream Analytics job has four inputs and five outputs. You'll see the four individual logical inputs and five individual logical outputs when you split input-related and output-related metrics by this dimension.


The Logical Name dimension is available for filtering and splitting the following metrics:
- Backlogged Input Events
- Data Conversion Errors
- Early Input Events
- Input Deserialization Errors
- Input Event Bytes
- Input Events
- Input Source Received
- Late Input Events
- Out-of-Order Events
- Output Events
- Watermark Delay
Node Name dimension
A streaming node represents a set of compute resources that's used to process your input data. Every six streaming units (SUs) translate to one node, which the service automatically manages on your behalf. For more information about the relationship between streaming units and streaming nodes, see Understand and adjust streaming units.
Node Name is a dimension at the streaming node level. It can help you to drill down certain metrics to the specific streaming node level. For example, you can split the CPU % Utilization metric by streaming node level to check the CPU utilization of an individual streaming node.

The Node Name dimension is available for filtering and splitting the following metrics:
- Backlogged Input Events
- CPU % Utilization (preview)
- Input Events
- Output Events
- SU (Memory) % Utilization
- Watermark Delay
Partition ID dimension
When streaming data is ingested into the Azure Stream Analytics service for processing, the input data is distributed to streaming nodes according to the partitions in the input source. The Partition ID dimension is the ID of the input data partition from the input source.
For example, if the input source is an event hub, the partition ID is the event hub's partition ID. Partition ID in the input is the same as it is in the output.

The Partition ID dimension is available for filtering and splitting the following metrics:
- Backlogged Input Events
- Data Conversion Errors
- Early Input Events
- Input Deserialization Errors
- Input Event Bytes
- Input Events
- Input Source Received
- Late Input Events
- Output Events
- Watermark Delay
Next steps
- Azure Stream Analytics job metrics
- Analyze Stream Analytics job performance by using metrics and dimensions
- Debugging with the physical job diagram (preview) in Azure portal
- Debugging with the logical job diagram (preview) in Azure portal
- Monitor a Stream Analytics job with the Azure portal
- Understand and adjust streaming units
Feedback
Coming soon: Throughout 2024 we will be phasing out GitHub Issues as the feedback mechanism for content and replacing it with a new feedback system. For more information see: https://aka.ms/ContentUserFeedback.
Submit and view feedback for