Note
Access to this page requires authorization. You can try signing in or changing directories.
Access to this page requires authorization. You can try changing directories.
INTRODUCED IN: Business Central 2026 release wave 1.
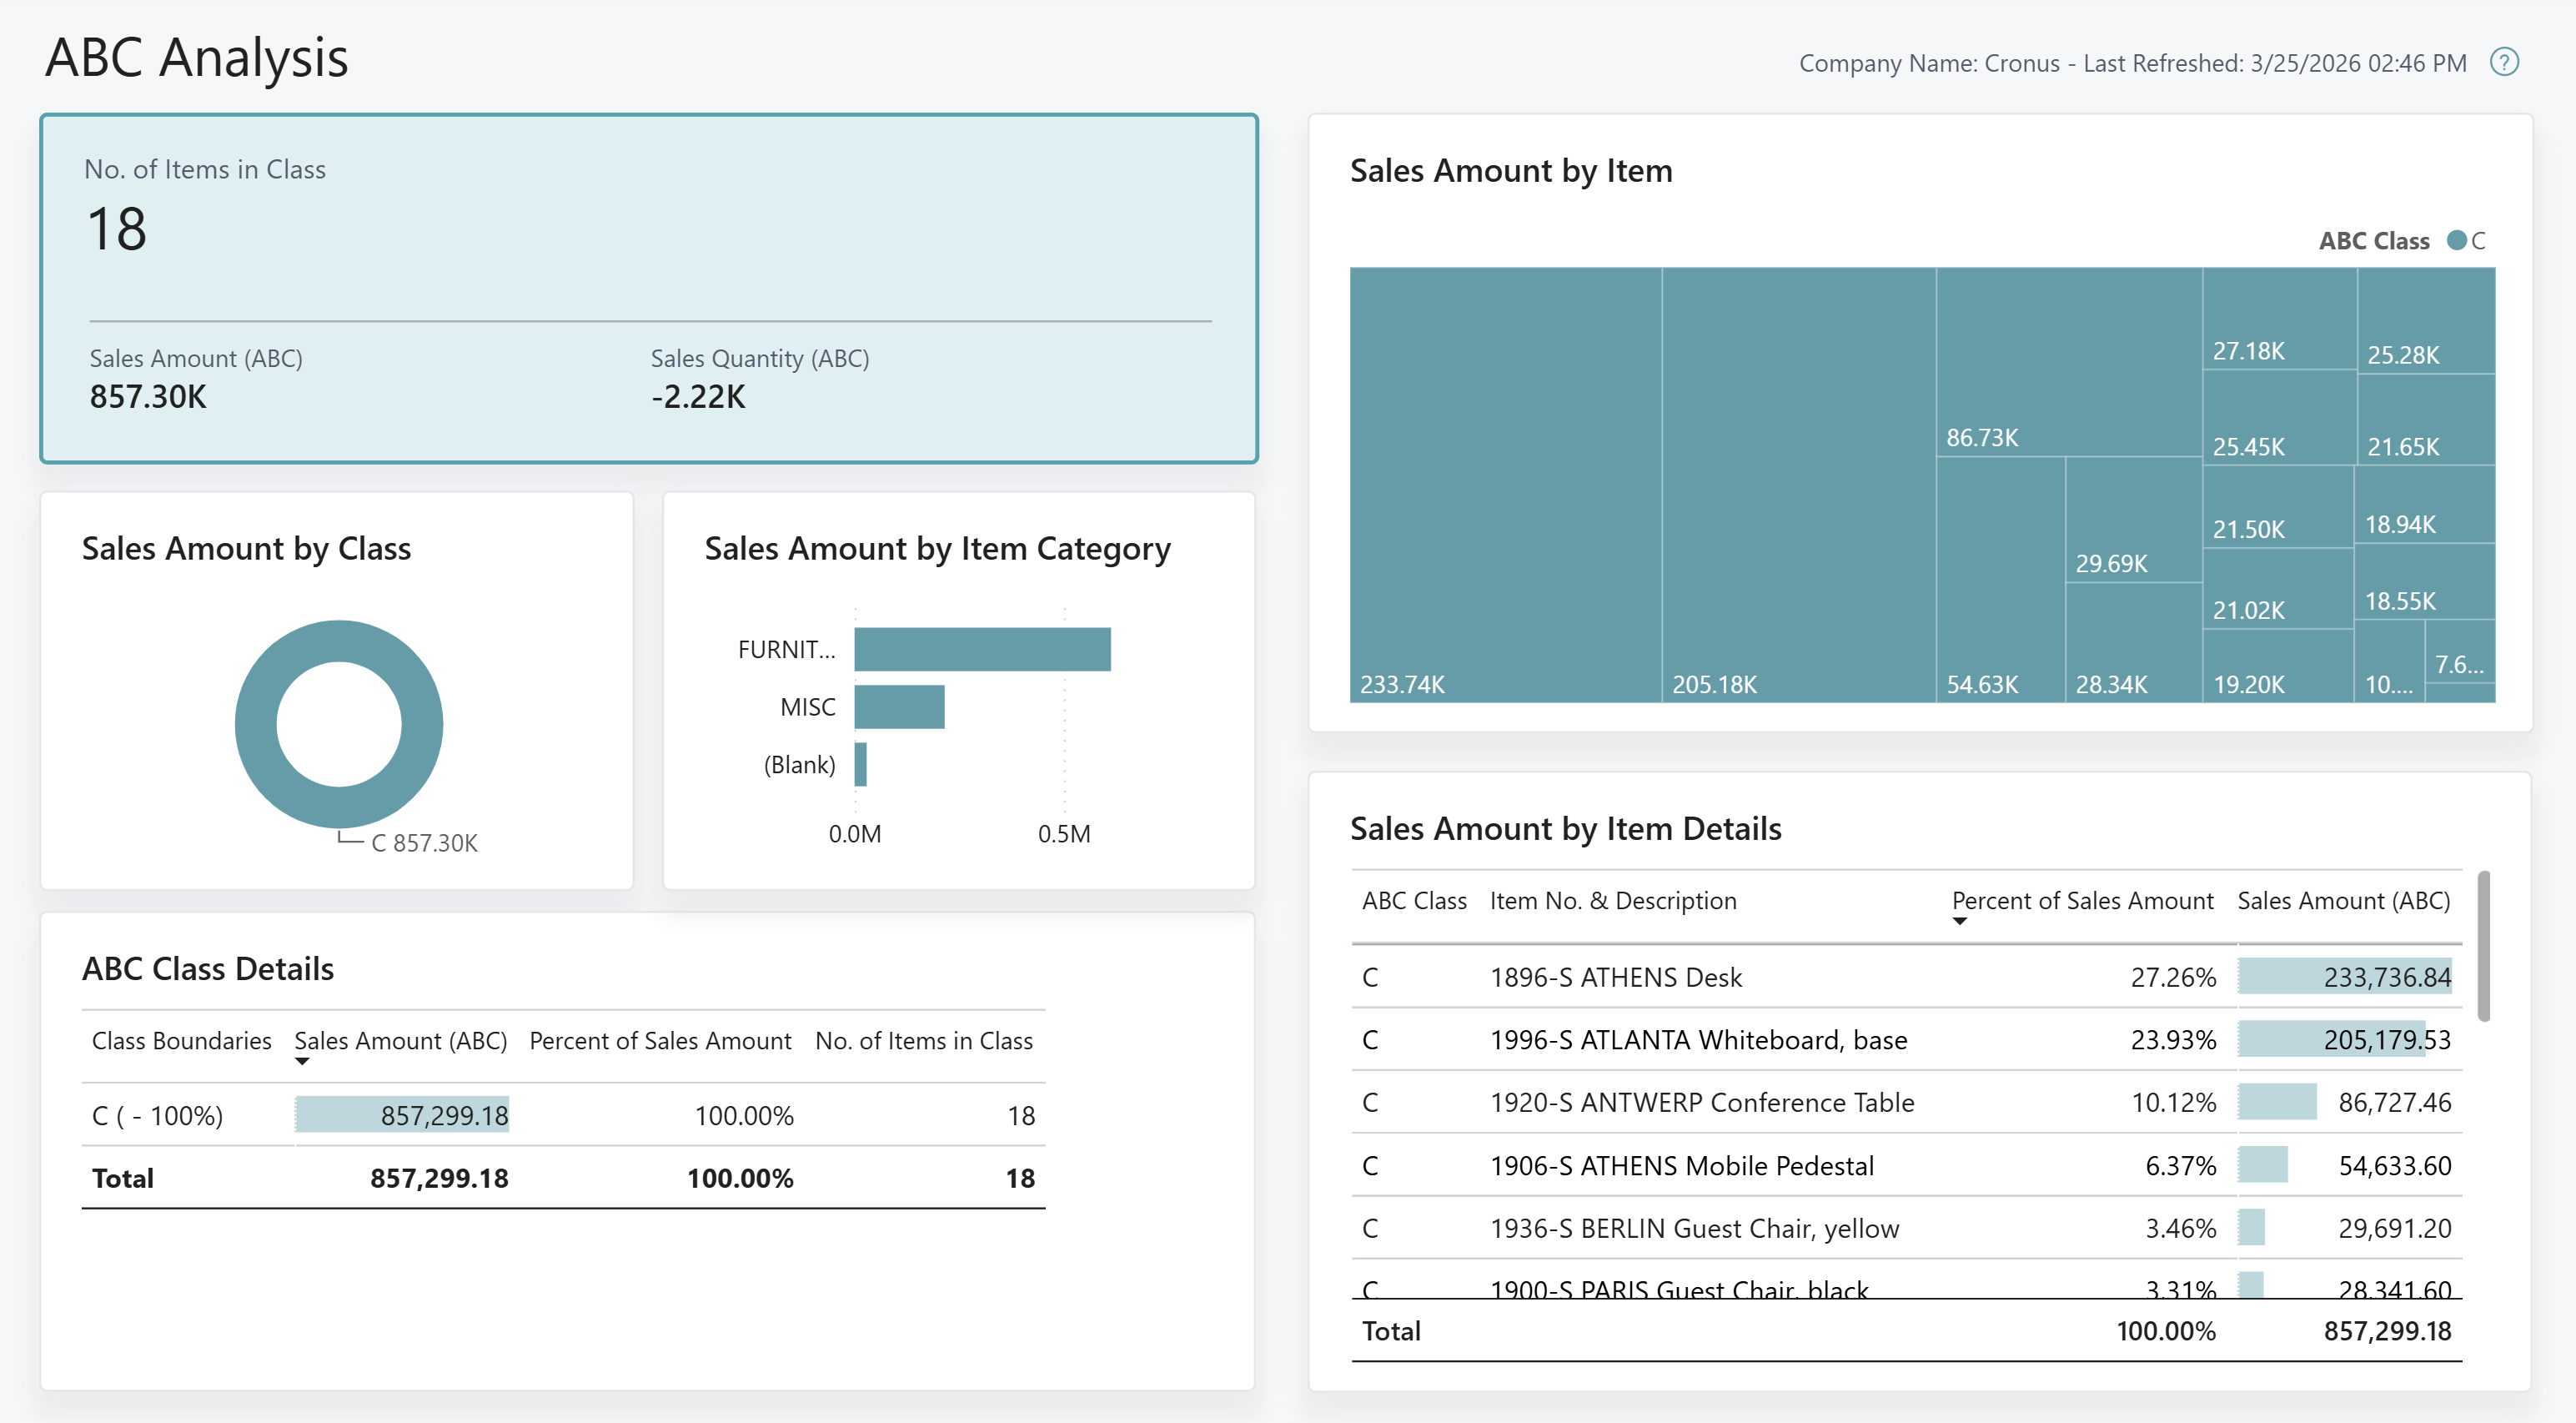
The ABC Analysis Power BI report ranks your inventory items into A, B, and C categories based on their sales amounts in local currency (LCY). Use the report to decide which items to always keep in stock and where you can afford occasional stock-outs. That way, you divert your supply chain resources to the items that matter the most.
The report calculates each item's share of total sales and classifies items by the percentage thresholds you define:
- Category A items have small volume and high value. These items drive the most revenue and should always be in stock.
- Category B items have medium volume and medium value.
- Category C items have high volume and small value. You might accept occasional stock-outs for these items.
Default category thresholds come from the ABC Analysis Setup page. Learn more at Set up ABC Analysis defaults. The same thresholds are also used by the Item - ABC Analysis (report), so the classification is consistent across both reports. You can override the thresholds on the request page each time you run the report.
Use the report
Rank inventory items into A, B, and C categories based on their sales amounts (LCY) to identify high-value items and support purchasing and replenishment decisions.
Inventory managers use the report to:
- Identify the items that contribute the most to revenue and prioritize their availability.
- Review which items fall into each category and adjust purchasing strategies accordingly.
- Spot items with zero sales that might be candidates for phase-out or promotion.
Purchasing agents use the report to:
- Focus negotiations and supplier relationships on high-value Category A items.
- Adjust reorder quantities and safety stock levels based on item classification.
- Identify Category C items where you can reduce inventory investment.
Controllers use the report to:
- Analyze the distribution of inventory value across categories.
- Support decisions about inventory write-downs or obsolescence for low-value items.
- Validate that inventory investment aligns with sales performance.
Set up ABC Analysis defaults
Before you run the report, you must set default category thresholds on the ABC Analysis Setup page. The three category percentages must add up to 100%.
- Choose the
 icon, enter ABC Analysis Setup, and then choose the related link.
 - Enter the percentage for Category A, Category B, and Category C. The values must total 100%.
- Close the page.
The report uses these values as defaults. You can override them on the request page each time you run the report.
Key performance indicators
The ABC Analysis report uses the following KPIs:
Select the link for a KPI to learn more about what it means, its calculations, and what data was used in the calculations.
Tip
You can easily track the KPIs that the Power BI reports display against your business objectives. To learn more, go to Track your business KPIs with Power BI metrics.
Data used in the report
The report uses data from the following tables in Business Central:
- Item
- Item Ledger Entries
- ABC Analysis Setup
Try the report
Try the report here: ABC Analysis
Tip
If you hold down the CTRL key while you select the report link, the report opens on a new browser tab. The new tab lets you stay on the current page while you explore the report on the other browser tab.
Related information
Track KPIs with Power BI metrics
Power BI Inventory app
Ad hoc analysis of inventory data
Built-in inventory and warehouse reports
Inventory analytics overview
Inventory overview