View data in the Data preview in Microsoft Fabric
Applies to: ✅ SQL analytics endpoint, Warehouse, and Mirrored Database in Microsoft Fabric
The Data preview is one of the three switcher modes along with the Query editor and Model view within Synapse Data Warehouse in Microsoft Fabric that provides an easy interface to view the data within your tables or views to preview sample data (top 1,000 rows).
- You can also query the data in your warehouse with multiple tools with a SQL connection string.
- You can use the SQL query editor to write T-SQL queries from the Microsoft Fabric portal.
- You can build queries graphically with the Visual query editor.
Get started
After creating a warehouse and ingesting data, select a specific table or view from the Object explorer that you would like to display in the data grid of the Data preview page.

Search value – Type in a specific keyword in the search bar and rows with that specific keyword will be filtered. In this example, "New Hampshire" is the keyword and only rows containing this keyword are shown. To clear the search, select the
Xinside the search bar.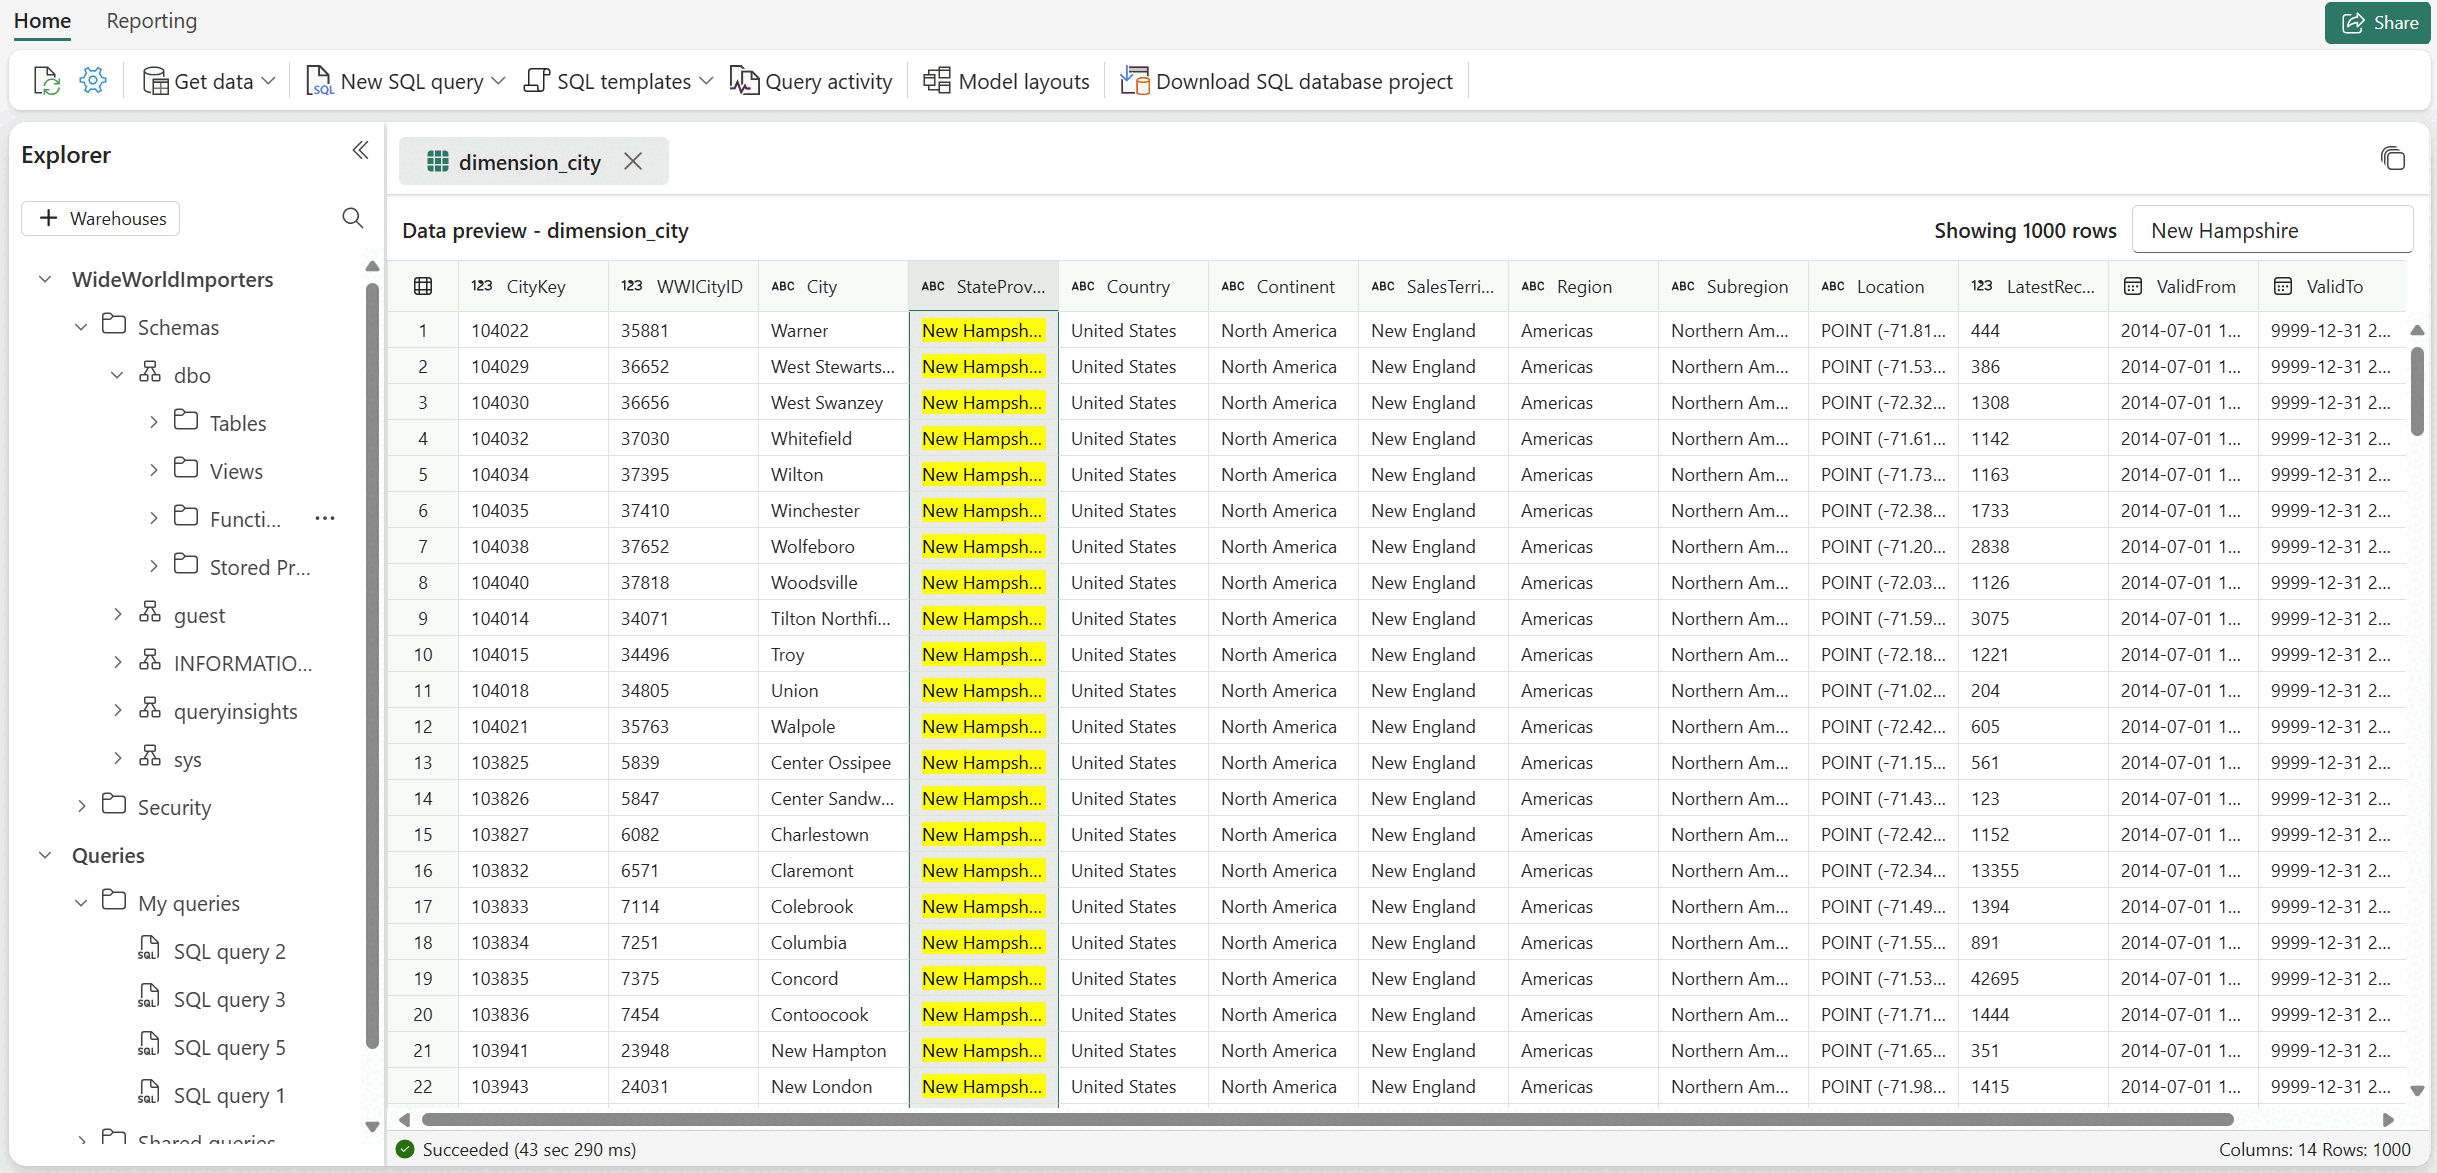
Sort columns (alphabetically or numerically) – Hover over the column title to see the More Options (...) button appear. Select it to see the "Sort Ascending" and "Sort Descending" options.

Copy value – Select a specific cell in the data preview and press
Ctrl + C(Windows) orCmd + C(Mac).


Considerations and limitations
- Only the top 1,000 rows can be shown in the data grid of the Data preview.
- The Data preview view changes depending on how the columns are sorted or if there's a keyword that is searched.