Customize results in the KQL Queryset results grid
Use the results grid in the KQL Queryset to customize results and perform further analysis on your data. This article describes actions that can be done in the results grid after a query has been run.
Prerequisites
- A workspace with a Microsoft Fabric-enabled capacity
- A KQL Database with editing permissions and data
- A KQL Queryset
Expand a cell
Expanding cells are useful to view long strings or dynamic fields such as JSON.
Double-click a cell to open an expanded view. This view allows you to read long strings, and provides a JSON formatting for dynamic data.
Select on the icon on the top right of the result grid to switch reading pane modes. Choose between the following reading pane modes for expanded view: inline, below pane, and right pane.
Expand a row
When working with a table with many columns, expand the entire row to be able to easily see an overview of the different columns and their content.
Click on the arrow > to the left of the row you want to expand.
Within the expanded row, some columns are expanded (arrow pointing down), and some columns are collapsed (arrow pointing right). Click on these arrows to toggle between these two modes.
Group column by results
Within the results, you can group results by any column.
Run the following query:
StormEvents
| sort by StartTime desc
| take 10
Hover over the State column, select the menu, and select Group by State.
In the grid, double-click on California to expand and see records for that state. This type of grouping can be helpful when doing exploratory analysis.
Hover over the Group column, then select Reset columns/Ungroup by <column name>. This setting returns the grid to its original state.

Hide empty columns
You can hide/show empty columns by toggling the eye icon on the results grid menu.
Filter columns
You can use one or more operators to filter the results of a column.
To filter a specific column, select the menu for that column.
Select the filter icon.
In the filter builder, select the desired operator.
Type in the expression you wish to filter the column on. Results are filtered as you type.
Note
The filter isn't case sensitive.
To create a multi-condition filter, select a boolean operator to add another condition
To remove the filter, delete the text from your first filter condition.
Run cell statistics
Run the following query.
StormEvents
| sort by StartTime desc
| where DamageProperty > 5000
| project StartTime, State, EventType, DamageProperty, Source
| take 10
In the results pane, select a few of the numerical cells. The table grid allows you to select multiple rows, columns, and cells and calculate aggregations on them. The following functions are supported for numeric values: Average, Count, Min, Max, and Sum.
Filter to query from grid
Another easy way to filter the grid is to add a filter operator to the query directly from the grid.
Select a cell with content you wish to create a query filter for.
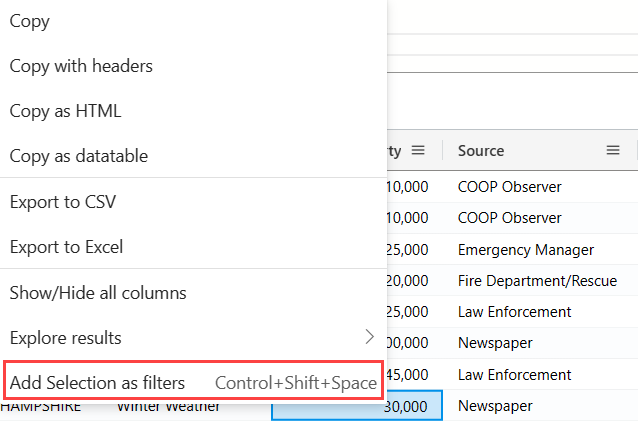
Right-click to open the cell actions menu. Select Add selection as filter.

A query clause will be added to your query in the query editor:

Pivot
The pivot mode feature is similar to Excel's pivot table, enabling you to do advanced analysis in the grid itself.
Pivoting allows you to take a column's value and turn them into columns. For example, you can pivot on State to make columns for Florida, Missouri, Alabama, and so on.
On the right side of the grid, select Columns to see the table tool panel.

Select Pivot Mode, then drag columns as follows: EventType to Row groups; DamageProperty to Values; and State to Column labels.

The result should look like the following pivot table:
Search in the results grid
You can look for a specific expression within a result table.
Run the following query:
StormEvents
| where DamageProperty > 5000
| take 1000
Select the Search button on the right and type in "Wabash"
All mentions of your searched expression are now highlighted in the table. You can navigate between them by clicking Enter to go forward or Shift+Enter to go backward, or you can use the up and down buttons next to the search box.


