Client health dashboard
Applies to: Configuration Manager (current branch)
You deploy software updates and other apps to help secure your environment, but these deployments only reach healthy clients. Unhealthy Configuration Manager clients adversely effect overall compliance. Determining client health can be challenging depending upon the denominator: how many total devices should be in your scope of management? For example, if you discover all systems from Active Directory, even if some of those records are for retired machines, this process increases your denominator.
Configuration Manager provides a dashboard with information about the health of clients in your environment. View your client health, scenario health, and common errors. Filter the view by several attributes to see any potential issues by OS and client versions.
By default, the client health dashboard shows online clients, and clients active in the past three days. So you may see different numbers in this dashboard than in other historical sources of client health. For example, other nodes under Client Status, or reports in the client status category.
In the Configuration Manager console, go to the Monitoring workspace. Expand Client status, and select the Client health dashboard node.

Note
Configuration Manager version 2111 includes improvements to this dashboard. This article mainly focuses on the current experience. For more information on the dashboard appearance and behavior in version 2107 and earlier, see Version 2107 and earlier.
To view this dashboard your account needs the Read Client Status Settings permission on the Site object.
Configure
There are two actions in the ribbon to configure client health and the dashboard:
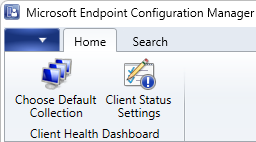
Choose Default Collection: Set a persistent user preference for the collection to scope the dashboard.
When you set the collection on the Filter tile of the dashboard, that selection resets when you refresh the dashboard.
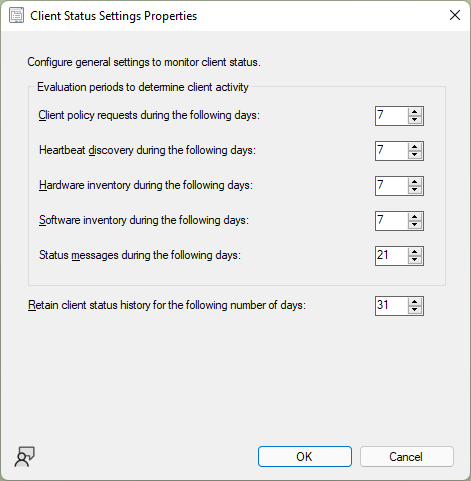
Client Status Settings: Adjust the evaluation periods for scenario health. By default, if a client doesn't send scenario-specific data in 7 days, Configuration Manager considers it unhealthy for that scenario.
Tip
You can also configure these settings from the ribbon of the Client Status node.
Scenario health isn't measured from your configuration of client settings. These values can vary based upon the resultant set of policy per device.
Filters
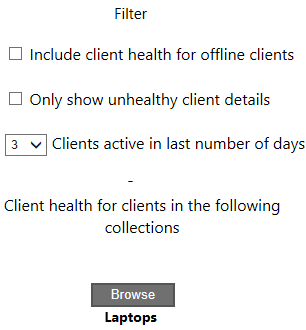
The single Filter tile at the top of the dashboard lets you adjust the data that it displays. It includes the following filters:
Include client health for offline clients: By default, the dashboard displays only online clients. This state comes from the client notification channel that updates a client's status every five minutes. For more information, see About client status.
Only show unhealthy client details: Scope the view to only devices that are reporting a client health failure.
Tip
Combine this filter with the tiles for Client Versions and OS Versions. For more information, see Version tiles.
Clients active in last number of days: By default, the dashboard displays clients that are active in the last three days.
Client health for clients in the following collections: By default, the dashboard displays devices in the All Systems collection. Browse for a device collection to scope the view to a subset of devices in a specific collection.
Tip
This filter is temporary. When you refresh the dashboard, it'll reset to the default. To change the collection scope so it's persistent, use the Choose default collection action in the ribbon. For more information, see Configure the dashboard.
Overall client health
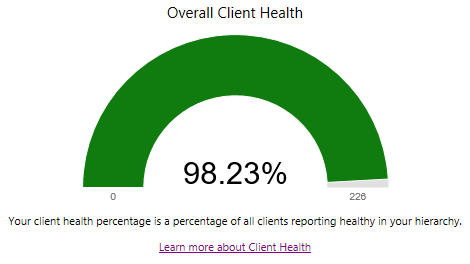
This tile shows the percentage of all clients reporting healthy in your hierarchy. This percentage should be as close to 100% as possible. It's on the top row, which makes it easier to see when you view the dashboard.
A healthy Configuration Manager client has the following properties:
- Online
- Actively sending data
- Passes all client health evaluation checks
For more information, see About client status.
A healthy client successfully communicates with the site. It reports all data based on the defined schedules.
Select a segment of this chart to drill down to a device list view.
Clients with any failure
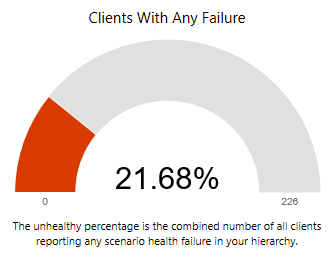
This tile shows the percentage of clients that report any health issue. This percentage should be as close to 0% as possible.
Hover over the segment to see the number of devices that are unhealthy. Select it to drill down to a device list view.
Tip
This tile replaces the Combined (All) and Combined (Any) scenarios from earlier versions.
Version tiles
| Client Versions | OS Versions |
|---|---|
|
|
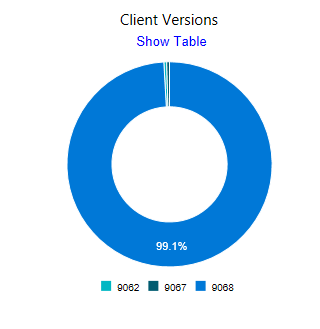
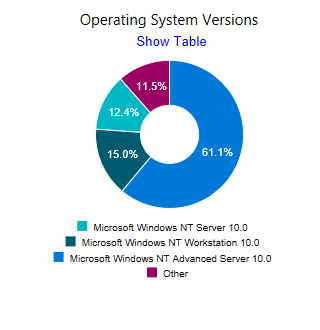
There are two tiles that show client health by Configuration Manager Client versions and OS versions. These tiles are useful when you make changes to the filters, such as Failure only. They can help highlight whether any issues are consistent across a specific version. Use this information to help you make upgrade decisions.
Select a segment of these charts to drill down to a device list view.
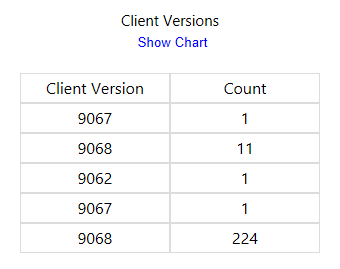
Select Show table to switch to a table view of the data. You can select and copy the data from the table. Select Show chart to show the donut chart. The following example shows a chart of Configuration Manager client versions:
Scenario health
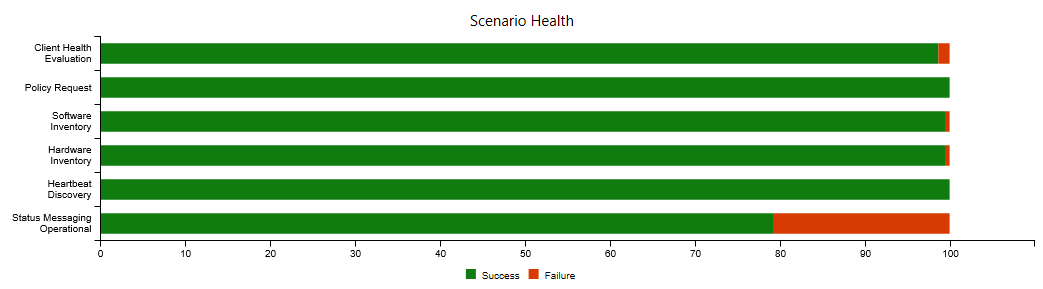
This bar chart shows the overall health for the following core scenarios:
- Client health evaluation (client policy)
- Policy request
- Software inventory
- Hardware inventory
- Heartbeat discovery
- Status messaging operational (status messages)
Health trends by scenario
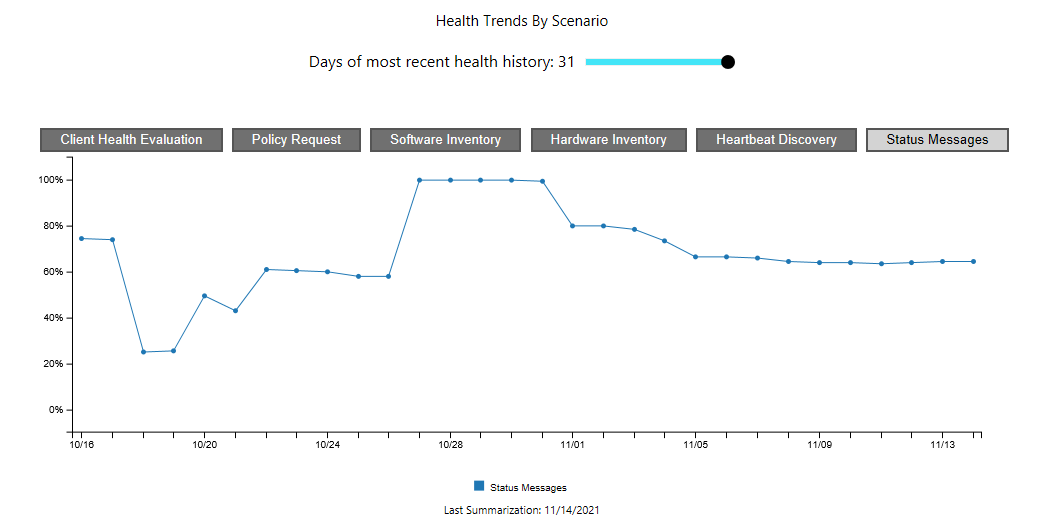
This tile shows the percentage of healthy clients for the selected scenario. To adjust the number of days the chart displays, use the slider control at the top of the tile.
Note
The maximum value for the slider control is the same as the Retain client status history for the following number of days in Client Status Settings. It's 31 days by default.
It's limited by the amount of client health data in the site database. For example, you configure it to display 31 days of history. There's only three days of available data, so the chart shows three days.
Top 10 client health failures
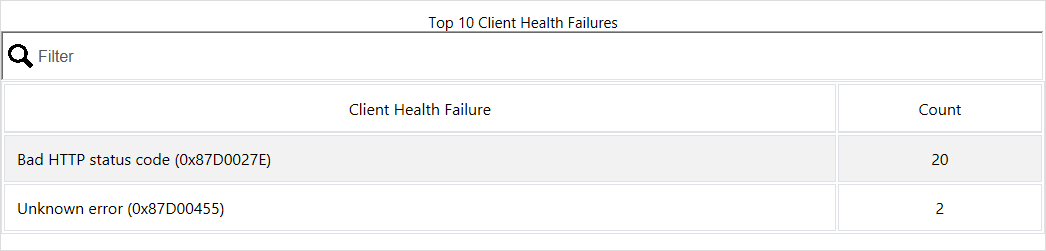
This chart lists the most common failures in your environment. These errors come from Windows or Configuration Manager.
Select a row of this table to drill down to a device list view. This action lets you easily create a collection of devices to target a remediation action or for more detailed reporting.
Version 2107 and earlier
Note
This section applies to version 2107 and earlier.

Filters in 2107 and earlier
At the top of the dashboard, there's a set of filters to adjust the data displayed in the dashboard.
Client health for clients in the following collections: By default, the dashboard displays devices in the All Systems collection. Select a device collection to scope the view to a subset of devices in a specific collection.
Client active in last number of days: By default, the dashboard displays clients that are active in the last three days.
Include client health for offline clients: By default, the dashboard displays only online clients. This state comes from the client notification channel that updates a client's status every five minutes. For more information, see About client status.
Only show unhealthy client details: Scope the view to only devices that are reporting a client health failure.
Tip
Use this filter along with the client version and OS version tiles. For more information, see Version tiles.
Overall client health in 2107 and earlier
This tile shows the overall client health in your hierarchy.
A healthy Configuration Manager client has the following properties:
- Online
- Actively sending data
- Passes all client health evaluation checks
For more information, see About client status.
A healthy client successfully communicates with the site. It reports all data based on the defined schedules in client settings.
Select a segment of this chart to drill down to a device list view.
Version tiles in 2107 and earlier
There are two tiles that show client health by Configuration Manager client version and OS version. These tiles are useful when you make changes to the filters, such as Failure only. They can help highlight whether any issues are consistent across a specific version. Use this information to help you make upgrade decisions.
Select a segment of these charts to drill down to a device list view.
Scenario health in 2107 and earlier
This bar chart shows the overall health for the following core scenarios:
- Client policy
- Heartbeat discovery
- Hardware inventory
- Software inventory
- Status messages
Use the selectors to adjust the focus on specific scenarios in the chart.
The following two bars are always shown:
- Combined (All): the combination of all scenarios (AND)
- Combined (Any): at least one of the scenarios (OR)
Top 10 client health failures in 2107 and earlier
This chart lists the most common failures in your environment. These errors come from Windows or Configuration Manager.
Next steps
For more information on the client's regular checks to keep healthy, see Client health checks.
Use the Surface device dashboard to see the use of Surface devices in your environment.
Feedback
Coming soon: Throughout 2024 we will be phasing out GitHub Issues as the feedback mechanism for content and replacing it with a new feedback system. For more information see: https://aka.ms/ContentUserFeedback.
Submit and view feedback for