Process map overview
A process map provides a view of the activities performed in a process and their sessions. It represents the behavior of the process captured in data by means of activities and directed edges.
The process map corresponds with the mining result of the process. It reflects filter settings above the data, and the chosen frequency, or time metrics. When you apply filters, mining is performed again, metrics are recalculated, and a new process map is generated.
Process map nodes
Process map activities (also known as nodes) represent a unique activity, or unique values of different selected mining attributes, performed, executed, or passed through in the process.
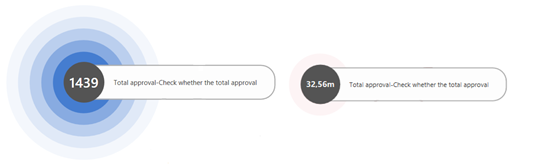
Frequency metric, time metric, or finance metric can be displayed for nodes. The system can display only one metric at a time.
The size and color of the highlight (also known as the halo effect) expresses the total proportion of the frequency, time metric in question in relation to the other nodes in the process map.
Process map edges
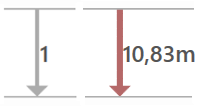
Chart edges represent transitions between individual events and describe the sequence of activities in the process. A transition between events means that they directly follow one after the other. The thickness of the edge and the number displayed next to it depend on the selected display metric (frequency, time, finance) and its value.
Start and end node
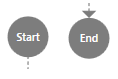
All nodes/activities starting process instances are connected to the start node. All nodes/activities ending process instances are connected to the end node. These nodes don't represent process nodes/activities, but the input and output points of the process under analysis. Their purpose is to facilitate the identification of the start and end nodes/activities of the process. The display of these nodes and edges related to them can be turned off in the Process Map Display Settings panel.
Start and end identifier
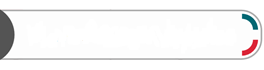
Chart nodes starting and ending process instances contain colored indicators in the right part of the node. The green indicator represents the initial activity (upper right), the red indicator represents the final activity (bottom right) of the process. A node occurs as each start and end in process instances contains both indicators.
Manage process map views
When you open a project view for the first time, a process map with the default view parameters displays. The structure of the process map and the information vary depending on your view settings. The default process map typically contains the backbone of the process. It displays the most frequent activities and the most dominant edges. The basic view also includes the start and end nodes.
The following table describes ways that you can manage views.
| Action | Description |
|---|---|
| Switch views from the Processes screen | On the command bar at the top left, select Processes, and then select another process. |
| Switch views from the current screen | On the command bar at the center, select the dropdown menu, and then choose an option. |
| Rename, save, save as, and discard a process | On the command bar at the top, select the Save dropdown menu and choose an option. |
| View ongoing tasks | On the title bar, select Tasks (the bell icon). You'll see the status of tasks that are running in the background and the history of completed tasks. If a task couldn't be completed, select Retry to restart it. If you want to edit its parameters before restarting the task, select Edit. |
Node details
If you select a node, detailed information about the activity displays.
| Detail | Description |
|---|---|
| Frequency | The frequency information about a process activity. |
| Performance | Information about the duration of an event/activity compared to the entire process under analysis. For example, you can find out the total time or average duration of the activity. |
| Rework | Various metrics about activity repetitions within the cases. For example, you can find out how many times the activity has been repeated or how many times the activity was followed by a repeated activity. |
| Financial analysis | Finance information about a process activity. For example, you can find out the total costs/incomes about process activity, average values, costs/incomes about the case, and more. |
| Custom metrics | Information about the custom metrics. To learn more, go to Custom metrics. |
| Business rules | Information about the business rules. To learn more, go to Business rules. |
| Top attributes | An overview of the most frequent attributes in the event. If there are more attributes available in the process, you can also add displayed information to the other attributes. |
| Advanced panel | To display the advanced panel for a node, select Advanced Panel button. This panel displays a list of previous or subsequent activities with a selected attribute and an optional number of attribute values. On this panel, you can display only the attributes that were marked as case-level attributes during the process import. To switch to the list of previous or next activities, select Predecessor/Successor button on the top of the panel. |
Edge details
If you select an edge, detailed information about the transition displays.
| Detail | Description |
|---|---|
| Frequency | Frequency information about an edge/transition in the process. |
| Performance | information about the duration of the transition compared to the entire process under analysis. The duration of the transition represents the waiting time between the end of the previous event and the beginning of the next event. |
| Rework | Various metrics about the edge repetitions within cases. For example, you can find out how often the edge/transition is repeated in comparison to the total edge occurrences. You can also compare how many times the starting and ending activities of the edge were repeated. |
| Financial analysis | Information about the costs/incomes of the whole case given the case-level finance attribute. |
| Custom metrics | Information about the custom metrics. To learn more, go to Custom metrics. |
| Top attributes | Overview of the most frequently occurring attributes within the event. If there are multiple attributes within a process, you can add displaying of the information to other attributes. Only attributes that were marked as case-level attributes during the process import can be added among the top attributes of this panel. The number of displayed values of the selected attributes is optional. |
| Top attributes | Overview of the most frequently occurring attributes within the event. If there are multiple attributes within a process, you can add displaying of the information to other attributes. Only attributes that were marked as case-level attributes during the process import can be added among the top attributes of this panel. The number of displayed values of the selected attributes is optional. |
| Advanced panel | To display the advanced panel for an edge, select Advanced Panel. This panel displays the starting and ending activities of the edge with the selected attribute and an optional number of attribute values. On this panel, you can view any attribute imported with the process. |
Process map settings
To open the process map settings, select Customize on the right side of the screen.

The Customize panel allows you to choose between the process map or the social chart. Switching between these views will cause mining in the process to start over.
Mining attribute selection
By default, the process map displays based on the Activity attribute, which is a standard mining attribute. You can observe the process flow between the executed activities. If you want to see how the process flows between values of a different event level attribute (for example, Resource, but not in social chart layout, regions, departments, or plants, a Mining Attribute Selection is available.
Mining attribute selections shows only relevant event log attributes and by selecting a different attribute, the process map is recalculated including the available metrics used in frequency, performance, finance, or rework analysis.
The selection of the mining attribute has an impact on the process map view and included metrics, but it doesn't influence the other process view screens, which are still calculated using the Activity attribute.
Variant analysis screen is available also for other mining attributes. A separate selection must be used. To learn more, go to Variant mining attribute.
Activities
Use this slider to determine the number of activities to be shown on the process map. It changes the complexity of the process map based on the importance of the activities performed in the process.
Paths
Use this slider to determine the number of transitions shown on the process map. It changes the amount of detail in the process view with regards to links between activities found in the process.
You can filter displayed edges/transitions using the edge slider. It defines the range of edge metric values which are shown to the user, hiding unimportant edges/transitions. This control doesn't affect the data set but helps to focus on the most relevant aspects of the process map transitions.
Map clustering
Map clustering allows you to visually encapsulate activities in the process map view into clusters. You can also do this in the social chart view with a resource attribute selected. Nodes are grouped and laid out close to each other and visually bordered by blue dashed rectangles based on the value of the selected clustering attribute.
On the panel to the right, select Customize (the top icon).
Select either the Process map or Social chart tab.
In the Mining attribute dropdown menu, select an attribute.
In the Clustering attribute dropdown menu, select an attribute.
The map clustering attribute selection control is populated automatically by Power Automate Process Mining. The attributes must fulfill the following premises:
Process map: Each value of the attribute Activity must have exactly one corresponding value of the clustering attribute. It can also be an empty value. In this case, the activity is placed on canvas outside of any cluster. For example, approval must have always value Management in clustering attribute and PO archival must always have value Accounting.
Social chart: Each value of the attribute Resource must have exactly one corresponding value of the clustering attribute. It can also be an empty value. In this case, the resource is placed on canvas outside of any cluster. For example, John Doe must always have the value CostCenter1 in the clustering attribute and Mary Jane must always have the value CostCenter34.
A specific activity or resource can be included only in one cluster, or outside of any cluster.
The clusters are collapsible/expandable so that you can simplify the process map by hiding the activities/resources in the cluster. To do this, select the blue icon with two arrows in the top right corner of the cluster border. To expand the cluster, select the two arrows icon on the cluster (which is highlighted in blue color).
It's also possible to collapse or expand all clusters at the same time using the Collapse All/Expand All options in the clustering context menu.
Hierarchical process maps
Hierarchical process maps use clustering technique to enable you to visually encapsulate activities in clusters. They group them into further clusters in the process map view or resource in the social chart view. Nodes are grouped and laid out close to each other and are visually bordered by blue dashed rectangles based on the value of the selected clustering attributes.
Hierarchical process maps allow you to drill down into a hierarchy of clusters, analyze aggregated data for individual hierarchy levels, and focus only on relevant process parts, even in very complex unstructured processes. Functionality can be used with added value in RPA initiatives to drill down into either UI recording combined with high level IS event logs, and in bot monitoring scenarios to drill down into bot execution. Organizational structure mining, hardware infrastructure, and software system structure are other use cases.
To learn more, go to Hierarchical process mining.
Process map advanced settings
The following properties can be set in the advanced settings of the process map:
Display start and end nodes, and edges related to them.
Store the backbone activities on the same line on the process map.
Map orientation: Top to bottom or left to right.
Highlight the activities that go before and after the activity being presently monitored.
Export a process map
A process map can be converted and exported into a BPMN 2.0 compliant format that allows you to work with the map in any standard BPMN modeling tool.
A process or social map can also be exported as:
PNG image
XML file containing a list of activities and edges (for processing in any 3rd party tools)
To export process map, select Export process map on the menu at the top, and then make your selection.
Social chart
The social chart shows the important parts and parameters of your process through links and dependencies between resources involved in the process.
Social chart advanced settings
You can set the following properties in the advanced settings of the social graph:
Display start and end nodes and edges related to them.
Highlight resources connected to the resource currently monitored.
Switch chart layout
Use the switch to switch chart layout according to different algorithms. The option to switch chart layout is especially important for large and complex charts and to make process analysis easier. The layouts are designed to display social graphs with a large number of nodes and edges.
Resources
Use this slider to determine the number of resources to be shown in the social chart. It changes the complexity of the chart based on the importance of the resources entering the process.
Connections
Use this slider to determine the number of connections to be shown in the social graph.
Variant panel
The Variant panel contains a list of variants created during the process reconstruction. Variants can be arranged according to the number of process instances they group or by the number of events in case of variants. By selecting each variant in the list, the sequence of one or more variants in the process or social map will be highlighted. The selected variants can be filtered immediately on the filter screen by selecting the filter icon.
When selecting one or more variants to the right of the indicator of the current volume of process instances and events, a coverage indicator of the process instances by the selected variants is displayed at the bottom of the screen. If the complexity of the process map was reduced with the scrolling elements, not all process activities or edges are shown, the number of not shown activities and edges of the selected variants displays in the lower right corner.
View settings
To define various settings valid only for the current view, select View Settings on the command bar at the top.
To learn more, go to View settings.
Feedback
Coming soon: Throughout 2024 we will be phasing out GitHub Issues as the feedback mechanism for content and replacing it with a new feedback system. For more information see: https://aka.ms/ContentUserFeedback.
Submit and view feedback for