Analyze your attack surface with dashboards
Discovering hundreds—or even thousands—of internet-facing assets is valuable, but without context it's overwhelming. External Attack Surface Management (EASM) dashboards transform that raw inventory data into actionable risk intelligence, helping you identify which findings deserve attention first. In Contoso's case, the dashboards reveal which of those newly discovered assets pose the most immediate security risks. EASM includes eight dashboards; here, you learn how to use the four focused on security operations and vulnerability prioritization.
| Dashboard | Use it to... |
|---|---|
| Overview | Get an at-a-glance view of your attack surface and recent changes |
| Attack surface summary | Understand asset types, vulnerability distribution, and sensitive service exposure |
| Security posture | Identify CVE exposure, risky open ports, SSL issues, and domain risks |
| OWASP Top 10 | Find web application vulnerabilities across your external-facing pages |
Navigate the Overview and Attack surface summary dashboards
EASM dashboards are analytical tools—they surface, prioritize, and contextualize findings across your attack surface by severity. They don't issue work orders or trigger fixes. Remediation happens in your external workflows or through the Defender for Cloud integration covered in the next unit. Think of these dashboards as giving you the full outside-in view of your organization, organized by risk, so you know exactly what to hand off and why.
The Overview dashboard serves as your landing page when you open EASM. It provides immediate context: how many assets you have, how they're distributed by type, and which risks are flagged as high, medium, or low priority. For daily security operations, this dashboard offers a quick health check of your attack surface. You can see at a glance whether new high-priority findings appeared overnight or whether recent remediation efforts reduced your risk counts.
The Attack surface summary dashboard goes deeper. It breaks down your full attack surface by asset type—domains, hosts, pages, IP blocks, SSL certificates, and autonomous system numbers (ASNs). Each asset type shows vulnerability severity counts with direct links to filter the inventory view. This dashboard answers critical questions about your infrastructure composition.
The cloud hosting breakdown reveals which providers host your external assets. For Contoso, this insight becomes valuable after the acquisition—some partner assets might be hosted on AWS or other cloud platforms rather than Azure. The sensitive services section highlights databases, remote management ports, and file-sharing services accessible from the internet. You also see SSL certificate expiration timelines (30, 60, 90 days), domain expiry warnings, and IP reputation findings.
Important
IP reputation findings indicate that Microsoft detected signals—such as involvement in DDoS activity or associations with malicious behavior—linked to an owned IP address. A flagged IP can indicate the asset is susceptible to attack or already leveraged by a malicious actor. Investigate flagged IPs promptly, especially for acquired infrastructure where the operational history can be unknown to your team.
Identify critical risks with the Security posture dashboard
The Security posture dashboard provides the most immediately actionable technical findings for remediation. It organizes discoveries into four critical categories that directly map to common attack vectors.
CVE exposure shows you external-facing assets with known Common Vulnerabilities and Exposures—these are security flaws visible from the internet without requiring internal network access. Each finding includes the CVE identifier, Common Vulnerability Scoring System (CVSS) severity score, and affected asset count. You prioritize high-severity CVEs that affect multiple assets first, since remediating one vulnerability across 10 hosts yields more risk reduction than addressing a medium-severity issue on a single system.
The open ports and services section identifies exposed ports across your internet-facing hosts and surfaces risky services. Telnet (port 23), FTP (port 21), Remote Desktop Protocol (port 3389), and SMB (port 445) are all considered high-risk when exposed to the internet. For Contoso, recently acquired partner infrastructure, this analysis is critical. Older environments can have services exposed that would never pass security review in the main Azure environment. Legacy systems often accumulate technical debt, and external discovery reveals configurations that internal scans might miss if those systems weren't properly inventoried.
The SSL certificate configuration section flags multiple security hygiene issues. Expired certificates appear here, along with certificates using weak cipher suites or deprecated signature algorithms like SHA-1 and MD5. Self-signed certificates on production hosts also generate findings—while appropriate for development, they undermine trust and encryption validation in production environments.
Domain administration findings focus on expiring domain registrations and misconfigured DNS records. An expired domain can be re-registered by an attacker, who could then use it for phishing campaigns that appear to come from your organization. For Contoso, the post-acquisition dashboard review reveals three critical findings: two hosts running Telnet from the acquired company's legacy infrastructure, 14 SSL certificates expiring within the next 30 days, and one domain registration expiring in 45 days—all on assets the team didn't know existed before EASM discovery.
Find web application vulnerabilities with OWASP Top 10
The Open Web Application Security Project (OWASP) Top 10 dashboard evaluates your internet-facing pages and hosts against the most critical web application security risks. These categories represent the most common and impactful vulnerabilities that attackers exploit in web applications.
Broken access control findings identify public-facing pages that expose administrative functionality or allow unauthorized actions. Cryptographic failures include unencrypted data transmission, weak cipher suites, and improper certificate validation. Injection vulnerabilities appear when input fields are vulnerable to SQL injection, command injection, or other code execution attacks. Security misconfiguration findings flag default credentials, exposed configuration files, debug modes active in production, and enabled features.
The outdated components category identifies pages using vulnerable JavaScript libraries or frameworks. A common example appears when sites run outdated JavaScript libraries—such as older versions of jQuery or similar widely used frameworks—that have CVEs. These library vulnerabilities persist because web development teams can’t track their client-side dependencies as rigorously as server-side code. For Contoso, this dashboard becomes especially valuable for evaluating the acquired company's web applications, which likely lack the same security hardening as Contoso's main properties.
Note
EASM evaluates OWASP risks from an external perspective. It observes what's publicly accessible and detectable without authentication. Unlike penetration testing, it doesn't perform authenticated testing or attempt exploitation.
Apply inventory filters to investigate findings
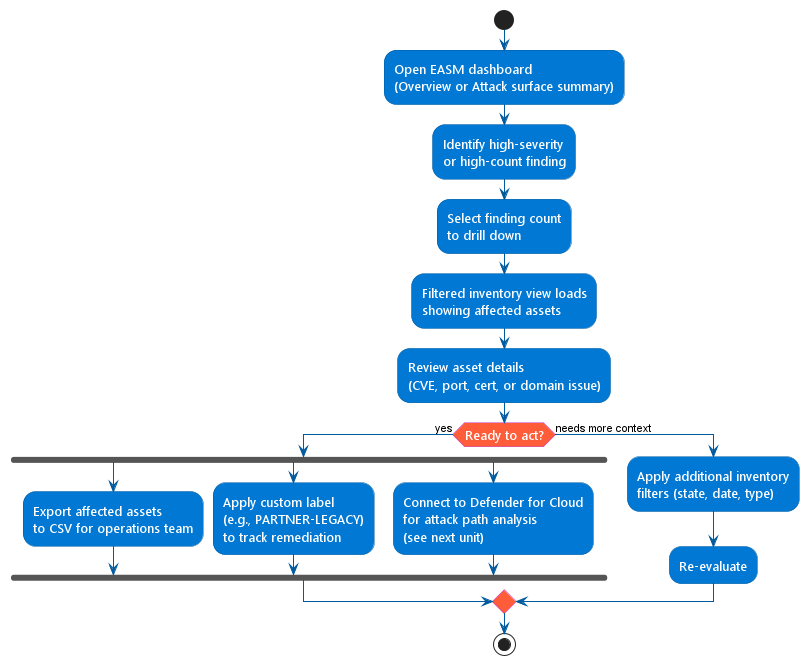
Every dashboard insight links directly to filtered inventory views. When you see a concerning finding—such as 14 hosts with expiring SSL certificates—you select that count to view the specific affected assets. The inventory view loads with filters already applied, showing you exactly which hosts need attention.
You can combine multiple filters to narrow your focus. Filter by asset state (Approved Inventory, Candidate, Requires Investigation), severity level, asset type, or discovery date range. For Contoso's scenario, filtering by discovery date helps distinguish between long-standing assets and assets discovered through the acquisition integration. You can also apply custom labels to group assets for tracking purposes. Labeling all acquired partner assets as "PARTNER-LEGACY" creates a persistent tag that helps you track remediation progress across that specific infrastructure subset.
The combination of dashboard insights and inventory filtering creates a workflow: identify the highest-priority risk category in a dashboard, drill into the specific affected assets through the filtered inventory, investigate the context of each asset, and create remediation tasks for your operations teams. This systematic approach prevents the paralysis that comes from facing thousands of undifferentiated assets.