Advanced analysis, visualization, and the Analyst agent
When your data is ready for analysis, the next step is choosing the right tool for the question you're trying to answer.
Highlighting an outlier is a very different task than building a six-month revenue forecast or comparing performance across multiple regional files. Copilot in Excel supports each of these scenarios, but the approach you take matters.
This unit introduces the core analysis and visualization capabilities in Excel, shows how Python supports more advanced analysis, and explains how the Analyst agent fits into a multi-file workflow.
Choose the right analytical approach
Copilot in Excel supports several capabilities that work at different levels of complexity. When you open the Copilot pane, you can choose from three modes — Chat only, Plan, and Allow editing — giving you control over how much Copilot changes your workbook. As a general guideline:
- Copilot in Excel is best for analyzing data already in your workbook. Use it for insights, charts, formulas, PivotTables, and summaries.
- Allow editing mode is best for multi-step workbook creation or restructuring. Use it when you want to build or modify a workbook through a single conversational workflow.
- Copilot in Excel with Python is best for advanced analysis, such as forecasting, regression, statistical modeling, or specialized visualizations.
- The Analyst agent is best when your data spans multiple files that aren't yet brought into Excel. Use it to explore and compare datasets before building your workbook.
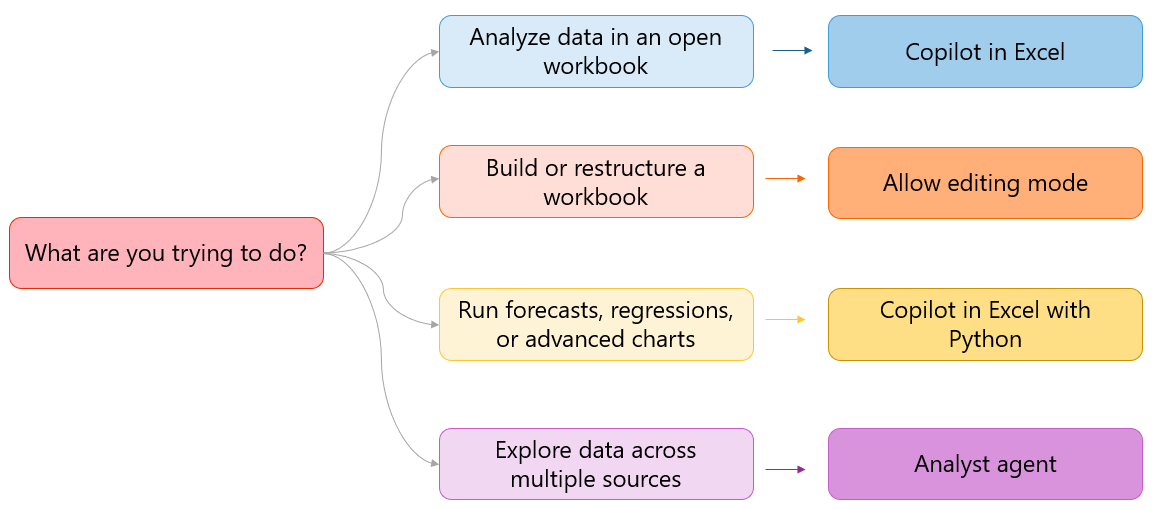
Think of this as a progression:
- Start by exploring and comparing data (Analyst agent, if needed)
- Bring data into Excel and analyze or shape it (Copilot — choose the mode that fits your task)
- Move to advanced modeling or forecasting (Python)
Build and restructure workbooks with Allow editing mode
Allow editing mode lets you complete multi-step tasks in a single workflow. Instead of issuing one command at a time, you describe the outcome you want, and Copilot carries out the steps. Use Allow editing mode when you need to:
- Create a new workbook from scratch
- Restructure or clean an existing dataset
- Apply formulas, formatting, and visuals together
To start, open the Copilot pane in Excel. Select the mode dropdown at the top of the pane and choose Allow editing. Then describe the outcome you want and Copilot carries out the steps.
If you want to review Copilot's approach before it makes any changes, select Plan mode instead. Copilot generates a structured plan for you to confirm before it acts.
Representative prompts:
- Build an expense tracking template with columns for date, category, amount, and notes, then add a formula that calculates the running total.
- Create a quarterly performance summary table from this data and apply conditional formatting to flag values below 80% of target.
- Add a monthly trend chart to this workbook and format the table with alternating row colors.
Note
Allow editing mode is best for multi-step workflows. For analysis without modifying your workbook, switch to Chat only mode, which provides answers and insights while leaving your workbook unchanged.
Retrieve insights and summarize text
When you ask a specific question, Copilot interprets it in the context of your data and returns a direct answer, often with a chart or summary you can insert into your workbook.
Representative prompts:
- Which product sold the most in California?
- What were the top three states for total sales in Q1?
- Which regions had the highest variance between actual and forecasted revenue?
Copilot also works well with text-based data such as customer feedback, survey responses, or support tickets. Try prompts such as:
- Identify the top five themes in this feedback column
- Summarize each support ticket in two bullet points
- Categorize each URL in column B by website type
Be specific about the format you want in your response to get more useful output.
Generate formulas and reusable functions
Instead of writing formulas manually, describe the calculation you need. Copilot suggests the formula and explains how it works before you apply it. Use prompts like:
- Add a column showing the percentage difference between Q2 and Q3 revenue.
- Calculate the number of days between the order date and the ship date.
- Add a row that sums total sales for each product category.
You can select Show explanation to review the logic, then Insert column to apply it.
For repeated use, Copilot can also create custom functions:
- Create a custom function to calculate IRR across these investment projects.
- Build a function that calculates the weighted average of sales across regions.
Create and refine PivotTables
PivotTables let you summarize and reorganize large datasets without writing formulas. Describe the structure you want, and Copilot creates it for you. Enter prompts such as:
- Create a PivotTable that summarizes sales by product and region.
- Show total sales by month and category.
- Summarize this data by Report Date.
Once created, you can refine the layout using the PivotTable Fields pane or follow up with additional prompts.
Perform advanced analysis with Python
When your analysis requires more statistical depth, Copilot in Excel with Python lets you describe the problem in plain language. Copilot generates and runs the Python code for you and returns the results directly in your workbook.
Use Python when you need to:
- Forecast future values
- Analyze relationships between variables
- Run what-if scenarios
- Create advanced visualizations
Representative prompts:
- Forecast monthly revenue for the next six months based on this year's trend.
- Run a regression to show the relationship between marketing spend and lead volume.
- Show how a 15% increase in unit costs would affect net margin across these product lines.
- Create a heatmap showing sales performance by region and month.
For complex, multi-step analytical questions, select Think Deeper before submitting your prompt. Think Deeper instructs Copilot to generate a detailed analysis plan first, then execute it. This approach is useful when the question involves multiple variables or requires a sequence of calculations.
Note
Python in Excel is best for advanced scenarios. If your question can be answered with standard charts, formulas, or PivotTables, those approaches are usually faster and easier to interpret.
Analyze data across files with the Analyst agent
When your data lives across multiple files, such as quarterly reports from different regions, exports from different systems, or datasets maintained by separate teams, the Analyst agent helps you explore and compare those datasets before bringing them into Excel.
Use the Analyst agent to:
- Compare multiple reports or datasets
- Identify trends or outliers across files
- Determine which data should be combined or prioritized
To get started, open the Microsoft 365 Copilot app and locate the Analyst agent. Attach the files you want to analyze, then ask your question.
Representative prompts:
- Compare sales performance across these regional files and identify the highest Q2 growth
- Identify top-performing products across these datasets based on engagement metrics
- Summarize outliers across these monthly reports and flag anything that needs review
This workflow connects directly to Excel:
- Use the Analyst agent to explore and prioritize across files
- Then use Excel to build detailed analysis, models, and visualizations
Note
The Analyst agent is available to Microsoft 365 Copilot licensed users. Availability and configuration may vary by organization.