Troubleshoot Code Optimizations
This article provides troubleshooting steps and information to use Application Insights Code Optimizations for Microsoft Azure.
Troubleshooting checklist
Step 1: View a video about Code Optimizations setup
View the following demonstration video to learn how to set up Code Optimizations correctly.
Step 2: Make sure that your app is connected to an Application Insights resource
Create an Application Insights resource and verify that it's connected to the correct app.
Step 3: Verify that .NET Profiler is enabled
Step 4: Verify that .NET Profiler is collecting profiles
To make sure that profiles are uploaded to your Application Insights resource, follow these steps:
In the Azure portal, search for and select Application Insights.
In the list of Application Insights resources, select the name of your resource.
In the navigation pane of your Application Insights resource, locate the Investigate heading, and then select Performance.
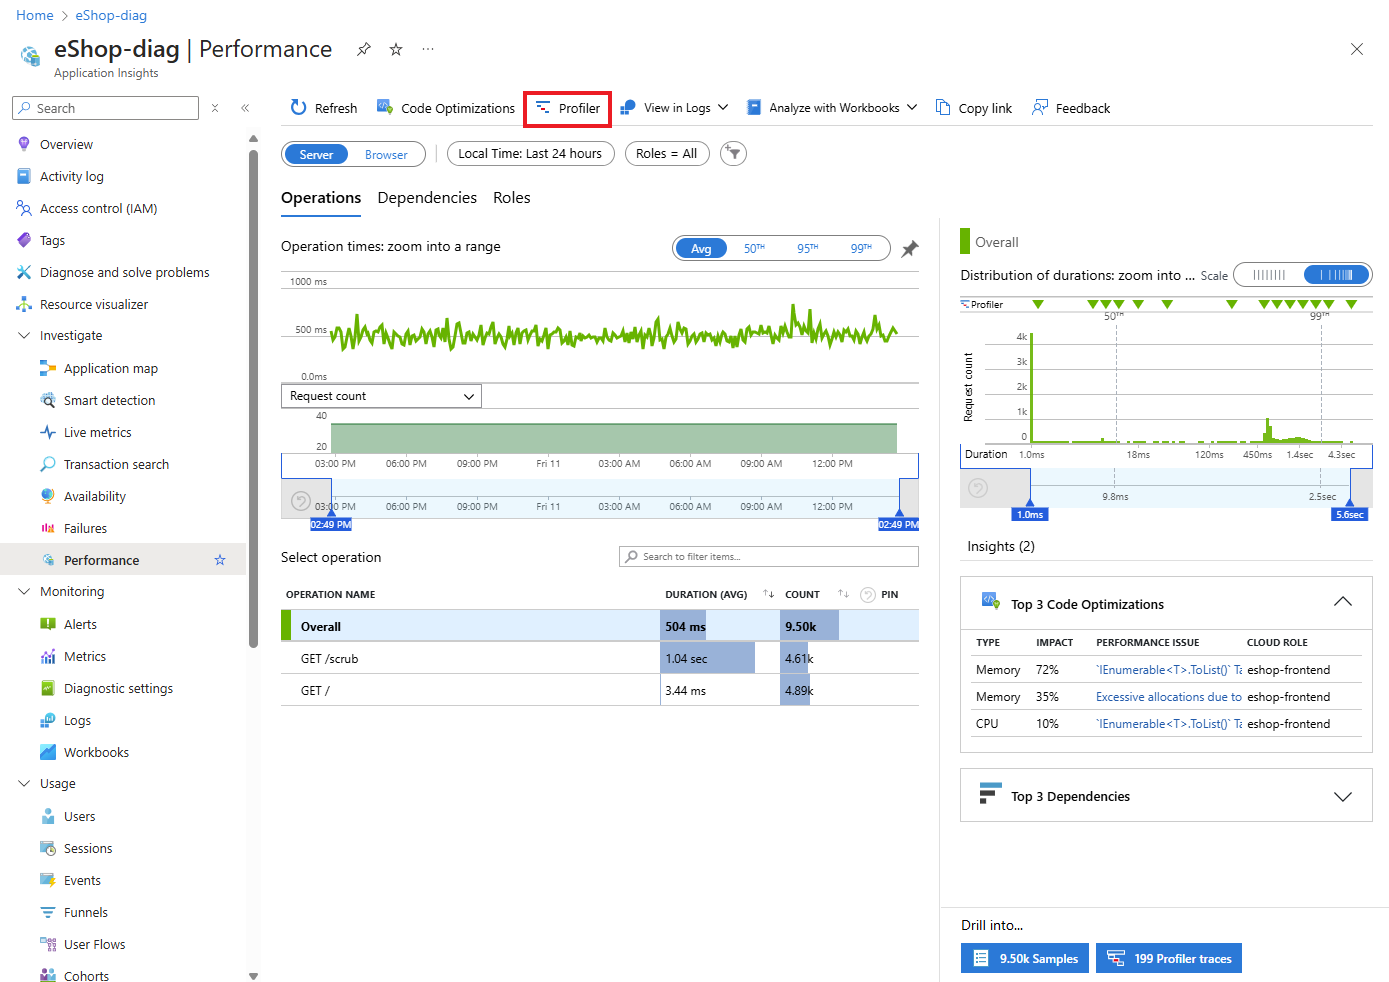
On the Performance page of your Application Insights resource, select Profiler:

On the Profiler page, view the Recent profiling sessions section.
Note
If you don't see any profiling sessions, see Troubleshoot Application Insights Profiler.
Step 5: Regularly check the Profiler
After you successfully complete the previous steps, keep checking the Profiler page for insights. Meanwhile, the service continues to analyze your profiles and provide insights as soon as it detects any issues in your code. After you enable the .NET Profiler, several hours might be required for you to generate profiles and for the service to analyze them. If the service detects no issues in your code, a message appears that confirms that no insights were found.
Contact us for help
If you have questions or need help, create a support request, or ask Azure community support. You can also submit product feedback to Azure feedback community.
