Note
Access to this page requires authorization. You can try signing in or changing directories.
Access to this page requires authorization. You can try changing directories.
Use the drill down analytics features in Copilot Studio to gain deeper insights into user interactions with your agent. You can explore individual user questions to understand response quality, identify knowledge gaps, and see how users reacted to agent responses. You can also drill down into conversation sessions to examine detailed session data, track conversation outcomes, and analyze performance across channels. As well as analyze users responses to your agent. These detailed views help you understand the underlying factors driving your agent's key metrics and pinpoint areas for improvement.
Drill down to a list of user questions
Drill down to view specific questions that contributed to a metric and the supporting context, such as how the agent responded, how users reacted, and which knowledge sources were involved. This view provides better insight into response quality and helps identify possible gaps in knowledge coverage.
Important
You need a Bot Transcript Viewer security role to view the list and its metrics. Only admins can grant this role by assigning the Bot Transcript Viewer security role during agent sharing.
To enable this security role in your single or group environment see How to configure transcript settings.
Drilling down to list of questions is currently supported for the following metric panels: Generated answer rate and quality and Knowledge source use.
To drill down to the list of questions window:
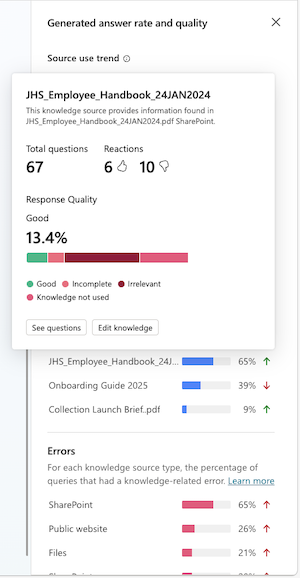
- From the Generated answer rate and quality panel, select See questions.
- From the Generated answer rate and quality panel, hover over and select the Good or Poor answer bar segment.
- From the Generated answer rate and quality panel, select the 'Answered' or 'Unanswered' questions percentage metric.
- From the Knowledge source use panel, click on any of the listed sources or select See all to open a page of all knowledge source used by the agent and select the desired source.
The user questions list is filtered based on the data point you drilled down on. This is reflected in the default filter settings above the question list. For instance, choosing the Irrelevant bar segment of the Poor bar in the Quality of generated answers tile sets the Response quality filter to Irrelevant for the listed questions.
If desired, you can perform the following actions on the list page:
- Apply more filtering to narrow down the list of questions further using the list's dimensional filters.
- Evaluate the listed questions according to criteria you define in the evaluation's test method.
- Download the listed questions as a .csv file.
- See detailed information specific to an individual question.
The list of questions window displays the following:
| Column | Description |
|---|---|
| Question | The question asked. |
| Answered | The status of the generative AI response: Answered or Unanswered. |
| Response quality | Response quality for sampled questions. Possible values are Poor and Good. |
| Reaction | Thumbs up, thumbs down, or no reaction, with an optional text-based comment. |
| Date | Date when the question was answered. |
| Knowledge source | List of knowledge sources cited in the agent response. |
For further information, select Show details on any question to open the question details side panel. This panel provides additional insights into the response quality associated with each question.
| Detailed question-level parameter | Description |
|---|---|
| Time stamp | Time stamp of the most recent instance of when the question was answered. |
| User query | The question asked. |
| Response | The generative AI response. |
| Thumbs up / Thumbs down value | Value for the most recent instance of this question for the Thumbs up / Thumbs down parameter. |
| Comment | Optional extra text-based comment, provided by the user, in addition to the Thumbs up / Thumbs down reaction. |
| Response quality1 | Response to the question of what the quality of response to the user query was. Possible values are Poor and Good. |
| Reason2 | In the case where the response quality is Poor, this parameter explains why. |
1 Response quality isn't always available and shows up only if the question was sampled for quality analysis.
2 If the Response quality is Good or if the question wasn't sampled, the Reason parameter isn't assigned any value.
Drill down to sessions
Drill down to sessions to view the specific sessions that contributed to a metric and examine the underlying session data. This deeper view helps you understand the why and how behind top-level agent metrics and enables you to identify and investigate potential issues.
Use the sessions list to analyze agent performance and investigate by examining the session-level data that lead to a session outcome (resolved, escalated, abandoned, or unengaged). For example, filter by channel, focus on low CSAT sessions, and then drill into session data to gain insight into why customers in those channels might be having a poor experience.
To drill down to the session list window:
- From the Conversation outcomes panel, select See sessions to view all sessions for the analytic period.
- From the Conversation outcomes panel, select See details. This opens a side pane of further metrics on conversation session outcomes. Select on any highlighted metric plot to view a filter list of sessions.
The session list is filtered based on the data point you drilled down on. This is reflected in the default filter settings above the session list. For instance, within the Conversation outcomes side pane, choosing the Resolved confirmed bar segment of the Resolved outcomes reasons bar tile sets the session outcome and outcome reason to resolved and resolved confirmed, respectively.
If desired, you can apply more filtering on the *Sessions list page to narrow down the list of sessions further using the list's dimensional filters. Clicking on any of the sessions will bring up the session transcript pane.
Note
To view sessions, you must have the Bot Transcript Viewer security role.
Session’s list is updated daily and shows up to 10,000 sessions per day. Only the last 28 days of sessions are stored and available to be viewed.
The list of session window is sorted by the following parameters:
| Detailed session-level parameter | Description |
|---|---|
| Start time | Timestamp of when the session was invoked. |
| Duration | Length of the conversation with the agent, shown in minutes and seconds. |
| Messages | Number of messages exchanged between the user and the agent. |
| Outcome | Result of the agent conversation. Possible values are Resolved, Escalated, Abandoned, or Unengaged. |
| Outcome reason | Additional context explaining why the session outcome occurred (for example, System error or Resolved implied). |
| Channel | The channel where the conversation took place, such as Teams, Microsoft 365 Copilot, and SharePoint. |
| CSAT | Customer satisfaction (CSAT) rating for the session, based on user feedback, if available. |

Analyze user feedback and satisfaction
Beyond the high level metrics, user feedback provides direct insight into how users perceive your agent's responses through reactions, comments, survey results, and sentiment analysis. By drilling down into user comments and reactions, you can understand what users liked or disliked about specific agent responses, identify trends in user satisfaction, and uncover specific areas where your agent excels or needs improvement. This is helpful for understanding user sentiment and continuously refining your agent's performance.
Drill down to comments
After a user provides a reaction, they can leave a comment. On the Analytics page, to drill down to user comments, select the Comments icon ![]() on the Reactions tile.
on the Reactions tile.
If desired, you can perform the following actions on the Comments list page:
- Apply more filtering to narrow down the list of user comments further using the list's dimensional filters.
- Evaluate the listed comments according to criteria you define in the evaluation's test method.
- See detailed information specific to an individual comment.
Drill down to reactions
To drill down to the list of agent responses contributing to an individual user reaction, on the Reactions pie chart, select one of the Thumbs up or Thumbs down pie segments. By default, the list of agent responses (the Reactions list) is filtered based on the user reaction you drilled down on.
If desired, you can perform the following actions on the Reactions list page:
- Apply more filtering to narrow down the list of agent responses further using the list's dimensional filters.
- Evaluate the listed agent responses according to criteria you define in the evaluation's test method.
- See detailed information specific to an individual agent response.