Note
Access to this page requires authorization. You can try signing in or changing directories.
Access to this page requires authorization. You can try changing directories.
Sometimes the data you’re analyzing doesn’t contain a particular field that you need to get your desired results. Calculated columns are useful for this situation. Calculated columns use Data Analysis Expressions (DAX) formulas to define a column’s values. This tool is useful for anything from putting together text values from a couple of different columns to calculating a numeric value from other values. For example, let’s say your data has City and State fields, but you want a single Location field that has both, like "Miami, FL".
Calculated columns are similar to measures in that both are based on DAX formulas, but they differ in how they're used. You often use measures in a visualization's Values area, to calculate results based on other fields. You use calculated columns as new Fields in the rows, axes, legends, and group areas of visualizations.
This tutorial guides you through understanding and creating some calculated columns and using them in report visualizations in Power BI Desktop.
Prerequisites
This tutorial is intended for Power BI users already familiar with using Power BI Desktop to create more advanced models. You should already know how to use Get Data and the Power Query Editor to import data, work with multiple related tables, and add fields to the Report canvas. If you’re new to Power BI Desktop, be sure to check out Getting Started with Power BI Desktop.
The tutorial uses the Contoso Sales Sample for Power BI Desktop, the same sample used for the Create your own measures in Power BI Desktop tutorial. This sales data from the fictitious company Contoso, Inc. was imported from a database. You won’t be able to connect to the data source or view it in the Power Query Editor. Download and extract the file on your own computer, and then open it in Power BI Desktop.
Create a calculated column with values from related tables
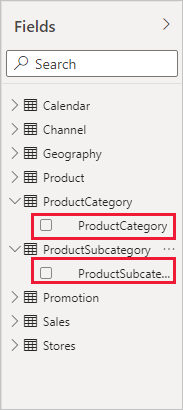
In your Sales Report, you want to display product categories and subcategories as single values, like "Cell phones – Accessories", "Cell phones – Smartphones & PDAs", and so on. There's no field in the Fields list that gives you that data, but there's a ProductCategory field and a ProductSubcategory field, each in its own table. You can create a calculated column that combines values from these two columns. DAX formulas can use the full power of the model you already have, including relationships between different tables that already exist.
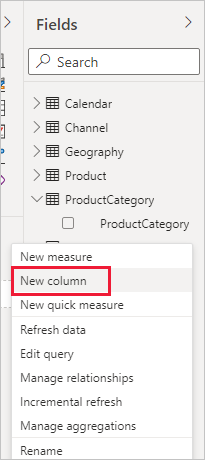
To create your new column in the ProductSubcategory table, right-click or select the ellipsis ... next to ProductSubcategory in the Fields pane, and choose New column from the menu.
When you choose New column, the Formula bar appears along the top of the Report canvas, ready for you to name your column and enter a DAX formula.
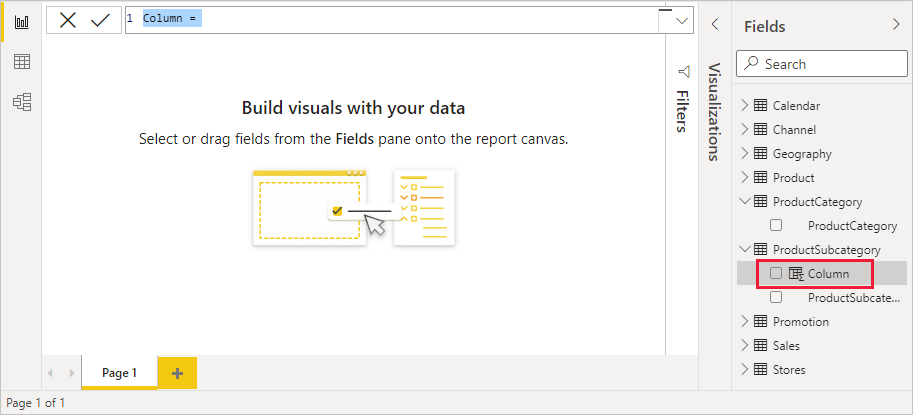
By default, a new calculated column is named Column. If you don’t rename it, new columns are named Column 2, Column 3, and so on. You want your column to be more identifiable, so while the Column name is already highlighted in the formula bar, rename it by typing ProductFullCategory, and then type an equal (=) sign.
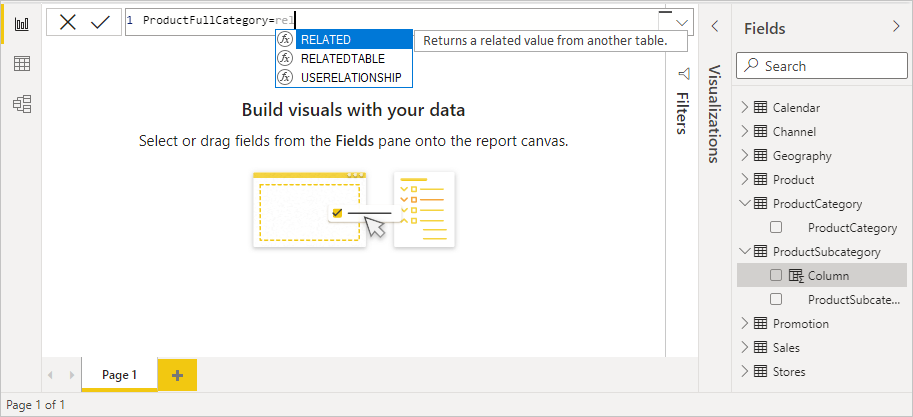
You want the values in your new column to start with the name in the ProductCategory field. Because this column is in a different but related table, you can use the RELATED function to help you get it.
After the equal sign, type r. A dropdown suggestion list shows all of the DAX functions beginning with the letter R. Selecting each function shows a description of its effect. As you type, the suggestion list scales closer to the function you need. Select RELATED, and then press Enter.
An opening parenthesis appears, along with another suggestion list of the related columns you can pass to the RELATED function, with descriptions and details of expected parameters.
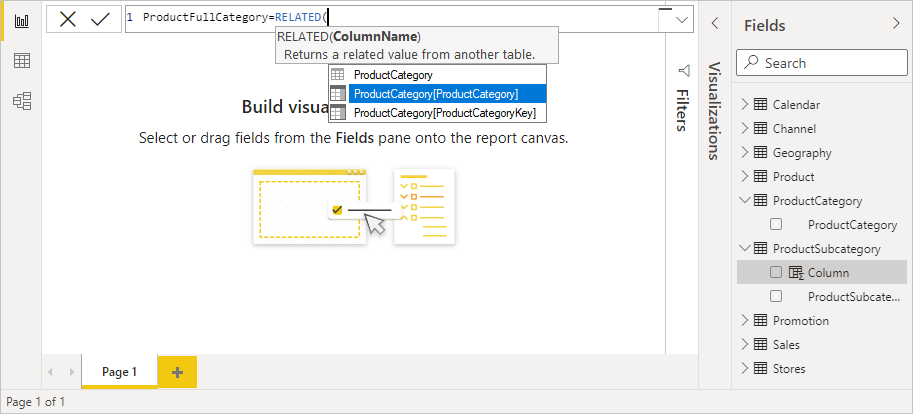
You want the ProductCategory column from the ProductCategory table. Select ProductCategory[ProductCategory], press Enter, and then type a closing parenthesis.
Tip
Syntax errors are most often caused by a missing or misplaced closing parenthesis, although sometimes Power BI Desktop adds it for you.
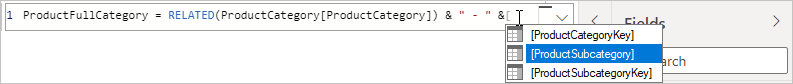
You want dashes and spaces to separate the ProductCategories and ProductSubcategories in the new values, so after the closing parenthesis of the first expression, type a space, ampersand (&), double-quote ("), space, dash (-), another space, another double-quote, and another ampersand. Your formula should now look like this:
ProductFullCategory = RELATED(ProductCategory[ProductCategory]) & " - " &Tip
If you need more room, select the down chevron on the right side of the formula bar to expand the formula editor. In the editor, press Alt + Enter to move down a line, and Tab to move things over.
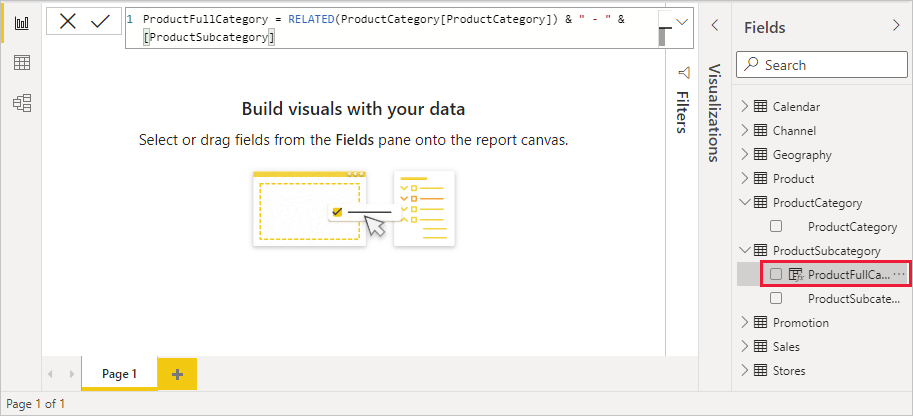
Enter an opening bracket ([), and then select the [ProductSubcategory] column to finish the formula.
You didn’t need to use another RELATED function to call the ProductSubcategory table in the second expression, because you're creating the calculated column in this table. You can enter [ProductSubcategory] with the table name prefix (fully qualified) or without (nonqualified).
Complete the formula by pressing Enter or selecting the checkmark in the formula bar. The formula validates, and the ProductFullCategory column name appears in the ProductSubcategory table in the Fields pane.
Note
In Power BI Desktop, calculated columns have a special icon in the Fields pane, showing that they contain formulas. In the Power BI service (your Power BI site), there’s no way to change formulas, so calculated columns don't have icons.
Use your new column in a report
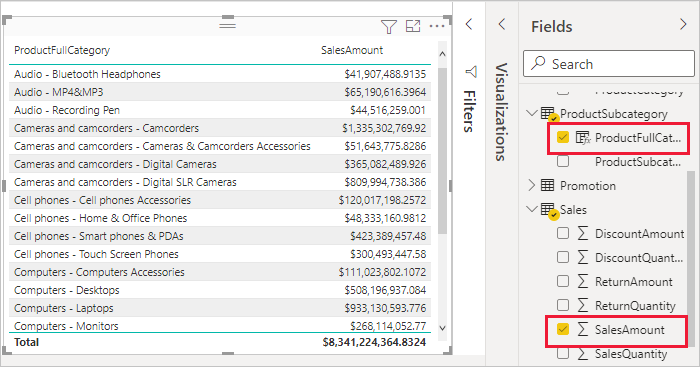
Now you can use your new ProductFullCategory column to look at SalesAmount by ProductFullCategory.
Select or drag the ProductFullCategory column from the ProductSubcategory table onto the Report canvas to create a table showing all of the ProductFullCategory names.
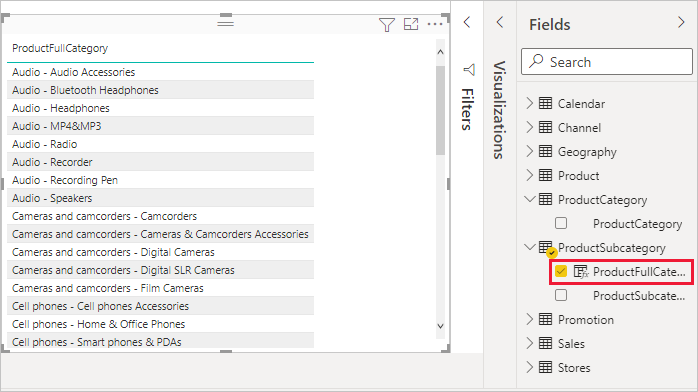
Select or drag the SalesAmount field from the Sales table into the table to show the SalesAmount for each ProductFullCategory.
Create a calculated column that uses an IF function
The Contoso Sales Sample contains sales data for both active and inactive stores. You want to ensure that active store sales are clearly separated from inactive store sales in your report by creating an Active StoreName field. In the new Active StoreName calculated column, you want each active store to appear with the store's full name, and the sales for inactive stores to be grouped together in one line item called Inactive.
Fortunately, the Stores table has a column named Status, with values of "On" for active stores and "Off" for inactive stores, which we can use to create values for our new Active StoreName column. Your DAX formula can use the logical IF function to test each store's Status and return a particular value depending on the result. If a store's Status is "On", the formula returns the store's name. If it’s "Off", the formula assigns an Active StoreName of "Inactive".
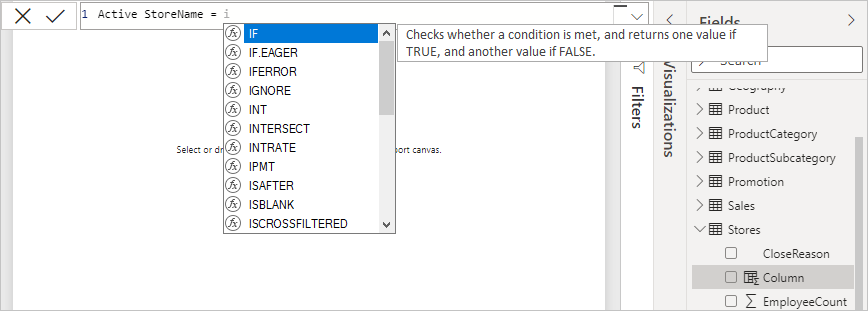
Create a new calculated column in the Stores table and name it Active StoreName in the formula bar.
After the = sign, begin typing IF. The suggestion list shows what you can add. Select IF.
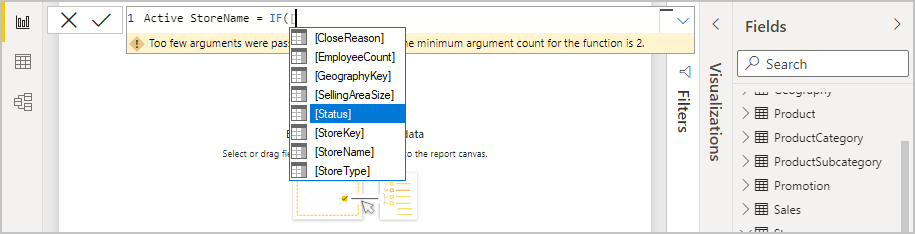
The first argument for IF is a logical test of whether a store's Status is "On". Type an opening bracket [, which lists columns from the Stores table, and select [Status].
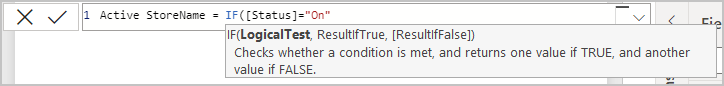
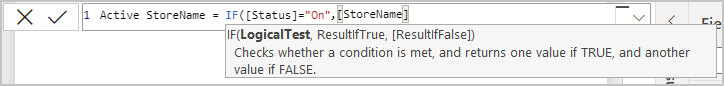
Right after [Status], type ="On", and then type a comma (,) to end the argument. The tooltip suggests that you now need to add a value to return when the result is TRUE.
If the store's status is "On", you want to show the store’s name. Type an opening bracket ([) and select the [StoreName] column, and then type another comma. The tooltip now indicates that you need to add a value to return when the result is FALSE.
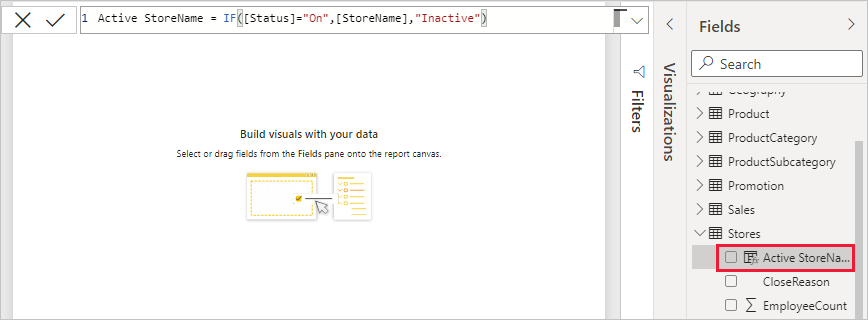
You want the value to be "Inactive", so type "Inactive", and then complete the formula by pressing Enter or selecting the checkmark in the formula bar. The formula validates, and the new column's name appears in the Stores table in the Fields pane.
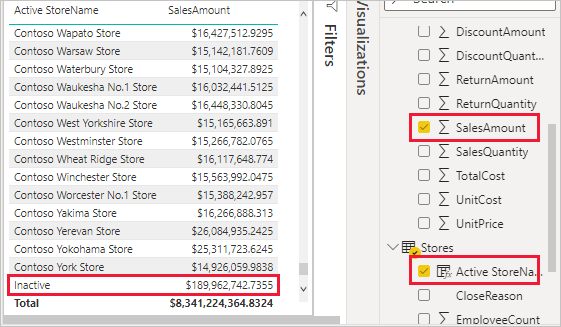
You can use your new Active StoreName column in visualizations just like any other field. To show SalesAmounts by Active StoreName, select the Active StoreName field or drag it onto the Report canvas, and then choose the SalesAmount field or drag it into the table. In this table, active stores appear individually by name, but inactive stores are grouped together at the end as Inactive.
What you've learned
Calculated columns can enrich your data and provide easier insights. You learned how to create calculated columns in the Fields pane and formula bar, use suggestion lists and tooltips to help construct your formulas, call DAX functions like RELATED and IF with the appropriate arguments, and use your calculated columns in report visualizations.
Related content
If you want to take a deeper dive into DAX formulas and create calculated columns with more advanced formulas, see DAX Basics in Power BI Desktop. This article focuses on fundamental concepts in DAX, such as syntax, functions, and a more thorough understanding of context.
Be sure to add the Data Analysis Expressions (DAX) Reference to your favorites. In this reference, you can find detailed info on DAX syntax, operators, and over 200 DAX functions.
Other articles of interest: