Sensitivity label insights about your data in Microsoft Purview
Article
This how-to guide describes how to access, view, and filter security insights provided by sensitivity labels applied to your data.
Supported data sources include: Azure Blob Storage, Azure Data Lake Storage (ADLS) GEN 1, Azure Data Lake Storage (ADLS) GEN 2, SQL Server, Azure SQL Database, Azure SQL Managed Instance, Amazon S3 buckets, Amazon RDS databases (public preview), Power BI
In this how-to guide, you'll learn how to:
Launch your Microsoft Purview account from Azure.
View sensitivity labeling insights on your data
Drill down for more sensitivity labeling details on your data
Prerequisites
Before getting started with Microsoft Purview Data Estate Insights, make sure that you've completed the following steps:
Set up your Azure resources and populated the relevant accounts with test data
Use Microsoft Purview Data Estate Insights for sensitivity labels
Classifications are similar to subject tags, and are used to mark and identify data of a specific type that's found within your data estate during scanning.
Sensitivity labels enable you to state how sensitive certain data is in your organization. For example, a specific project name might be highly confidential within your organization, while that same term is not confidential to other organizations.
Classifications are matched directly, such as a social security number, which has a classification of Social Security Number.
In contrast, sensitivity labels are applied when one or more classifications and conditions are found together. In this context, conditions refer to all the parameters that you can define for unstructured data, such as proximity to another classification, and % confidence.
Microsoft Purview Data Estate Insights uses the same classifications, also known as sensitive information types, as those used with Microsoft 365 apps and services. This enables you to extend your existing sensitivity labels to assets in the data map.
Note
After you have scanned your source types, give Sensitivity labeling Insights a couple of hours to reflect the new assets.
Select Sensitivity labels to display the Microsoft Purview Sensitivity labeling insights report.
Note
If this report is empty, you may not have extended your sensitivity labels to Microsoft Purview Data Map. For more information, see Labeling in the Microsoft Purview Data Map.
The main Sensitivity labeling insights page displays the following areas:
Area
Description
Overview of sources with sensitivity labels
Displays tiles that provide: - The number of subscriptions found in your data. - The number of unique sensitivity labels applied on your data - The number of sources with sensitivity labels applied - The number of files and tables found with sensitivity labels applied
Top sources with labeled data (last 30 days)
Shows the trend, over the past 30 days, of the number of sources with sensitivity labels applied.
Top labels applied across sources
Shows the top labels applied across all of your Microsoft Purview data resources.
Top labels applied on files
Shows the top sensitivity labels applied to files in your data.
Top labels applied on tables
Shows the top sensitivity labels applied to database tables in your data.
Labeling activity
Displays separate graphs for files and tables, each showing the number of files or tables labeled over the selected time frame. Default: 30 days Select the Time filter above the graphs to select a different time frame to display.
Sensitivity labeling insights drilldown
In any of the following Sensitivity labeling insights graphs, select the View more link to drill down for more details:
Top labels applied across sources
Top labels applied on files
Top labels applied on tables
Labeling activity > Labeled data
For example:
Do any of the following to learn more:
Option
Description
Filter your data
Use the filters above the grid to filter the data shown, including the label name, subscription name, or source type.
If you're not sure of the exact label name, you can enter part or all of the name in the Filter by keyword box.
Sort the grid
Select a column header to sort the grid by that column.
Edit columns
To display more or fewer columns in your grid, select Edit Columns
, and then select the columns you want to view or change the order.
Select a column header to sort the grid by that column.
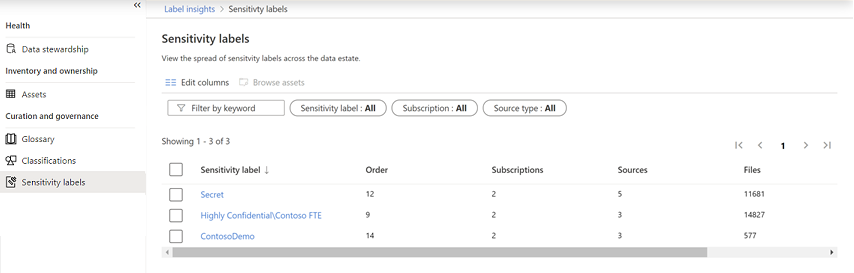
Drill down further
To drill down to a specific label, select a name in the Sensitivity label column to view the Label by source report.
This report displays data for the selected label, including the source name, source type, subscription ID, and the numbers of classified files and tables.
Browse assets
To browse through the assets found with a specific label or source, select one or more labels or sources, depending on the report you're viewing, and then select Browse assets
above the filters.
For sensitivity labels to be extended to your assets in the data map, you must actively turn on this capability in the Microsoft Purview compliance portal.
Microsoft Purview sensitivity labels enable you to classify and protect sensitive data throughout your organization, including in the cloud and on devices. This module covers how to classify and protect sensitive information to ensure its security and compliance.
 menu item. If you're using the
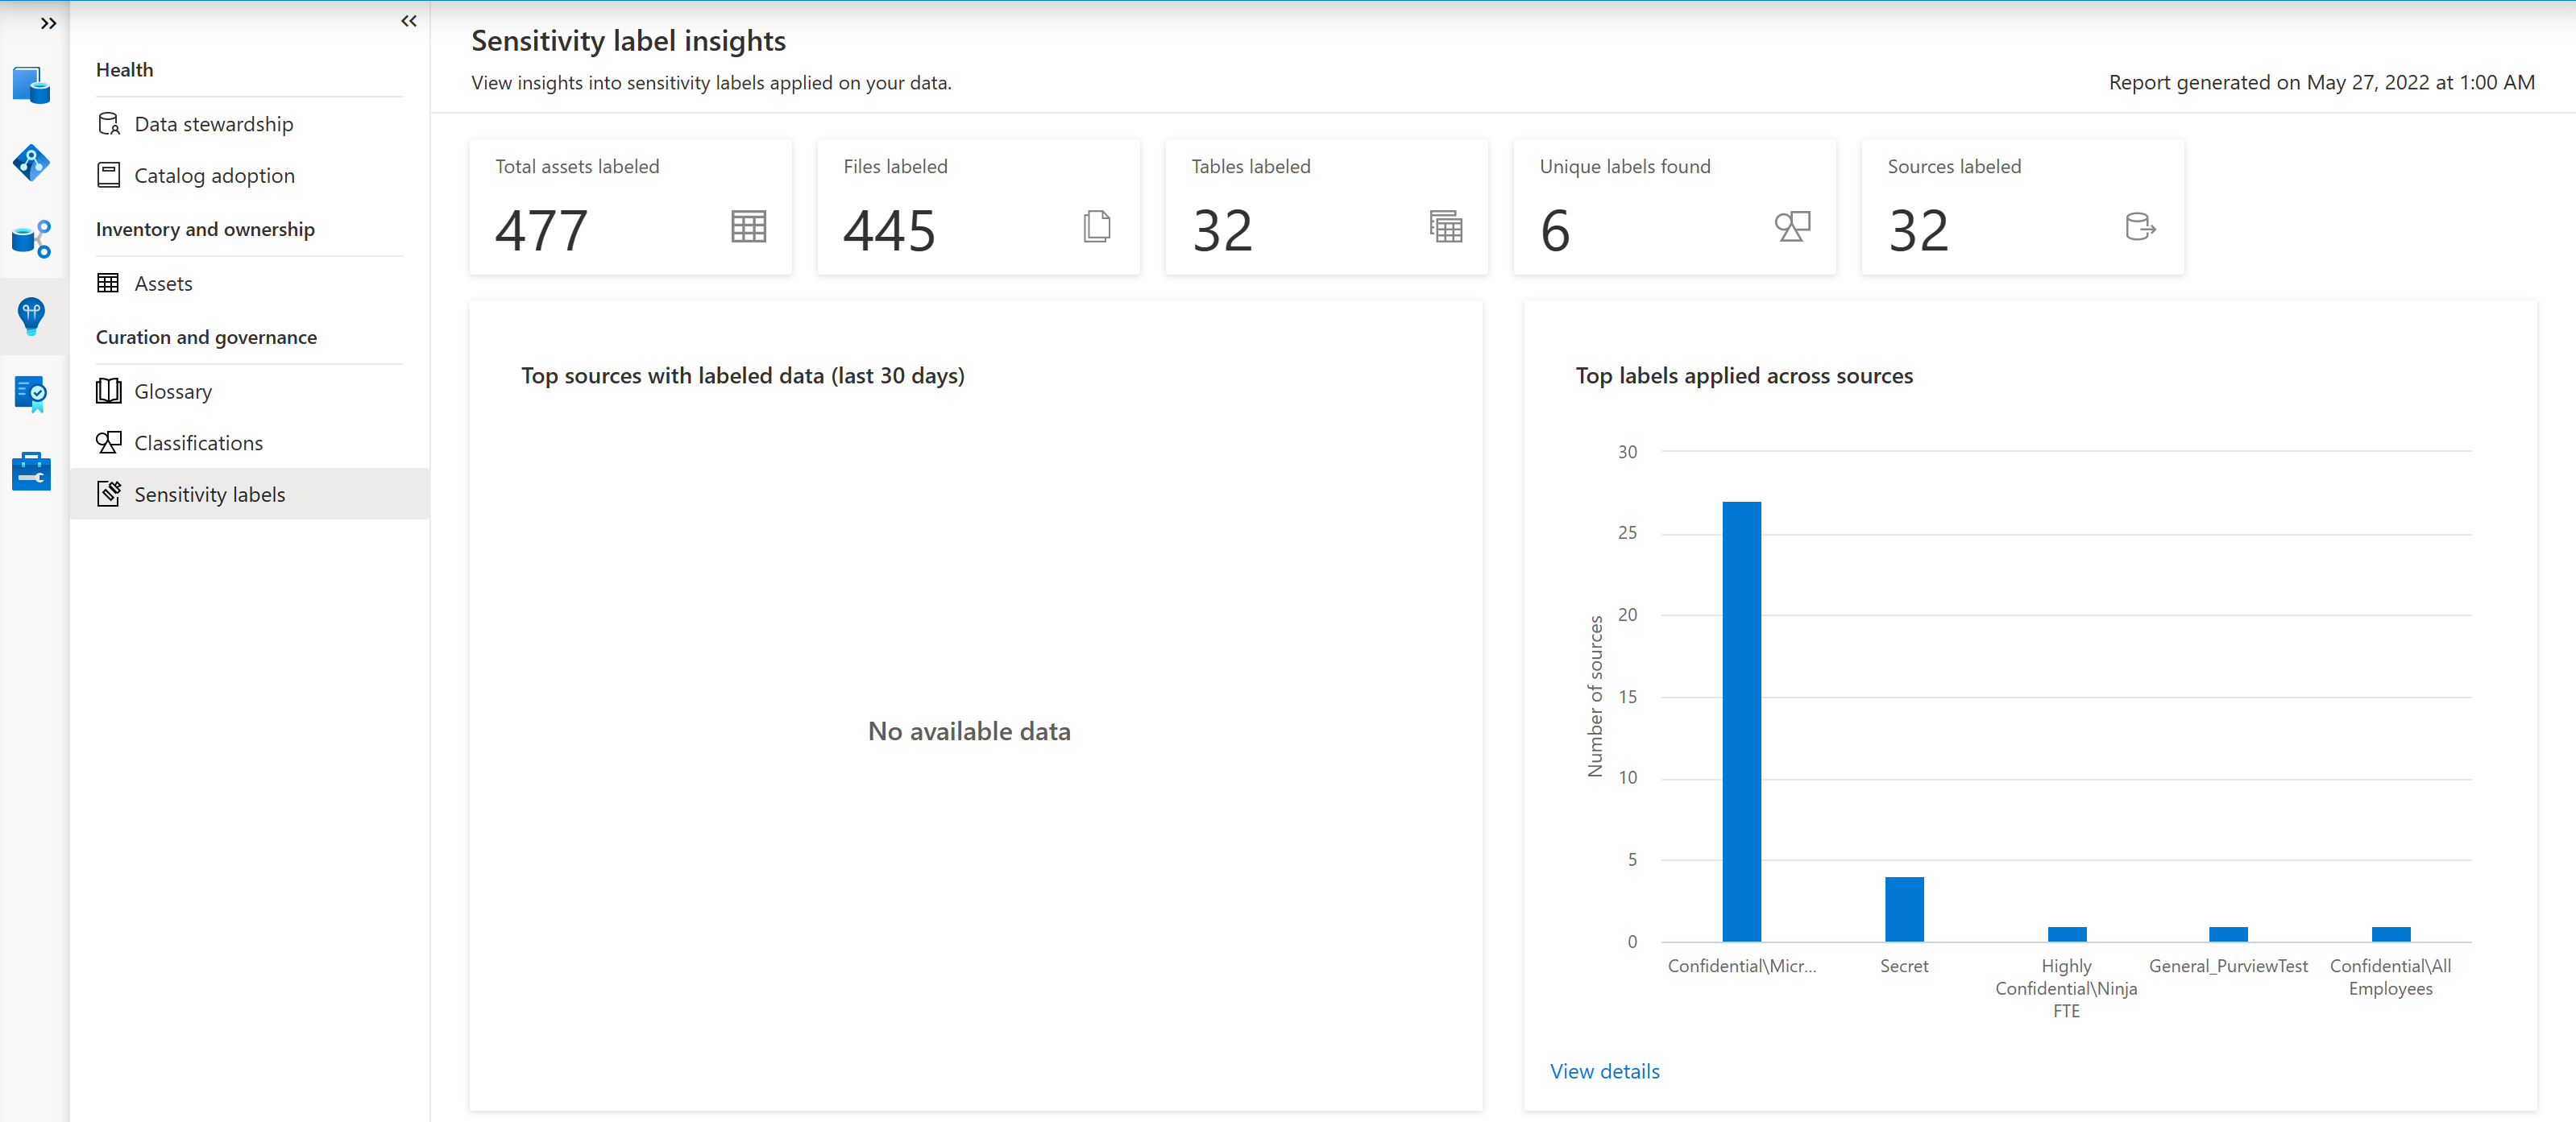
 , and then select the columns you want to view or change the order.
  above the filters.