Using Health Explorer in Operations Manager
Important
This version of Operations Manager has reached the end of support. We recommend you to upgrade to Operations Manager 2022.
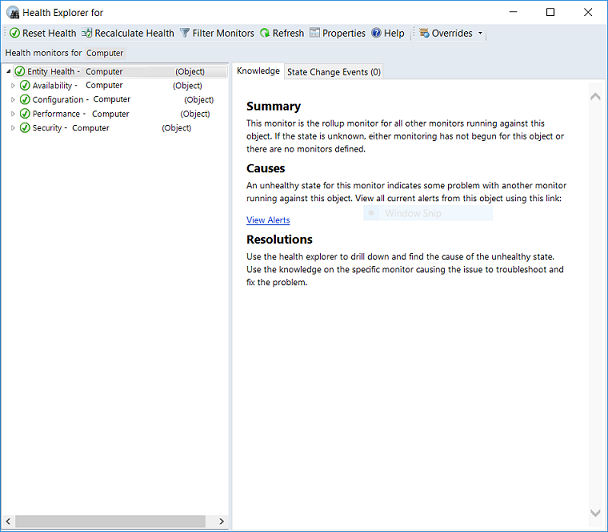
In System Center Operations Manager, you can use the Health Explorer tool to identify and diagnose failures with monitored objects. Health Explorer gives you the ability to view and then take action on alerts, state changes, and other significant issues generated by monitoring objects on your network.
You can start Health Explorer from the Tasks pane after you select an object, alert, or event in the results pane. Health Explorer organizes health information into the following categories:
Performance
Security
Availability
Configuration
All monitors that are defined for a selected object display in the appropriate category.
The icons used to indicate state are as follows:
| Icon | Meaning |
|---|---|
 |
Unknown, unmonitored (blank) |
 |
Success, health is OK (green) |
 |
Warning (yellow) |
 |
Critical (red) |
 |
Maintenance mode (gray) |
 |
Out of contact (gray) |
By default, when the Health Explorer windows first opens, all the monitors that are in a failed or red state are expanded. If a monitor contains other monitors, as in the case of a roll-up monitor, all monitors are shown in a hierarchical layout so that monitoring data for all dependent services and applications is displayed. If you want to view more details on any dependent monitor, right-click that monitor and then select Monitor Properties to open another Health Explorer window.
When the Health Explorer window is open, you can review a history of diagnostic tests that have run automatically and the output from those tasks. You can also run additional diagnostic tasks. Any task that's formatted as a hyperlink can run directly from the Knowledge tab.
The Health Explorer window refreshes automatically every 30 seconds. Press the F5 function key for an immediate refresh.
For more information on using Health Explorer, see Using Health Explorer to Investigate Problems.
Next steps
- In the Operations console, you view monitoring data, manage monitoring configuration, create your own custom views and dashboards that are personalized for your experience, and perform management group administration by Using the Operations Manager Operations console.
Feedback
Coming soon: Throughout 2024 we will be phasing out GitHub Issues as the feedback mechanism for content and replacing it with a new feedback system. For more information see: https://aka.ms/ContentUserFeedback.
Submit and view feedback for