Note
Access to this page requires authorization. You can try signing in or changing directories.
Access to this page requires authorization. You can try changing directories.
This guide shows how to enable Azure Monitor Application Insights for Azure Kubernetes Service (AKS) workloads without modifying source code.
It covers preparing a cluster, onboarding deployments, and restarting deployments. These steps autoinstrument the application pods by injecting the Azure Monitor OpenTelemetry Distro to generate telemetry. For more information about autoinstrumentation and its benefits, see What is autoinstrumentation for Azure Monitor Application Insights?
Prerequisites
- An AKS cluster running a Kubernetes deployment that uses Java or Node.js in the Azure public cloud
- A workspace-based Application Insights resource.
- Azure CLI 2.60.0 or greater. For more information, see How to install the Azure CLI, What version of the Azure CLI is installed?, and How to update the Azure CLI.
Warning
This feature supports Linux node pools only. Windows node pools aren't supported.
Prepare a cluster
You can prepare a cluster by using either the Azure portal or Azure CLI.
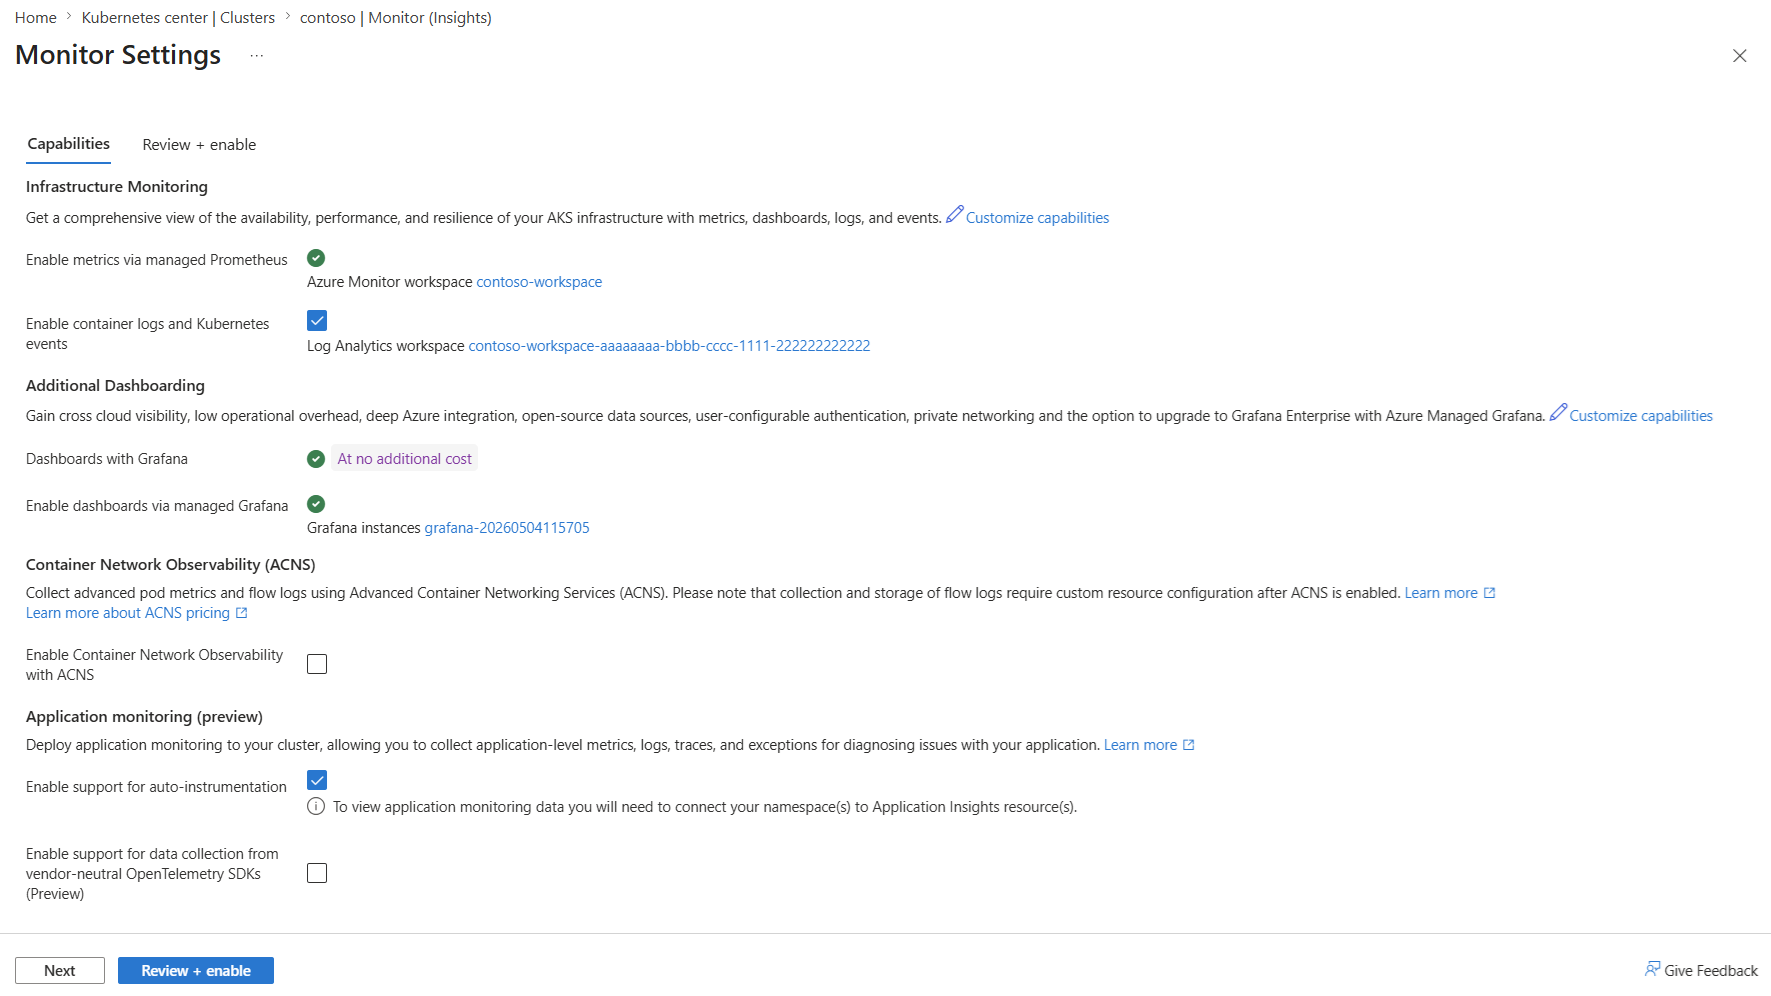
Use the Azure portal to prepare a cluster.
- Select the Monitor pane.
- Check the Enable support for auto-instrumentation box.
- Select Review + enable.

Onboard deployments
You can onboard deployments in two ways: namespace-wide or per-deployment. Use the namespace-wide method to onboard all deployments within a namespace. For selective or variably configured onboarding across multiple deployments, use the per-deployment approach.
Namespace-wide onboarding
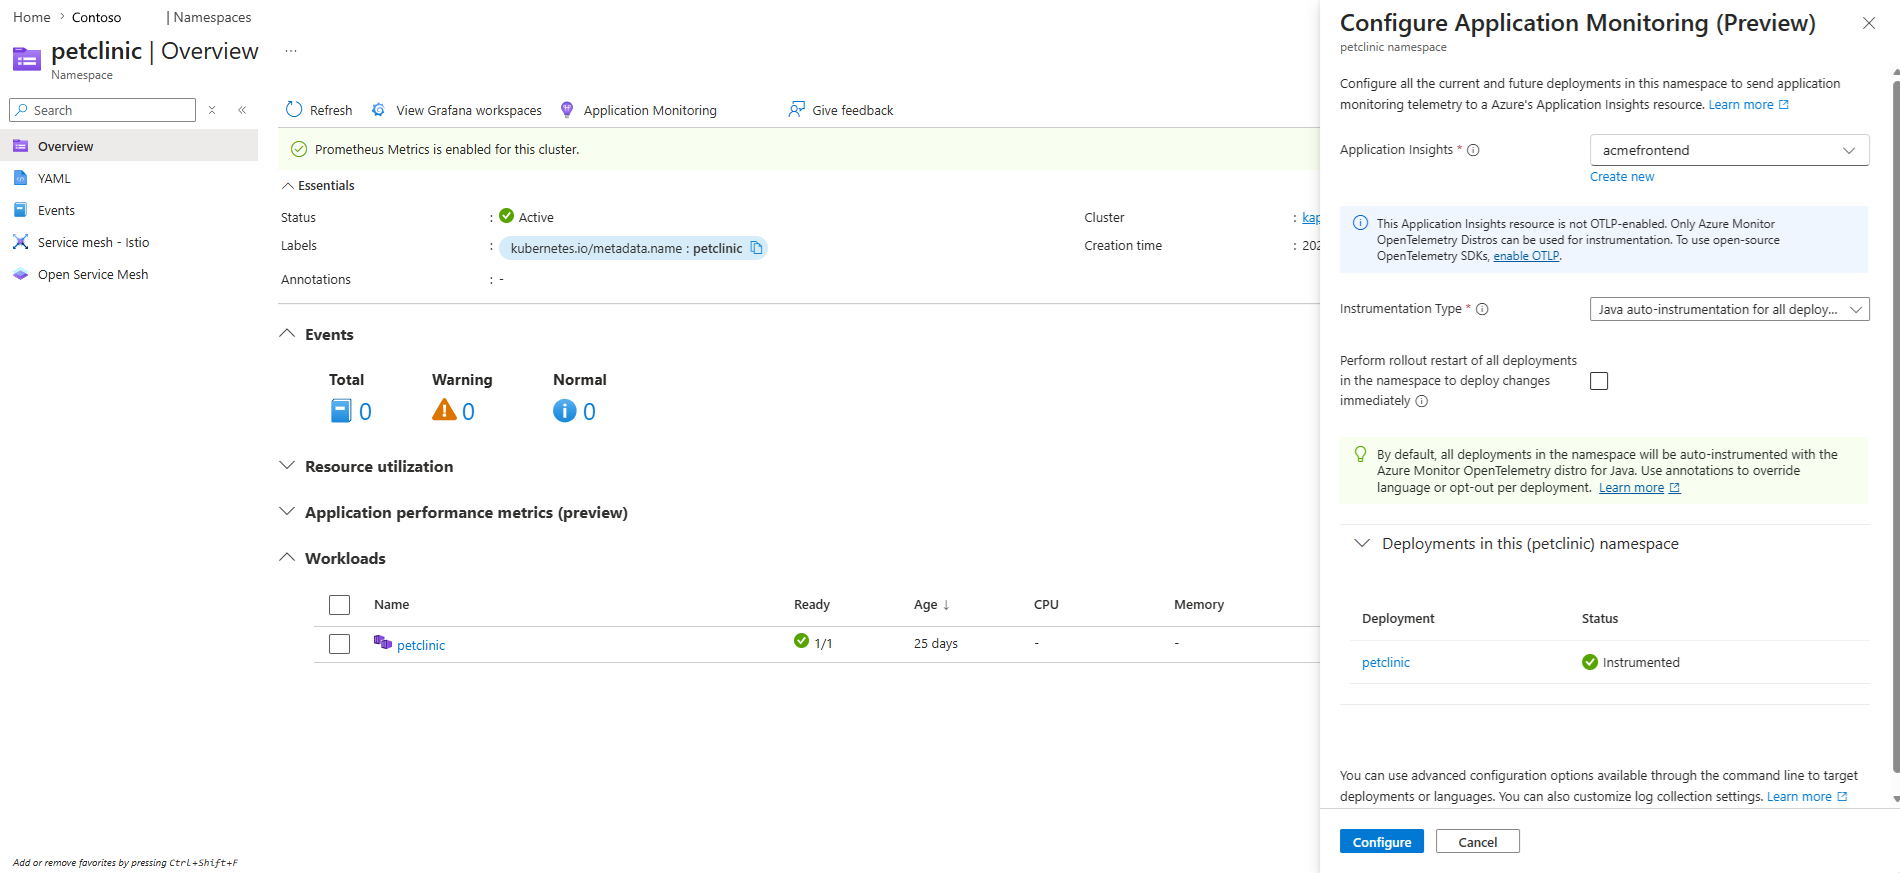
Use the Azure portal for namespace-wide deployment onboarding.
- From the Namespaces pane, select the namespace to instrument.
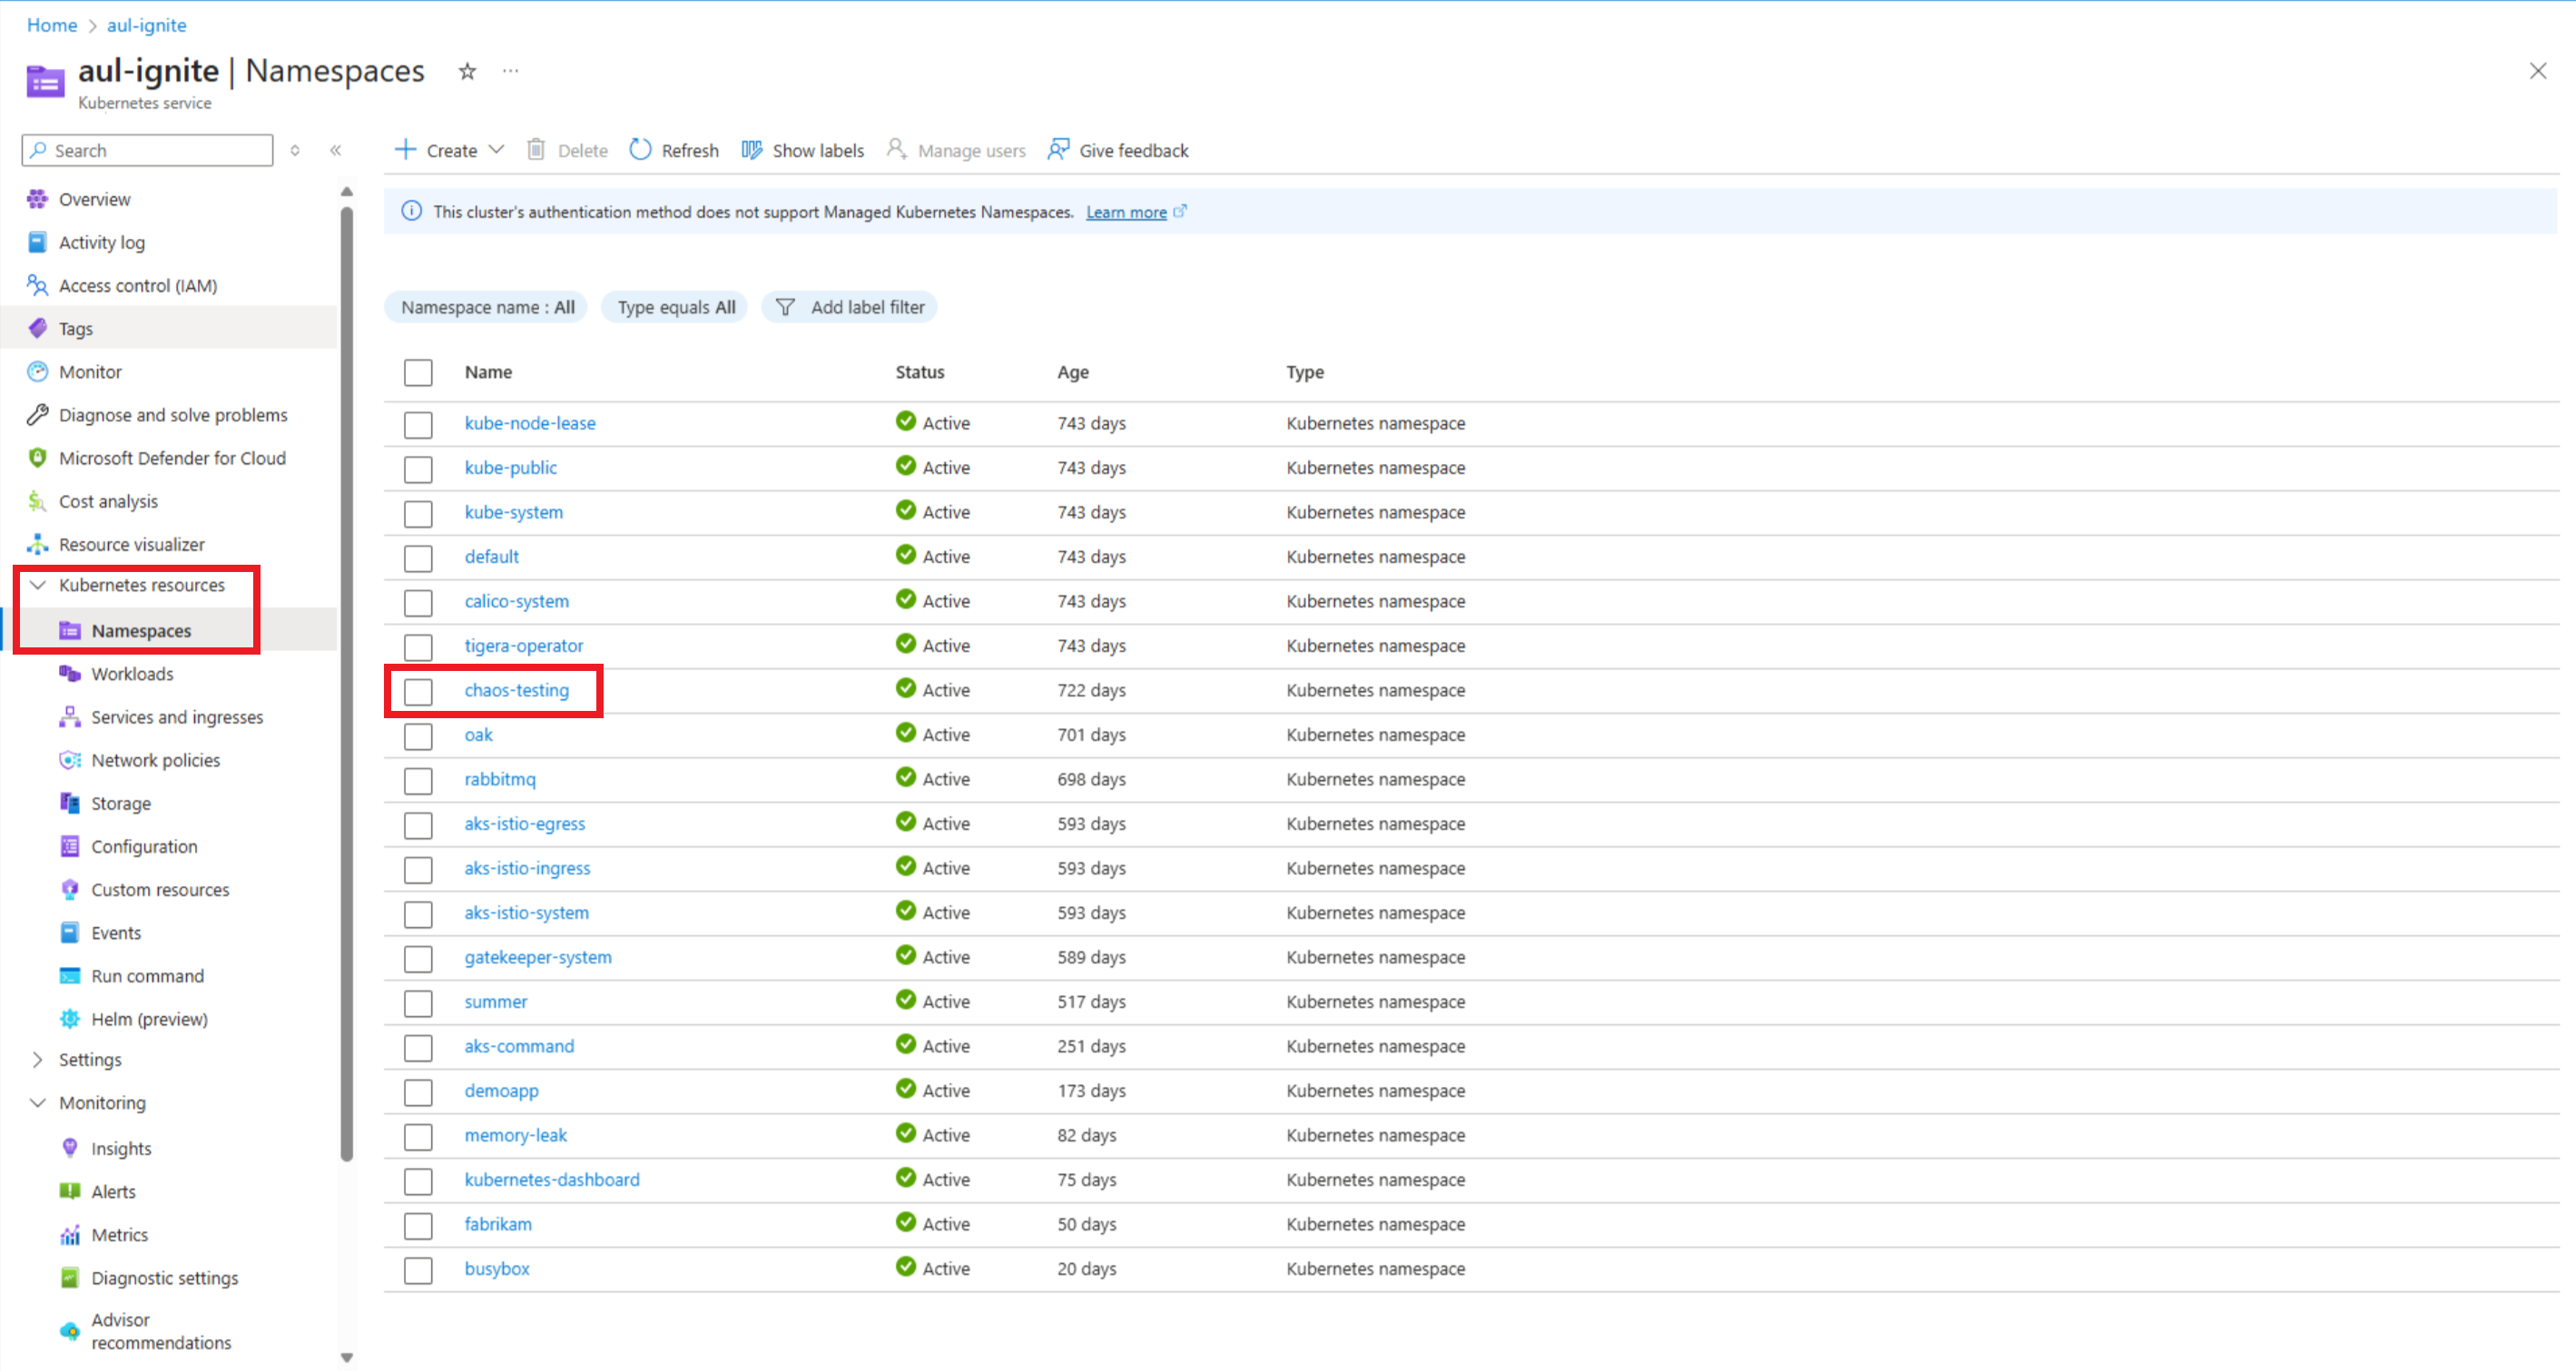
- Select Application Monitoring.
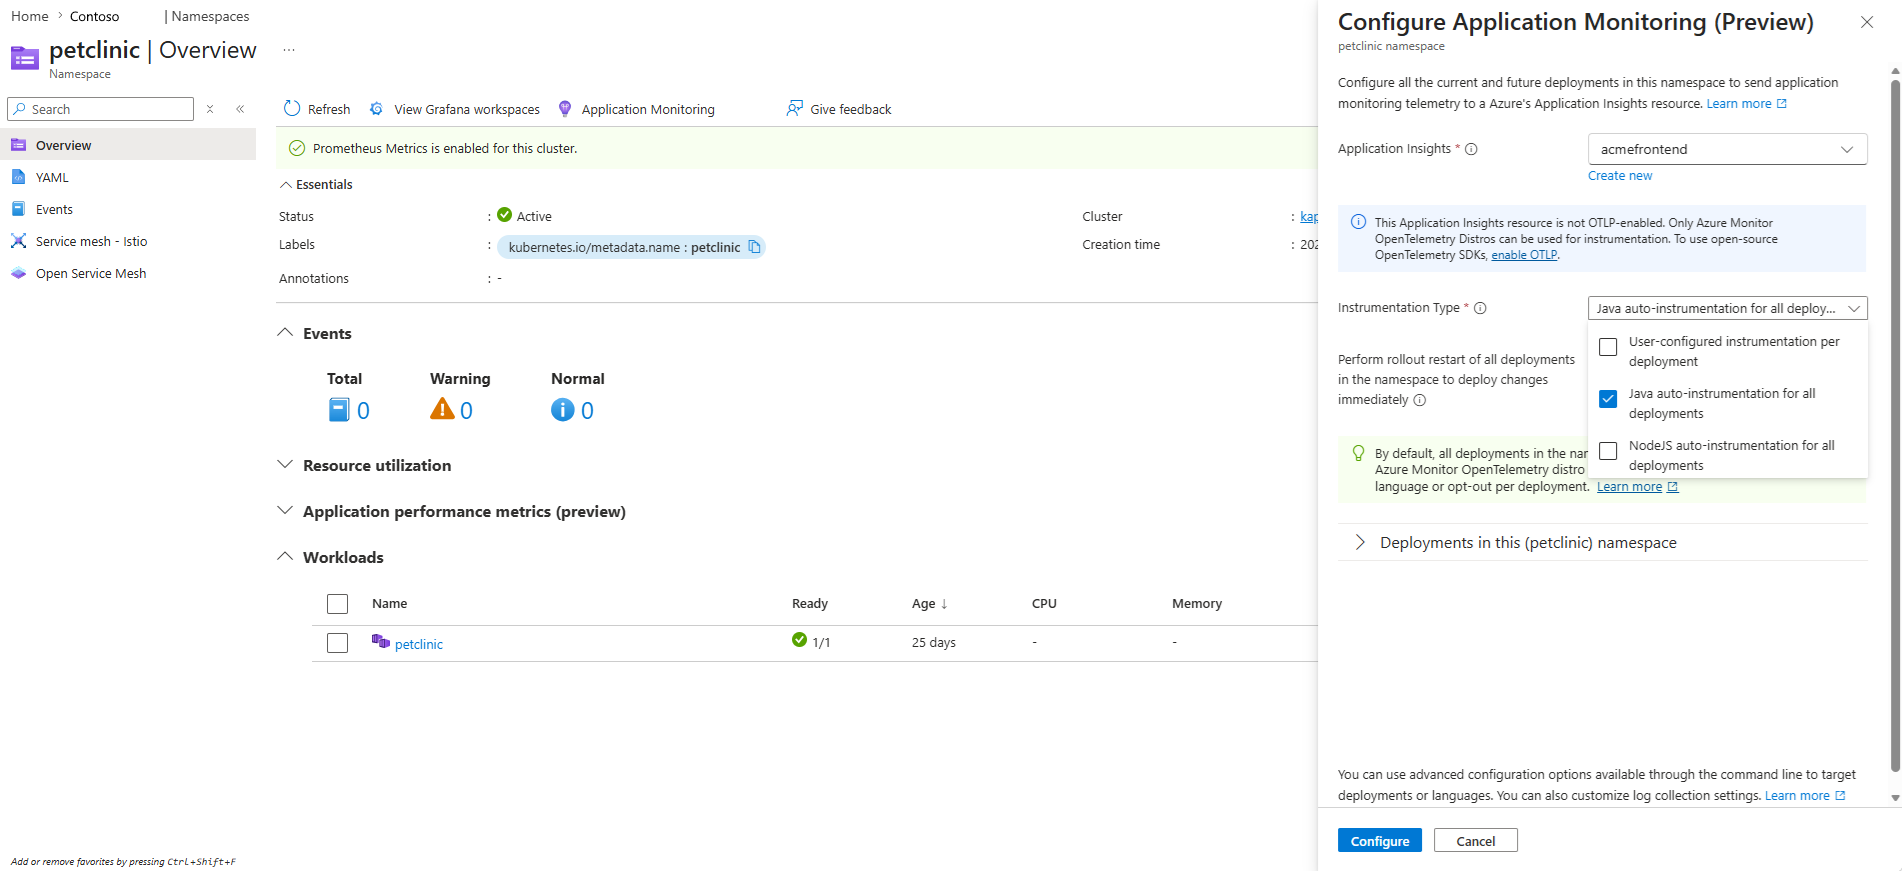
- Select the languages to instrument.
- Leave the Perform rollout restart of all deployments box unchecked. You should manually restart deployments later.
- Select Configure.
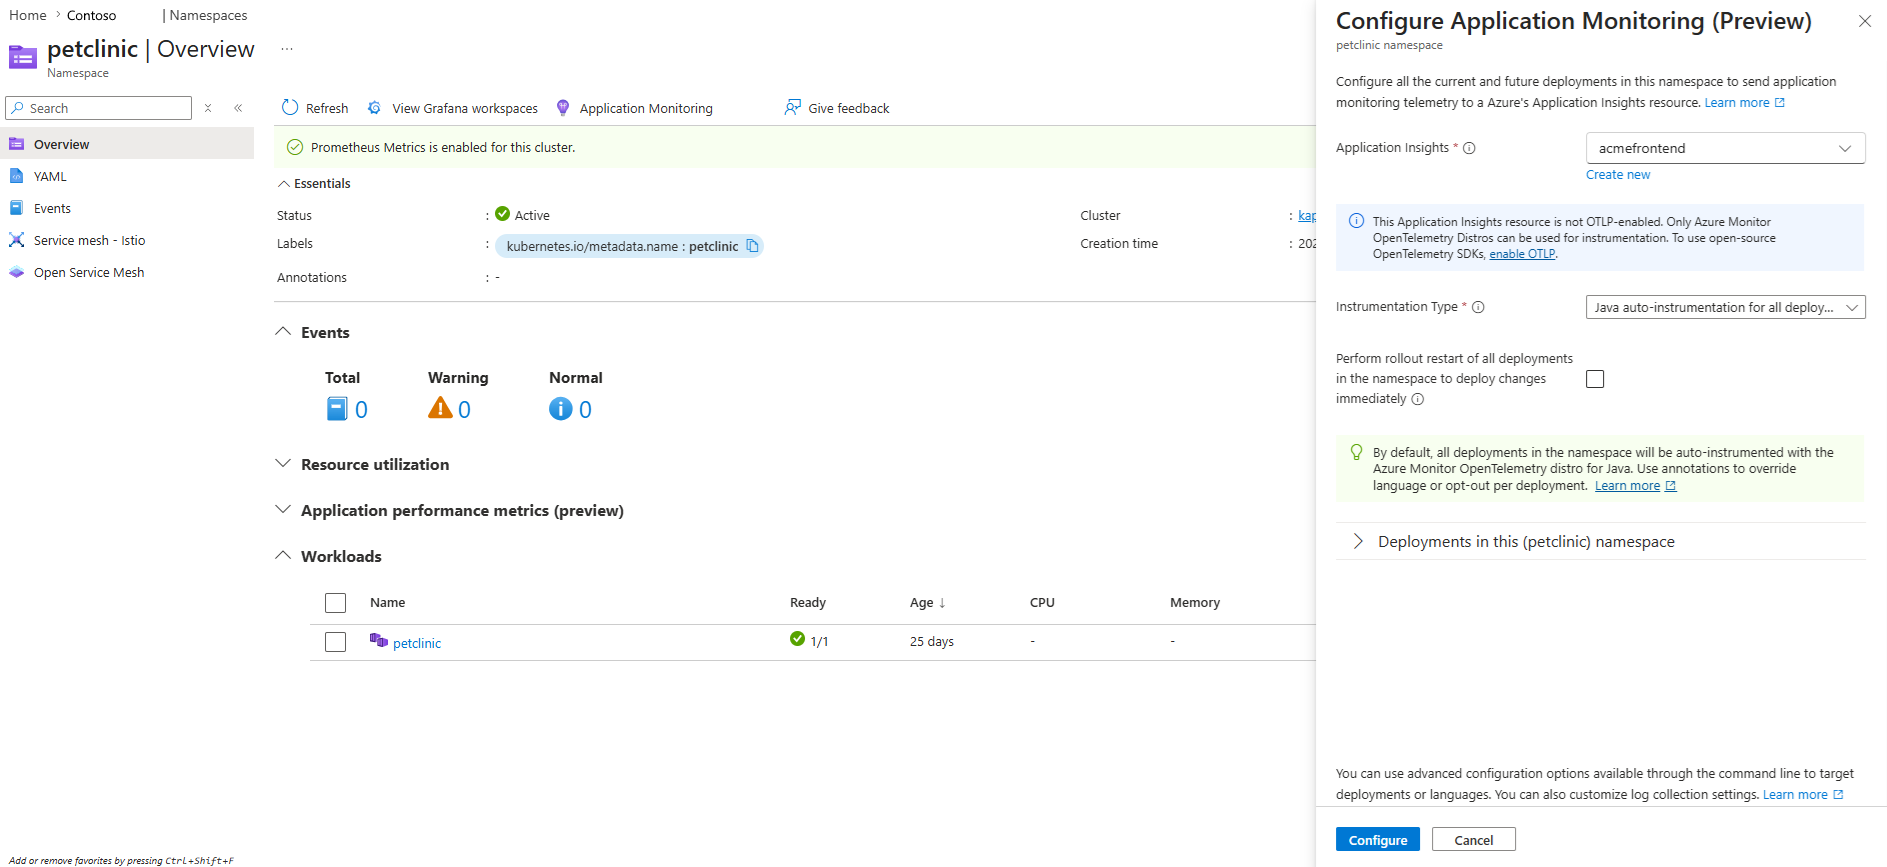
- Observe the Application Monitoring Progress and wait for it to complete.
Note
- The affected deployments must be restarted before the changes take effect.
- Manually restart deployments if you observe progress failures.
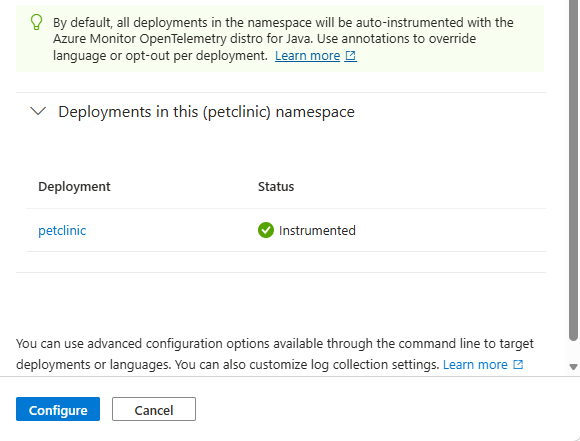
- Revisit the Application Monitoring section.
- Verify the "instrumented" status for each namespace in the deployment.


Per-deployment onboarding
Use per-deployment onboarding to ensure deployments are instrumented with specific languages or to direct telemetry to separate Application Insights resources.
Create a unique Instrumentation custom resource for each scenario. Avoid using the name
default, which is used for namespace-wide onboarding.Create Instrumentation custom resources to configure Application Insights in each namespace. Update
applicationInsightsConnectionStringto have the connection string of your Application Insights resource.Tip
You can retrieve the connection string from the overview page of your Application Insights resource.
apiVersion: monitor.azure.com/v1
kind: Instrumentation
metadata:
  name: cr1
  namespace: mynamespace1
spec:
  settings:
    autoInstrumentationPlatforms: []
  destination: # required
    applicationInsightsConnectionString: "InstrumentationKey=11111111-1111-1111-1111-111111111111;IngestionEndpoint=https://eastus2-3.in.applicationinsights.azure.com/;LiveEndpoint=https://eastus2.livediagnostics.monitor.azure.com/"
At a minimum, the following configuration is required:
spec.destination.applicationInsightsConnectionString: The connection string of an Application Insights resource.
Associate each deployment with the appropriate custom resource using annotations. The annotation overrides the language set in the custom resource.
Important
To avoid adding them to the deployment's annotations by mistake, add annotations at the
spec.template.metadata.annotationslevel of your deployment.Examples:
- Java:
instrumentation.opentelemetry.io/inject-java: "cr1" - Node.js:
instrumentation.opentelemetry.io/inject-nodejs: "cr1"
Place the annotations as follows.
apiVersion: apps/v1
kind: Deployment
...
spec:
  template:
    metadata:
      annotations:
        instrumentation.opentelemetry.io/inject-nodejs: "cr1"
Tip
Restart deployments for settings to take effect.
- Java:
Mixed mode onboarding
Use mixed mode when most deployments use a default configuration and a few deployments need different configurations.
- Implement namespace-wide onboarding to define the default configuration.
- Create per-deployment onboarding configurations to override the default configuration for specific resources.
Restart deployment
You can restart a deployment by using either the Azure portal or the Kubernetes command line (kubectl) tool.
Run the following command after you create all custom resources and optionally annotate deployments.
kubectl rollout restart deployment <deployment-name> -n mynamespace1
This command causes autoinstrumentation to take effect, enabling Application Insights. You can verify Application Insights is enabled by generating traffic and navigating to your resource. Your app is represented as a cloud role in Application Insights experiences. You can use all Application Insights experiences except Live Metrics and Code Analysis. To learn more about the available Application Insights experiences, see Application Insights experiences.
Remove autoinstrumentation for AKS
You can remove AKS autoinstrumentation by using Azure CLI.
Tip
- Removing AKS autoinstrumentation by using Azure CLI removes it from the entire cluster.
- To remove autoinstrumentation from a single namespace, delete the associated Instrumentation custom resource (CR). For example,
kubectl delete instrumentation <instrumentation-name> -n <namespace-name>.
Ensure that you don't have any instrumented deployments. To uninstrument an instrumented deployment, remove the associated Instrumentation custom resource and run kubectl rollout restart on the deployment. Next, run the following command.
az aks update --resource-group={resource_group} --name={cluster_name} --disable-azure-monitor-app-monitoring
Note
If instrumented deployments remain after the feature is disabled, they continue to be instrumented until redeployed to their original uninstrumented state or deleted.
Annotations
Annotations let you customize autoinstrumentation behavior at the deployment level, including disabling instrumentation for specific deployments and enabling application log collection in Application Insights.
Disabling autoinstrumentation
The following annotations disable autoinstrumentation:
Java:
instrumentation.opentelemetry.io/inject-javaNode.js:
instrumentation.opentelemetry.io/inject-nodejsinstrumentation.opentelemetry.io/inject-java: "false"
To turn autoinstrumentation back on after disabling it, add the annotations.
instrumentation.opentelemetry.io/inject-java: "true"
Place the annotations as follows.
apiVersion: apps/v1
kind: Deployment
...
spec:
  template:
    metadata:
      annotations:
        instrumentation.opentelemetry.io/inject-java: "false"
Enabling logs in Application Insights
You can collect logs in Application Insights as an addition to or replacement for Container Insights logs.
When you enable logs in Application Insights, you get correlated logs, so you can easily view distributed traces alongside their related logs. Some microservices don't write logs to the console, so Container Insights can't collect them. Only Application Insights instrumentation captures these logs.
Conversely, Application Insights might not be able to instrument all microservices. For example, it can't instrument those that use NGINX or unsupported languages. You might prefer to rely on container logs only for such microservices.
If you have multiple observability teams, such as infrastructure engineers using Container Insights and developers using Application Insights, you can choose to enable both sources for logs.
Review the console logging configurations in your application's code to determine whether you want to enable Application Insights Logs, container logs, or both. To disable container log collection, see Filter container log collection with ConfigMap.
Important
To avoid unnecessary duplication and increased cost, enable logs in Application Insights to allow the feature to collect application logs from standard logging frameworks and send them to Application Insights.
Use the following annotation to enable logs in Application Insights:
monitor.azure.com/enable-application-logs
Important
To avoid adding them to the deployment's annotations by mistake, add annotations at the spec.template.metadata.annotations level of your deployment.
monitor.azure.com/enable-application-logs: "true"
Prepare a cluster during AKS cluster create
You can prepare AKS clusters for this feature during cluster creation. Run the following Azure CLI command if you prefer to have the cluster prepped during creation. Application monitoring isn't enabled just because your cluster is prepped. You must deploy an application and onboard the application to this feature.
az aks create --resource-group={resource_group} --name={cluster_name} --enable-azure-monitor-app-monitoring --generate-ssh-keys
AKS autoinstrumentation FAQ
The following questions address common scenarios and considerations when using AKS autoinstrumentation, including custom metrics support, compatibility with existing SDKs, and security best practices.
Does Azure Kubernetes Service (AKS) autoinstrumentation support custom metrics?
If you want custom metrics in Node.js, manually instrument applications with the Azure Monitor OpenTelemetry Distro.
Java supports custom metrics with autoinstrumentation. You can collect custom metrics by updating your code and enabling this feature. If your code already has custom metrics, they flow through when autoinstrumentation is enabled.
Does AKS autoinstrumentation work with applications instrumented with an Open Source Software (OSS) OpenTelemetry SDK?
AKS autoinstrumentation can disrupt the telemetry sent to third parties by an OSS OpenTelemetry SDK.
Can AKS autoinstrumentation coexist with manual instrumentation?
AKS autoinstrumentation is designed to coexist with both manual instrumentation options: the Application Insights classic API SDK and Azure Monitor OpenTelemetry Distro.
It always prevents duplicate data and ensures custom metrics work.
Refer to this chart to determine when autoinstrumentation or manual instrumentation takes precedence.
| Language | Precedence |
|---|---|
| Node.js | Manual instrumentation |
| Java | Autoinstrumentation |
How do I ensure I'm using the latest and most secure versions of Azure Monitor OpenTelemetry Distro?
The development team prioritizes, fixes, and releases vulnerabilities detected in the Azure Monitor OpenTelemetry Distro in the next version.
AKS autoinstrumentation injects the latest version of the Azure Monitor OpenTelemetry Distro into your application pods every time you change or restart your deployment.
The OpenTelemetry Distro can become vulnerable on deployments that you don't change or restart for extended periods of time. For this reason, update or restart deployments weekly to ensure you're using a recent version of the Distro.
How do I learn more about the Azure Monitor OpenTelemetry Distro?
This feature achieves autoinstrumentation by injecting Azure Monitor OpenTelemetry Distro into application pods.
For Java, this feature integrates the standalone Azure Monitor OpenTelemetry Distro for Java. See the Java distro documentation to learn more about the Java instrumentation binary.
For Node.js, the feature injects an autoinstrumentation binary based on the Azure Monitor OpenTelemetry Distro for Node.js. For more information, see Node.js distro documentation. Keep in mind that there's no standalone autoinstrumentation for Node.js, so the distro documentation is geared towards manual instrumentation. You can ignore code-based configuration steps related to manual instrumentation. However, everything else in the distro documentation, such as default settings and environment variable configurations, is applicable to this feature.