Note
Access to this page requires authorization. You can try signing in or changing directories.
Access to this page requires authorization. You can try changing directories.
Reference layers enable the enhancement of spatial visualizations by overlaying a secondary spatial dataset on the map to provide more context. Power BI hosts this dataset in various formats, including:
- GeoJSON files with a
.jsonor.geojsonextension - WKT (Well-Known Text) files with a
.wktextension - KML (Keyhole Markup Language) files with a
.kmlextension - SHP (Shapefile) files with a
.shpextension - CSV (Comma-separated values) files with a
.csvextension. The Azure Maps Power BI visual parses the column containing WKT (Well-Known Text) strings from the sheet.
Add a spatial dataset as a reference layer
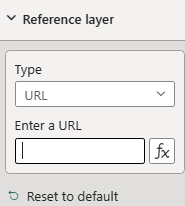
You have two options to add a spatial dataset as a reference layer. You can either reference a hosted file by providing the URL, or select a file to upload.
To upload a spatial dataset as a reference layer:
Navigate to the Format pane.
Expand the Reference Layer section.
Select File Upload from the Type drop-down list.
Select Browse. The file selection dialog opens, allowing you to choose a file with a
.json,.geojson,.wkt,.kml,.shp, or.csvextension.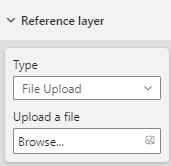
Once the file is added to the reference layer, the file name appears in the Browse field. An 'X' button is added that removes the data from the visual and deletes the associated file from Power BI when selected.
The following map displays 2016 census tracts for Colorado. The areas are colored, based on population, using the reference layer.

The following are all settings in the Format pane that are available in the Reference layer section.
| Setting | Description |
|---|---|
| Reference layer data | The data file to upload to the visual as another layer within the map. Selecting Browse shows a list of files with a .json, .geojson, .wkt, .kml, .shp, or .csv file extension that can be opened. |
Styling data in a reference layer
Properties can be added to each feature within the GeoJSON file to customize styling. This feature uses the simple data layer feature in the Azure Maps Web SDK. For more information, see this document on supported style properties. Custom icon images aren't supported within the Azure Maps Power BI visual as a security precaution.
The following are examples showing how to set a point features color property to red.
GeoJSON
{
    "type": "Feature",
    "geometry": {
        "type": "Point",
        "coordinates": [-122.13284, 47.63699]
    },
    "properties": {
        "color": "red"
    }
}
WKT
POINT(-122.13284 47.63699)
KML
<?xml version="1.0" encoding="UTF-8"?>
<kml xmlns="http://www.opengis.net/kml/2.2">
  <Placemark>
    <Point>
      <coordinates>-122.13284,47.63699</coordinates>
    </Point>
    <Style>
      <IconStyle>
        <color>ff0000ff</color> <!-- Red color in KML format (Alpha, Blue, Green, Red) -->
      </IconStyle>
    </Style>
  </Placemark>
</kml>
Custom style for reference layer via format pane
The Custom style for reference layer via format pane feature in Azure Maps enables you to personalize the appearance of reference layers. You can define the color, border width, and transparency of points, lines, and polygons directly in the Azure Maps Power BI visual interface, to enhance the visual clarity and impact of your geospatial data.

Enabling custom styles
To use the custom styling options for reference layers, follow these steps:
- Upload Geospatial Files: Start by uploading your supported geospatial files (GeoJSON, KML, WKT, CSV, or Shapefile) to Azure Maps as a reference layer.
- Access Format Settings: Navigate to the Reference Layer blade within the Azure Maps Power BI visual settings.
- Customize Styles: Use to adjust the appearance of your reference layer by setting the fill color, border color, border width, and transparency for points, lines, and polygons.
Note
If your geospatial files (GeoJSON, KML) include predefined style properties, Power BI utilizes those styles rather than the settings configured in the format pane. Make sure your files are styled according to your requirements before uploading if you intend to use custom properties defined within them.
Style configuration
| Setting name | Description | Setting values |
|---|---|---|
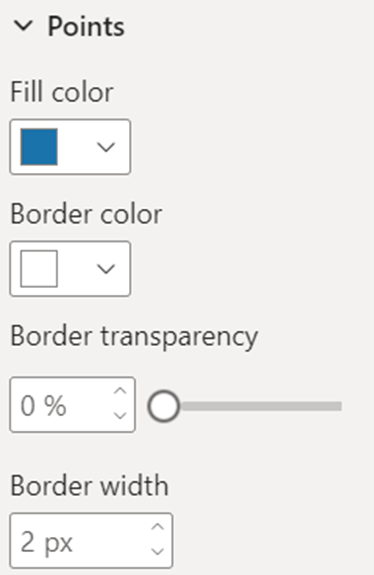
| Fill color | Fill color of points and polygons. | Set colors for different data category or gradient for numeric data. |
| Border color | The color of the points, lines, and polygons outline. | Color picker |
| Border width | The width of the border in pixels. Default: 3 px | Width 1-20 pixels |
| Border transparency | The transparency of the borders. Default: 0% | Transparency 0-100% |
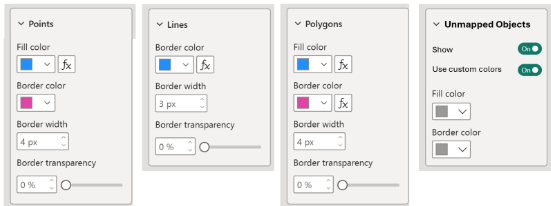
The Points section of the format visual pane:
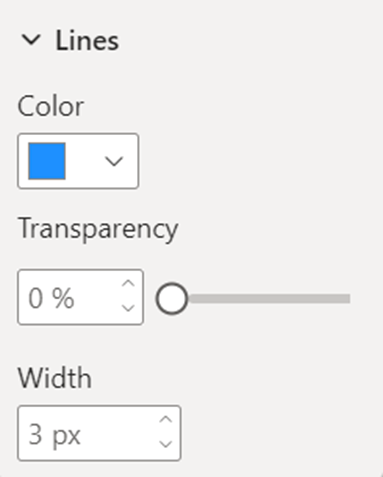
The Lines section of the format visual pane:
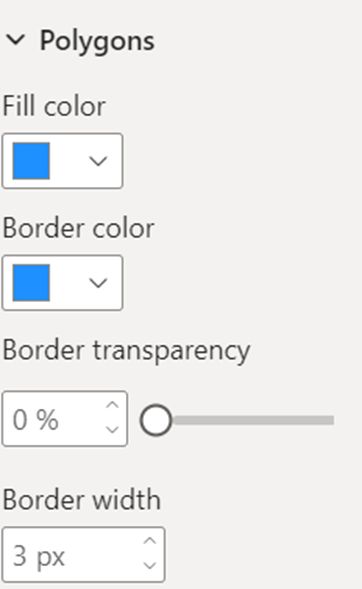
The Polygons section of the format visual pane:
Data-bound reference layer
The data-bound reference layer enables the association of data with specific shapes in the reference layer based on common attributes.
To use the data-bound reference layer, drag the column containing unique identifiers (can be location data or not) to the Location field of the Azure Maps visual.
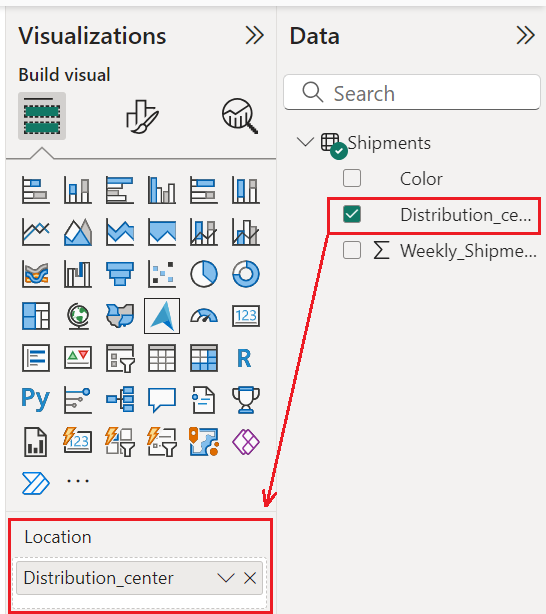
Azure Maps matches these identifiers with the corresponding properties in the uploaded spatial file, automatically linking your data to the shapes on the map.
In scenarios with multiple properties, Azure Maps identifies a common property in each shape and compares its value with the selected data column in the Location field. It then uses the property that has the highest number of matches with the selected data column.

If one or more shapes in the reference layer can't be automatically mapped to any data point, you can manage these unmapped objects by following these steps:
- Select the Format visual tab in the Visualizations pane.
- Select Reference layer.
- Select Unmapped Objects.
- Select the Show toggle switch to toggle On/Off. This highlights shapes that aren't mapped to any data points.
Optionally, select the Use custom colors toggle switch to toggle On/Off custom fill and border colors for unmapped objects to make them visually distinct on the map.

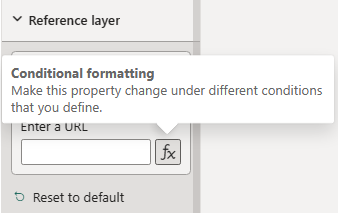
Conditional formatting
Conditional formatting can be applied to data to dynamically change the appearance of shapes on a map based on the provided data. For instance, gradient colors can visualize various data values such as population density, sales performance, or other metrics. This is a powerful tool for combining spatial and business data to create interactive and visually compelling reports.
There are several ways to set colors to the shapes. The following table shows the priorities used:
| Priority | Source | Description |
|---|---|---|
| 1 | Preset style in spatial files | Color and style as defined in the spatial file |
| 2 | Unmapped object colors | Custom colors used when the geometry isn’t data-bound |
| 3 | Legend colors | Colors provided by Legend/Series |
| 4 | Conditional formatting colors | Colors provided by conditional formatting |
| 5 | Custom formatting colors | User defined custom styles in the Reference Layer options in the formatting pane |
| 6 | Default colors | Default colors defined in the Azure Maps visual |
Tip
The Azure Maps Power BI Visual can only perform geocoding on valid location data such as geographical coordinates, addresses, or place names. If no valid location data is uploaded, data layers that depend on geocoded locations, such as heat maps or bubble layers, don’t display on the map.
The data-bound reference layer appears on the map as long as the data column contains unique identifiers that match properties in the spatial file, but to ensure correct results, your data column must include valid geographic information.
Map US ZIP Codes
Public spatial files, such as the US Census ZIP Code Tabulation Areas (ZCTAs), can serve as a reference layer to visualize data by ZIP Code. These files are often large and detailed, so you typically need to reduce their size and complexity before you use them in the Azure Maps Power BI visual. The following workflow shows how to prepare a nationwide ZIP Code boundary file.
Download and prepare the source data
- Download the ZIP Code Tabulation Area shapefiles from the US Census Bureau Cartographic Boundary Files page.
- Unzip each downloaded archive to extract the shapefile components.
- Convert each shapefile to GeoJSON, then minify the resulting JSON to reduce file size. Save each file with a
_zip_codes_geo.min.jsonsuffix so the merge step can find it.
Merge and simplify the data
The raw shapefiles total around 1.2 GB and provide sub-meter accuracy, which is far more detail than a Power BI map needs. Use the mapshaper command-line tool to merge the individual files into a single GeoJSON file while reducing its size. The following command combines every file, simplifies the geometry, removes unnecessary fields, and rounds coordinates:
mapshaper -i *_zip_codes_geo.min.json combine-files -merge-layers -simplify visvalingam 5% -filter-fields ZCTA5CE10 -o format=geojson precision=0.0001 us_zip_codes_simplified.json
This command applies the following optimizations:
combine-files -merge-layerscombines the individual state files into a single layer.-simplify visvalingam 5%retains 5% of the original points by using the Visvalingam algorithm, which significantly reduces file size while preserving the overall shape of each boundary.-filter-fields ZCTA5CE10keeps only theZCTA5CE10field, which holds the five-digit ZIP Code used to bind your data, and removes all other attributes.precision=0.0001rounds coordinates to about 10 meters of accuracy, which is sufficient for ZIP Code visualizations.
The resulting us_zip_codes_simplified.json file is small enough to upload as a reference layer. To bind your data to the boundaries, drag the column that contains five-digit ZIP Codes to the Location field, and Azure Maps matches the values against the ZCTA5CE10 property. For more information, see Data-bound reference layer.
Note
The Azure Maps Power BI visual renders only the first 30,000 features from a reference layer. If your file contains more shapes than this limit, any features beyond the first 30,000 don't display on the map.
Next steps
Add more context to the map: