Add a bubble layer to a map (Android SDK)
This article shows you how to render point data from a data source as a bubble layer on a map. Bubble layers render points as circles on the map with a fixed pixel radius.
Note
Azure Maps Android SDK retirement
The Azure Maps Native SDK for Android is now deprecated and will be retired on 3/31/25. To avoid service disruptions, migrate to the Azure Maps Web SDK by 3/31/25. For more information, see The Azure Maps Android SDK migration guide.
Tip
Bubble layers by default will render the coordinates of all geometries in a data source. To limit the layer so that it only renders point geometry features, set the filter option of the layer to eq(geometryType(), "Point"). If you want to include MultiPoint features as well, set the filter option of the layer to any(eq(geometryType(), "Point"), eq(geometryType(), "MultiPoint")).
Prerequisites
Complete the steps in the Quickstart: Create an Android app article. Code blocks in this article can be inserted into the maps onReady event handler.
Add a bubble layer
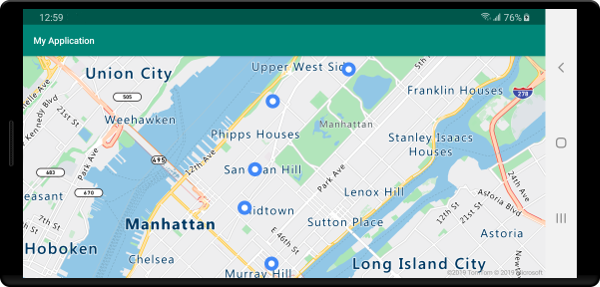
The following code loads an array of points into a data source. Then, it connects the data points are to a bubble layer. The bubble layer renders the radius of each bubble with five pixels and a fill color of white. And, a stroke color of blue, and a stroke width of six pixels.
//Create a data source and add it to the map.
DataSource source = new DataSource();
map.sources.add(source);

//Create point locations.
Point[] points = new Point[] {
    Point.fromLngLat(-73.985708, 40.75773),
    Point.fromLngLat(-73.985600, 40.76542),
    Point.fromLngLat(-73.985550, 40.77900),
    Point.fromLngLat(-73.975550, 40.74859),
    Point.fromLngLat(-73.968900, 40.78859)
};

//Add multiple points to the data source.
source.add(points);

//Create a bubble layer to render the filled in area of the circle, and add it to the map.
BubbleLayer layer = new BubbleLayer(source,
    bubbleRadius(5f),
    bubbleColor("white"),
    bubbleStrokeColor("#4288f7"),
    bubbleStrokeWidth(6f)
);

map.layers.add(layer);
//Create a data source and add it to the map.
val source = DataSource()
map.sources.add(source)

//Create point locations.
val points: Array<Point> = arrayOf<Point>(
    Point.fromLngLat(-73.985708, 40.75773),
    Point.fromLngLat(-73.985600, 40.76542),
    Point.fromLngLat(-73.985550, 40.77900),
    Point.fromLngLat(-73.975550, 40.74859),
    Point.fromLngLat(-73.968900, 40.78859)
)

//Add multiple points to the data source.
source.add(points)

//Create a bubble layer to render the filled in area of the circle, and add it to the map.
val layer = BubbleLayer(
    source,
    bubbleRadius(5f),
    bubbleColor("white"),
    bubbleStrokeColor("#4288f7"),
    bubbleStrokeWidth(6f)
)

map.layers.add(layer)
The following screenshot shows the above code renders points in a bubble layer.

Show labels with a bubble layer
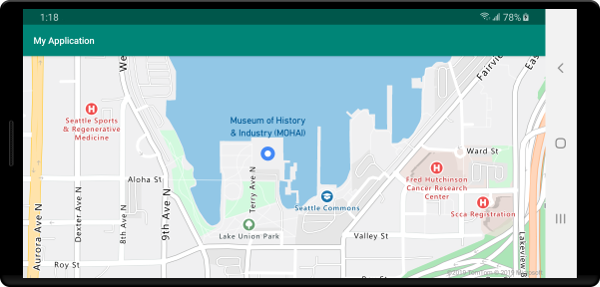
This code shows you how to use a bubble layer to render a point on the map. And, how to use a symbol layer to render a label. To hide the icon of the symbol layer, set the iconImage option to "none".
//Create a data source and add it to the map.
DataSource source = new DataSource();
map.sources.add(source);

//Add a data point to the map.
source.add(Point.fromLngLat(-122.336641,47.627631));

//Add a bubble layer.
map.layers.add(new BubbleLayer(source,
    bubbleRadius(5f),
    bubbleColor("white"),
    bubbleStrokeColor("#4288f7"),
    bubbleStrokeWidth(6f)
));

//Add a symbol layer to display text, hide the icon image.
map.layers.add(new SymbolLayer(source,
    //Hide the icon image.
    iconImage("none"),
    textField("Museum of History & Industry (MOHAI)"),
    textColor("#005995"),
    textOffset(new Float[]{0f, -2.2f})
));
//Create a data source and add it to the map.
val source = DataSource()
map.sources.add(source)

//Add a data point to the map.
source.add(Point.fromLngLat(-122.336641, 47.627631))

//Add a bubble layer.
map.layers.add(
    BubbleLayer(
        source,
        bubbleRadius(5f),
        bubbleColor("white"),
        bubbleStrokeColor("#4288f7"),
        bubbleStrokeWidth(6f)
    )
)

//Add a symbol layer to display text, hide the icon image.
map.layers.add(
    SymbolLayer(
        source,  //Hide the icon image.
        iconImage("none"),
        textField("Museum of History & Industry (MOHAI)"),
        textColor("#005995"),
        textOffset(arrayOf(0f, -2.2f))
    )
)
The following screenshot shows the above code rendering a point in a bubble layer and a text label for the point with a symbol layer.

Next steps
See the following articles for more code samples to add to your maps: