Debug Sessions in Azure AI Search
Debug Sessions is a visual editor that works with an existing skillset in the Azure portal, exposing the structure and content of a single enriched document as it's produced by an indexer and skillset for the duration of the session. Because you're working with a live document, the session is interactive - you can identify errors, modify and invoke skill execution, and validate the results in real time. If your changes resolve the problem, you can commit them to a published skillset to apply the fixes globally.
This article explains how the editor is organized. Tabs and sections of the editor unpack different layers of the skillset so that you can examine skillset structure, flow, and the content it generates at run time.
How a debug session works
When you start a session, the search service creates a copy of the skillset, indexer, and a data source containing a single document used to test the skillset. All session state is saved to a new blob container created by the Azure AI Search service in an Azure Storage account that you provide. The name of the generated container has a prefix of ms-az-cognitive-search-debugsession. The prefix is required because it mitigates the chance of accidentally exporting session data to another container in your account.
A cached copy of the enriched document and skillset is loaded into the visual editor so that you can inspect the content and metadata of the enriched document, with the ability to check each document node and edit any aspect of the skillset definition. Any changes made within the session are cached. Those changes won't affect the published skillset unless you commit them. Committing changes will overwrite the production skillset.
If the enrichment pipeline doesn't have any errors, a debug session can be used to incrementally enrich a document, test and validate each change before committing the changes.
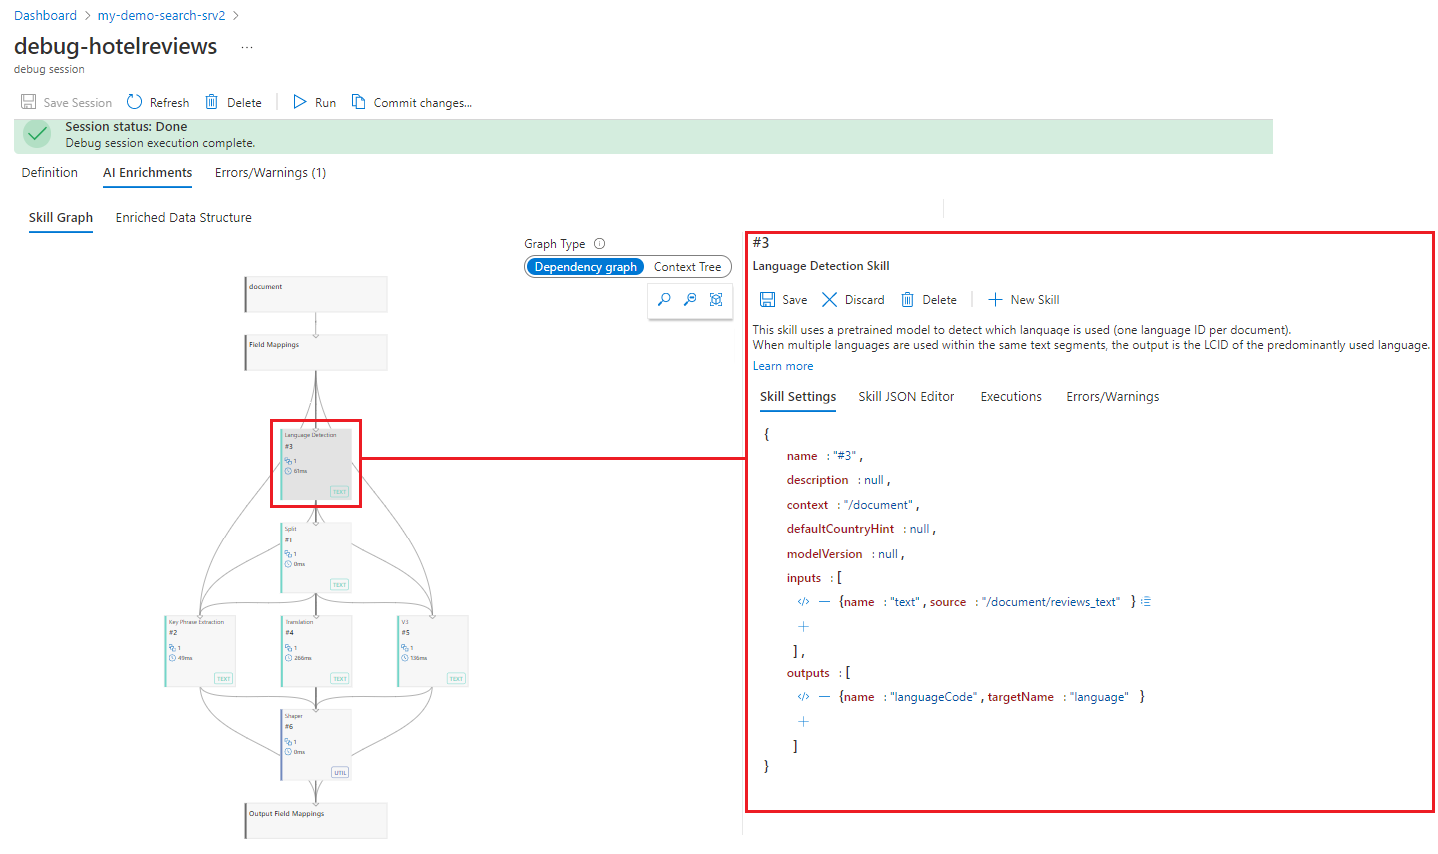
AI Enrichments tab > Skill Graph
The visual editor is organized into tabs and panes. This section introduces the components of the visual editor.
The Skill Graph provides a visual hierarchy of the skillset and its order of execution from top to bottom. Skills that are dependent upon the output of other skills are positioned lower in the graph. Skills at the same level in the hierarchy can execute in parallel. Color coded labels of skills in the graph indicate the types of skills that are being executed in the skillset (TEXT or VISION).
The Skill Graph is where you select which skill to debug or enhance. The details pane to the right is where you edit and explore.
Skill details pane
Skill details are presented in a tabbed layout and include the following areas:
- Skill Settings: a formatted version of the skill definition.
- Skill JSON Editor: the raw JSON document of the definition.
- Executions: the data corresponding to each time a skill was executed.
- Errors and warnings: the messages generated upon session start or refresh.
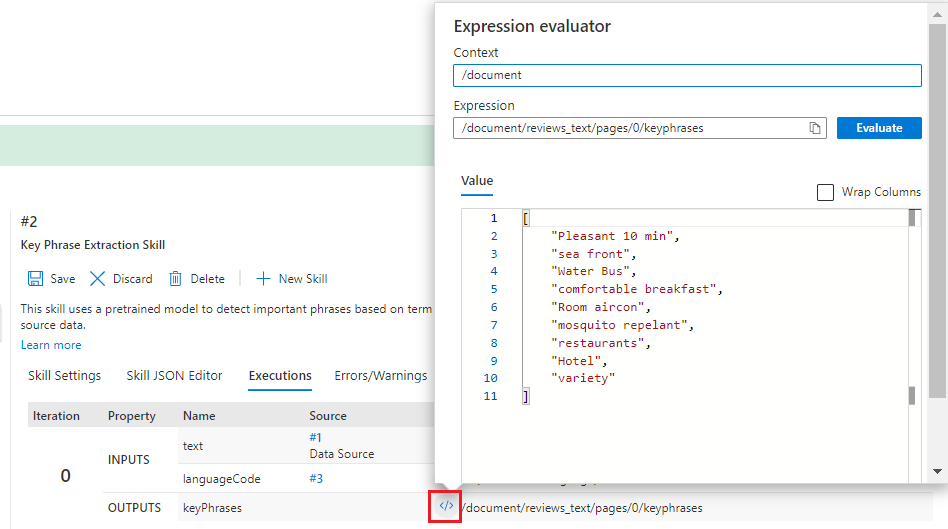
On Executions or Skill Settings, select the </> symbol to open the Expression Evaluator used for viewing and editing the expressions of the skills inputs and outputs.
Nested input controls in Skill Settings can be used to build complex shapes for projections, output field mappings for a complex type field, or an input to a skill. When used with the Expression Evaluator, nested inputs provide an easy test and validate expression builder.
Executions pane
A skill can execute multiple times in a skillset for a single document. For example, the OCR skill executes once for each image extracted from a single document. The Executions pane displays the skill's execution history providing a deeper look into each invocation of the skill.
The execution history enables tracking a specific enrichment back to the skill that generated it. Clicking on a skill input navigates to the skill that generated that input, providing a stack-trace like feature. This allows identification of the root cause of a problem that might manifest in a downstream skill.
When you debug an error with a custom skill, there's the option to generate a request for a skill invocation in the execution history.
AI Enrichments tab > Enriched Data Structure
The Enriched Data Structure pane shows the document's enrichments through the skillset, detailing the context for each enrichment and the originating skill. The Expression Evaluator can also be used to view the contents for each enrichment.
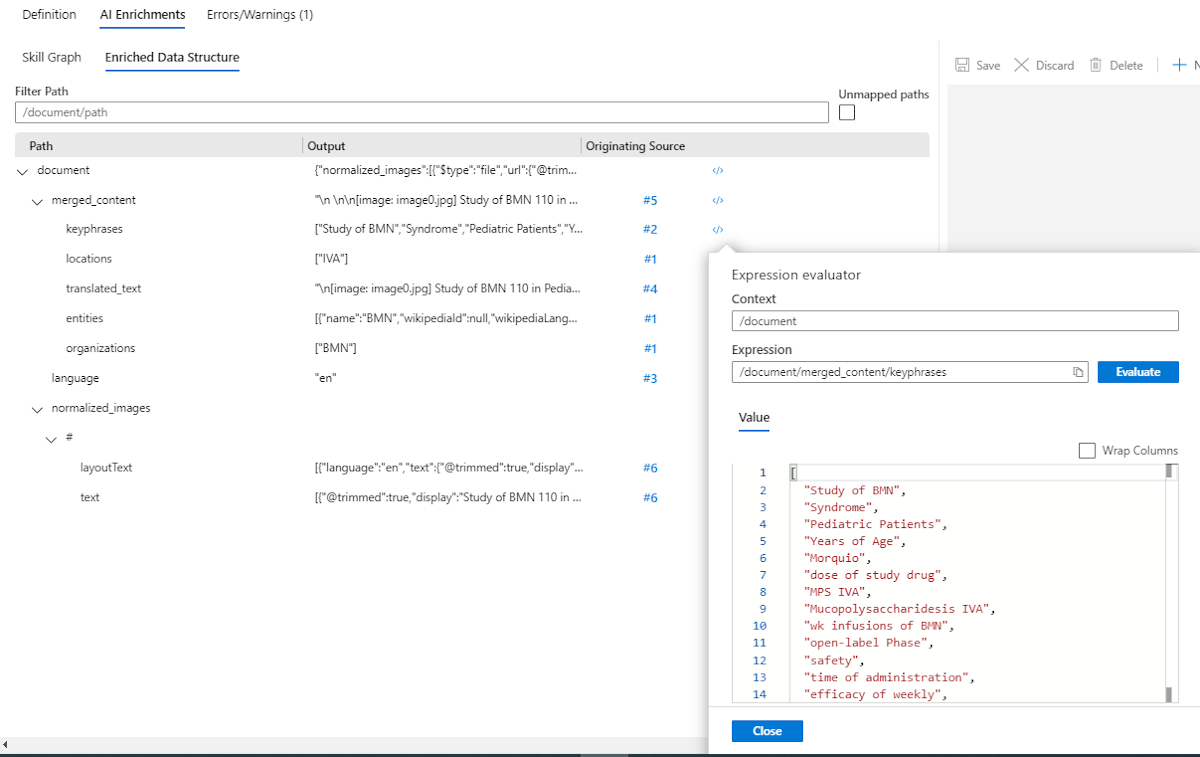
Expression Evaluator
Expression Evaluator shows the executable elements of the kil. It allows for editing the path and testing the results before updating any of the inputs or context for a skill or projection.
You can open the evaluator from any node or element that shows the </> symbol, including parts of a dependency graph or nodes in an enrichment tree.
Expression Evaluator gives you full interactive access for testing skill context, inputs, and checking outputs.
Next steps
Now that you understand the elements of debug sessions, start your first debug session on an existing skillset.
Feedback
Coming soon: Throughout 2024 we will be phasing out GitHub Issues as the feedback mechanism for content and replacing it with a new feedback system. For more information see: https://aka.ms/ContentUserFeedback.
Submit and view feedback for