Event analysis and visualization with Azure Monitor logs
Azure Monitor logs collects and analyzes telemetry from applications and services hosted in the cloud and provides analysis tools to help you maximize their availability and performance. This article outlines how to run queries in Azure Monitor logs to gain insights and troubleshoot what is happening in your cluster. The following common questions are addressed:
- How do I troubleshoot health events?
- How do I know when a node goes down?
- How do I know if my application's services have started or stopped?
To learn more about using Azure Monitor to collect and analyze data for this service, see Monitor Azure Service Fabric.
Access the Service Fabric Analytics solution
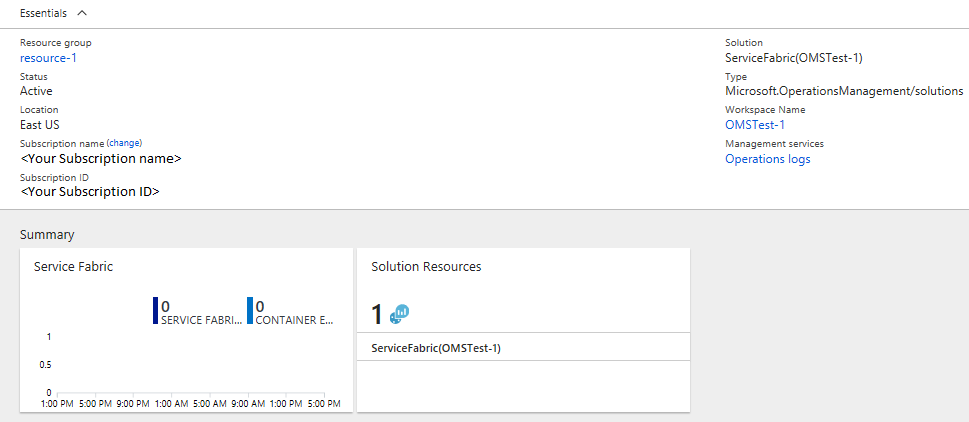
In the Azure portal, go to the resource group in which you created the Service Fabric Analytics solution.
Select the resource ServiceFabric<nameOfOMSWorkspace>.
In Summary, you will see tiles in the form of a graph for each of the solutions enabled, including one for Service Fabric. Select the Service Fabric graph to continue to the Service Fabric Analytics solution.
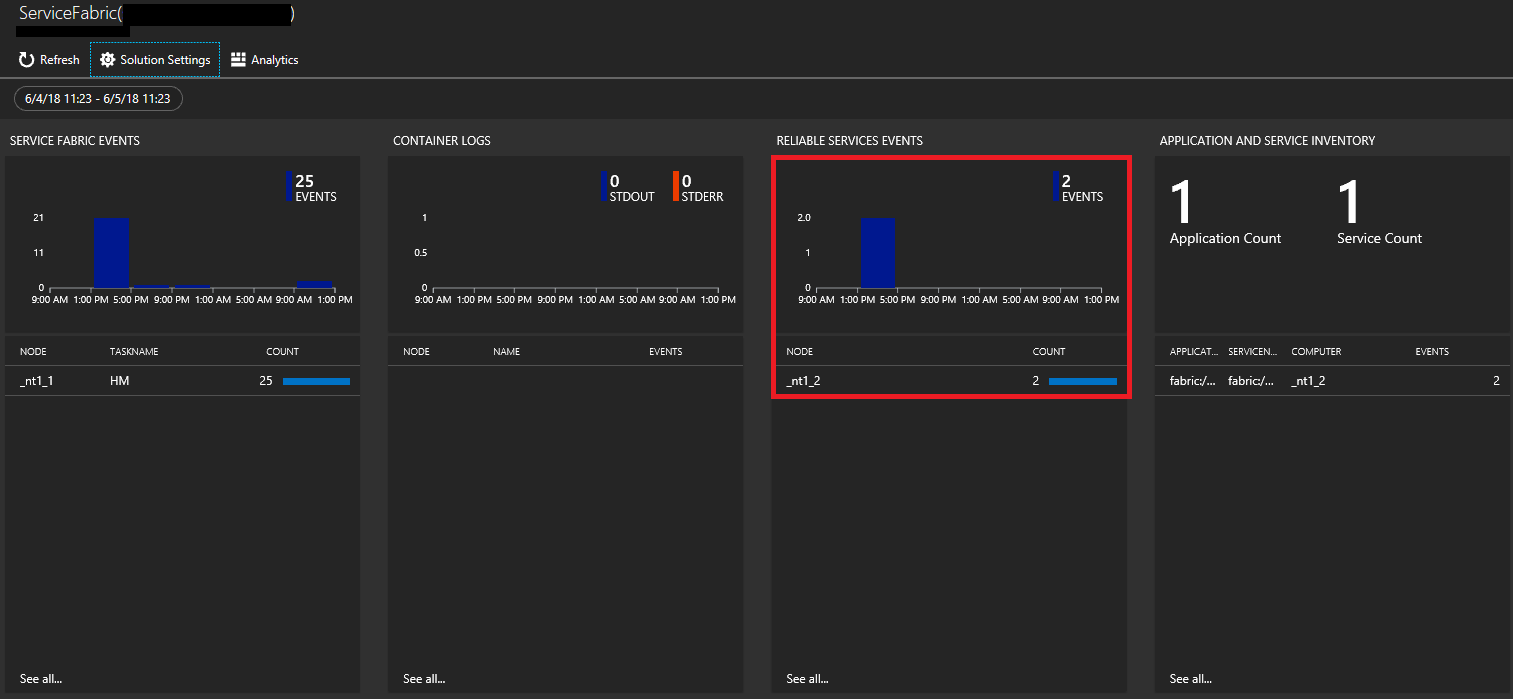
The following image shows the home page of the Service Fabric Analytics solution. This home page provides a snapshot view of what's happening in your cluster.
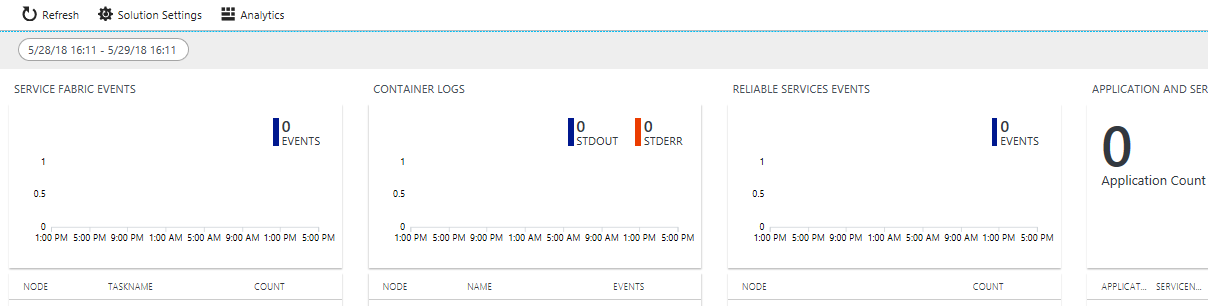
If you enabled diagnostics upon cluster creation, you can see events for
- Service Fabric cluster events
- Reliable Actors programming model events
- Reliable Services programming model events
Note
In addition to the Service Fabric events out of the box, more detailed system events can be collected by updating the config of your diagnostics extension.
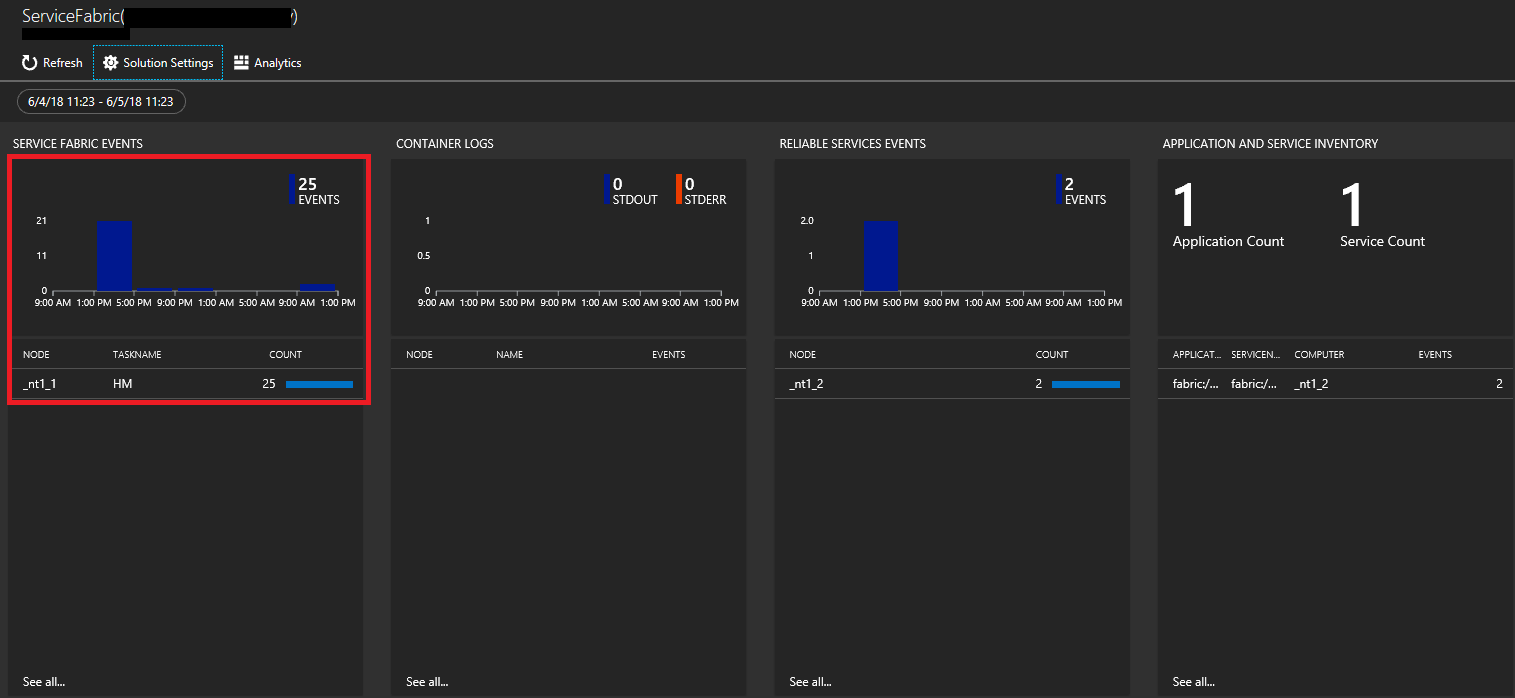
View Service Fabric Events, including actions on nodes
On the Service Fabric Analytics page, select the graph for Service Fabric Events.
Select List to view the events in a list. Once here, you see all the system events that have been collected. For reference, these are from the WADServiceFabricSystemEventsTable in the Azure Storage account, and similarly the reliable services and actors events you see next are from those respective tables.
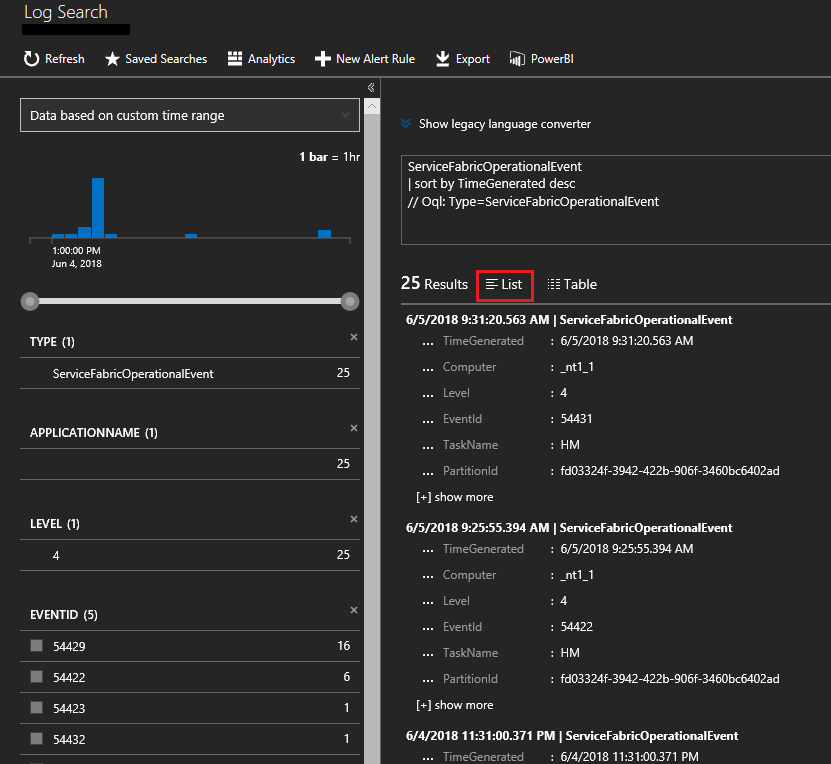
Alternatively, you can select the magnifying glass on the left and use the Kusto query language to find what you're looking for. For example, to find all actions taken on nodes in the cluster, you can use the following query. The event IDs used below are found in the operational channel events reference.
ServiceFabricOperationalEvent
| where EventId < 25627 and EventId > 25619
You can query on many more fields such as the specific nodes (Computer) the system service (TaskName).
View Service Fabric Reliable Service and Actor events
On the Service Fabric Analytics page, select the graph for Reliable Services.
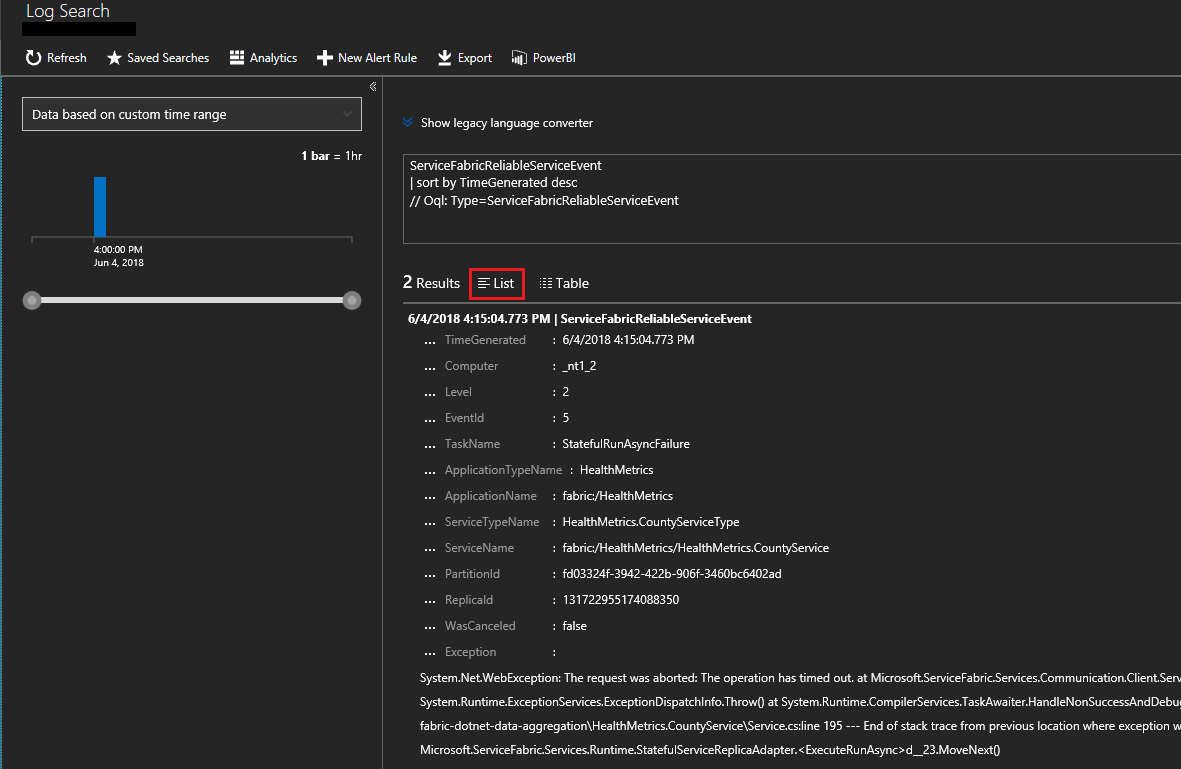
Select List to view the events in a list. Here you can see events from the reliable services. You can see different events for when the service runasync is started and completed which typically happens on deployments and upgrades.
Reliable actor events can be viewed in a similar fashion. To configure more detailed events for reliable actors, you need to change the scheduledTransferKeywordFilter in the config for the diagnostic extension (shown below). Details on the values for these are in the reliable actors events reference.
"EtwEventSourceProviderConfiguration": [
                {
                    "provider": "Microsoft-ServiceFabric-Actors",
                    "scheduledTransferKeywordFilter": "1",
                    "scheduledTransferPeriod": "PT5M",
                    "DefaultEvents": {
                    "eventDestination": "ServiceFabricReliableActorEventTable"
                    }
                },
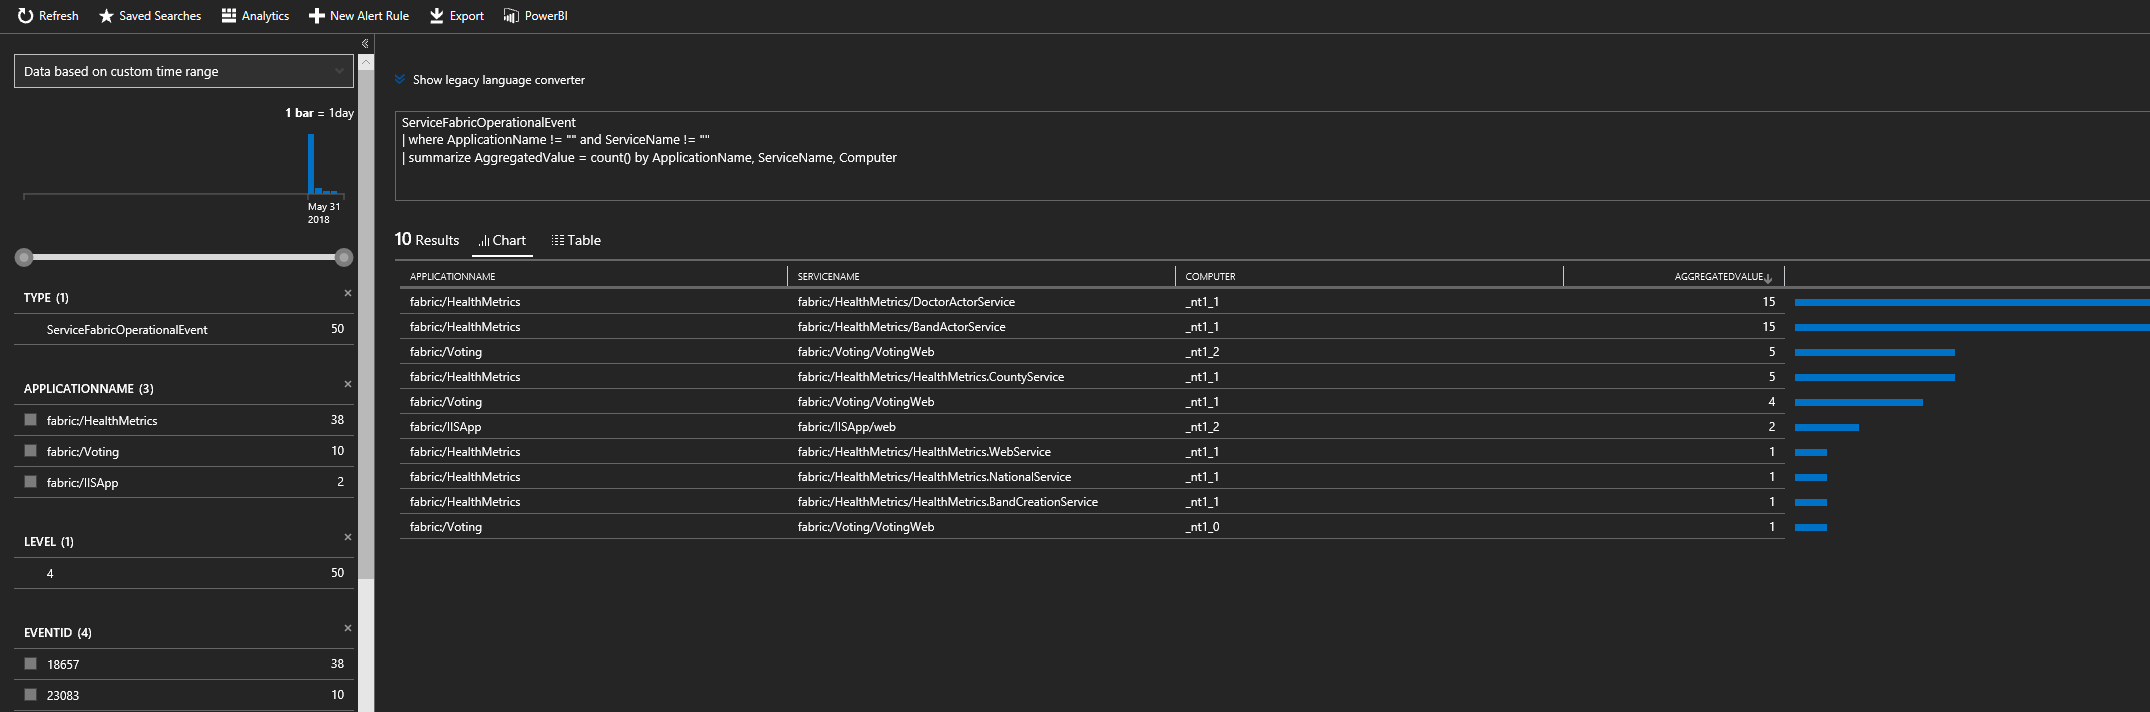
The Kusto query language is powerful. Another valuable query you can run is to find out which nodes are generating the most events. The query in the following screenshot shows Service Fabric operational events aggregated with the specific service and node.
Next steps
- To enable infrastructure monitoring i.e. performance counters, head over to adding the Log Analytics agent. The agent collects performance counters and adds them to your existing workspace.
- For on-premises clusters, Azure Monitor logs offers a Gateway (HTTP Forward Proxy) that can be used to send data to Azure Monitor logs. Read more about that in Connecting computers without Internet access to Azure Monitor logs using the Log Analytics gateway.
- Configure automated alerting to aid in detection and diagnostics.
- Get familiarized with the log search and querying features offered as part of Azure Monitor logs.
- For a detailed overview of Azure Monitor logs and what it offers, read What is Azure Monitor logs?.
Feedback
Coming soon: Throughout 2024 we will be phasing out GitHub Issues as the feedback mechanism for content and replacing it with a new feedback system. For more information see: https://aka.ms/ContentUserFeedback.
Submit and view feedback for