C++ Include Diagnostics in Visual Studio
Starting with Visual Studio 17.8, Visual Studio helps you analyze your C++ #include files:
- Displays how often, and where, something from each header file is used.
- Displays the build time for each
#includefile--which helps you identify opportunities to optimize your build time.
Enable C++ Include Diagnostics and CodeLens
The C++ Include Diagnostics feature is off by default. To turn it on, right-click in the code editor to bring up the context menu, and choose Include Directives > Turn #include Diagnostics On.
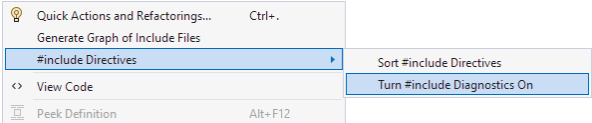
The context menu shows the include directives option highlighted, which reveals two options: Sort # include directives and turn # include diagnostics on.
Information about your #include files is displayed via CodeLens, which is off by default. To turn on the relevant CodeLens settings, navigate to Tools > Options > Text Editor > All Languages > CodeLens and confirm both Show C++ #include references and Show C++ compilation times are enabled.
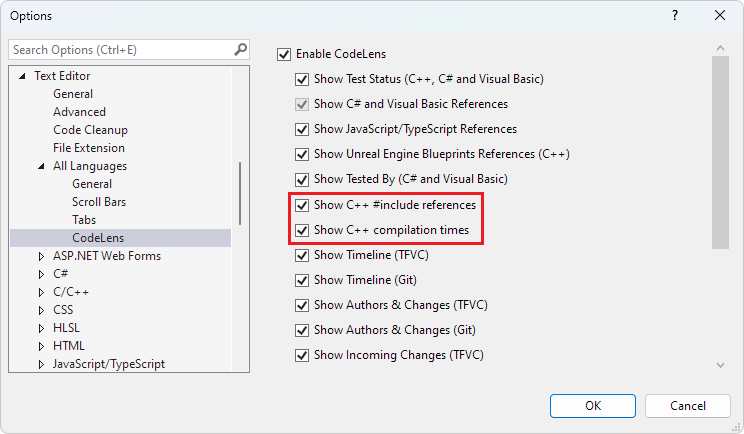
The options window is set to Text Editor > All Languages > CodeLens. The Show C++ # include references and Show C++ compilation times options are highlighted.
View #include references
To try out Include Diagnostics, create a new C++ console project. Replace the contents of the main .cpp file with the following code:
#include <iostream>
#include <vector>

// a function that takes a vector of integers and prints them out
void print(std::vector<int> &vec)
{
    for (int i : vec)
    {
        std::cout << i << std::endl;
    }
    std::cout << std::endl;
}

// a function that takes a vector of integers and adds 10 to each element of the vector and store the result in a new vector
std::vector<int> add10(std::vector<int>& vec)
{
    std::vector<int> newVec;
    for (int i : vec)
    {
        newVec.push_back(i + 10);
    }
    return newVec;
}

int main()
{
    std::vector<int> vec = { 7, 5, 16, 8 };

    print(vec);
    auto newVec = add10(vec);
    print(newVec);
}
When C++ Include Diagnostics are turned on, the number of times code from a header file is referenced in the current code file is displayed above the header file. It looks like this for the previous code sample:
6 references
#include <iostream>
5 references
#include <vector>
In the code editor, select 5 references above #include <vector> and a summary of locations where code from <vector> is used in this file is displayed:
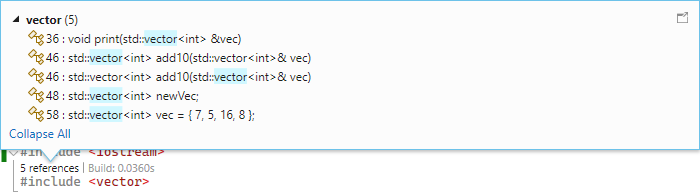
The C++ Include Diagnostics context window shows that there are five places in the code where code from the vector header file is used in the current code file. For example, it's used twice on the definition of the add10 function, as a return value and parameter. It's used on line 17 in the declaration of newVec, and so on.
Select an item to go to its location in your code.
View #include build time
To see the build time for each file you #include, first build using Build Insights.
Turn on Build Insights from the main menu bar by selecting Build > Run Build Insights on Solution > Build. After the build completes, a window appears to list the build times for the various files that are compiled. Return to the source code window, and the build time for each #include file is displayed in CodeLens. It looks similar to this:
6 references | Build: 0.3560s
#include <iostream>
5 references | Build 0.0360s
#include <vector>
If you have an #include directive that is used infrequently, but significantly impacts your compile time, this tool can help you identify it.
In this article, you've seen how to turn on C++ Include Diagnostics and CodeLens, and how to use C++ Include Diagnostics to analyze how often something from an include file is used and how an #include impacts build time.
See also
Feedback
Coming soon: Throughout 2024 we will be phasing out GitHub Issues as the feedback mechanism for content and replacing it with a new feedback system. For more information see: https://aka.ms/ContentUserFeedback.
Submit and view feedback for