Tutorial: Get started with the task mining capability
This tutorial with sample data allows you to experience task mining in the process mining capability. In this tutorial, you will:
- Import a solution
- View sample recordings
- Analyze a process
- Gather insights with a process map
- View metrics with activity combinations and variants
- Identify automation opportunities
For the task mining tutorial, download User recording demo data. For the process mining tutorial, go to Tutorial: Get started with the process mining capability.
Get ready for task mining
Sign in to Power Automate.
Select your environment.
On the navigation pane to the left, select Process mining > Processes.
Import a solution
In this tutorial, you'll import a solution which already has sample recordings.
On the navigation pane to the left, select Solutions.
In the toolbar at the top, select Import solution.
Select Browse.
Download the RPA in a Day .zip file and open it.
Select Next.
Select Import and wait for the solution to import.
View sample recordings
Once you've successfully imported the .zip file, on the navigation pane to the left, select Process mining > All processes below the process cards.
Select the Invoice submission process.
Note
If this is the first time you're accessing the process mining capability, make sure you've selected Processes at least once and waited until the Getting things ready loading spinner has disappeared before importing. If you try to import the RPA in a Day solution without first initializing the Processes section of the process mining capability, you see only a couple of recordings in the imported solution.
You can see some of the existing recordings under Recordings.
To be sure you see the entire list of existing recordings, select See all.
Go back to the Invoice submission process by selecting it from the breadcrumbs at the top of the page.
Explore the features
You'll see the following features:
New recording: Create a new recording.
Analytics: See the process map and insights.
Share: Share your processes with your team members.
Process owners can pick two role options when sharing with other users: contributor and co-owner. The Contributor role gives the user the ability to upload their own recording to the process. The Co-owner role gives the user the ability to upload recordings and edit other recordings.
Analyze: Analyze a process.
Create activity names: Create activity names for your process.
Delete process: Delete your process.
Analyze a process
When you analyze a process, the process mining capability analyzes existing recordings to identify any bottlenecks within the business process.
Select Analyze.
The analysis will take a few minutes to complete. During this process, a status message displays under the New recording button.
If you run into an error during the analysis stage, select Analyze to trigger this action again.
Once it's done, you see the Process analysis status change to Analyzed. Select Analytics to see the process map and insights.
This step may take a couple minutes to complete after the analysis has been performed.
Analytics page layout
This section explains what you can do on the Analytics screen.
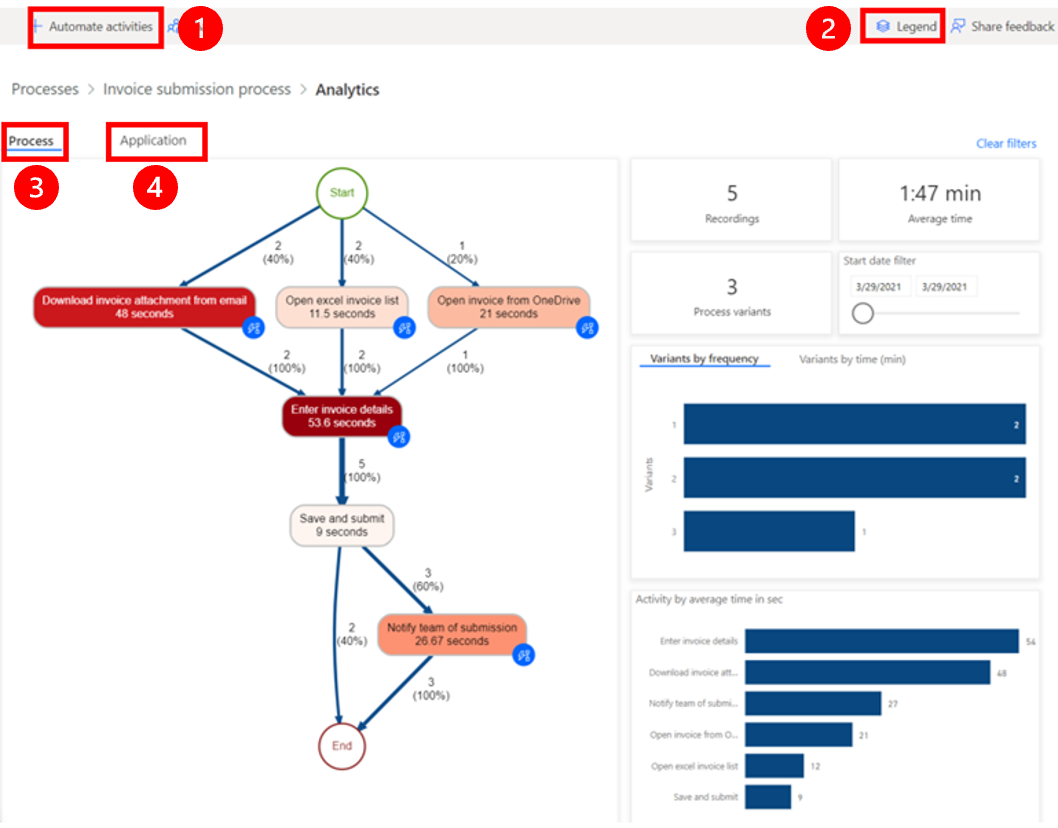
Legend:
Automate activities: To streamline the automation process, you can use the Automate activities feature. This feature detects if the user performed actions using an application that has Power Automate actions available, such as Microsoft Outlook or Excel. Upon selecting Automate activities, a draft Power Automate process containing the relevant actions is generated. The user can then modify and customize the draft process to create the final automated process.
Legend: Additional information about the report, helping them to better understand the visualizations and data presented.
Process: In-depth information about the analyzed process, including the process map, time analytics for each variant and each recording author.
Application: Information about the apps used in recordings. This includes what apps were used by authors, how often were they used, and what the transitions were between them. This report explains which connectors should be used when implementing automation for the process, and where to potentially use desktop flows, as there’s no existing connector.
Business process step relationships
In the previous example, you see the various steps in the business process and their related durations. These steps include:
Download invoice attachment from email (48 seconds)
Open Excel invoice list (11.5 seconds)
Open invoice from OneDrive (21 seconds)
Enter invoice details (53.6 seconds)
Save and submit (9 seconds)
Notify team of submission (26.67 seconds)
Gather insights with a process map
Visualizing and analyzing processes is made possible through the process map. By examining a graphical representation of how business processes are performed, you can gather insights about potential areas for improvement..
Go to the process map by selecting Analytics > Process map.
View metrics with activity combinations and variants
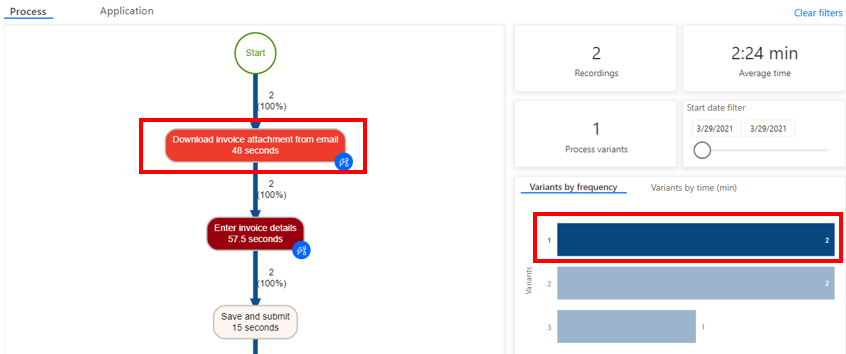
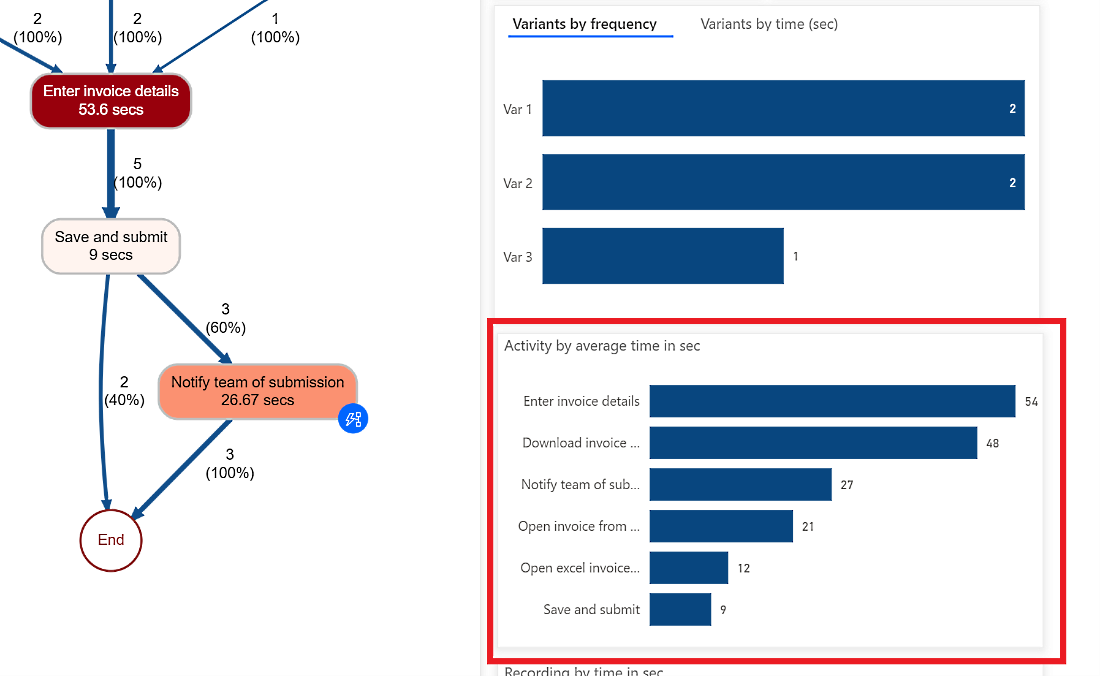
This section explains the Variants by frequency bars on the right panel. The corresponding process map is on the left panel.
On the process map, you can observe various activity combinations and variants that are displayed individually. A process variant represents a distinct sequence from the start to the end of the process. It is like a 'trail' through the process that varies from other variants by at least one activity. The process map also provides additional metrics such as activity frequency and throughput time. Activity frequency indicates the total number of recordings or cases that pass through it. Throughput time measures the duration between the first event of the case and the last event.
By selecting the first bar on the process map, you can view the most frequent process variant, which is the invoice coming through email. It may take some time for any changes to reflect on the chart.
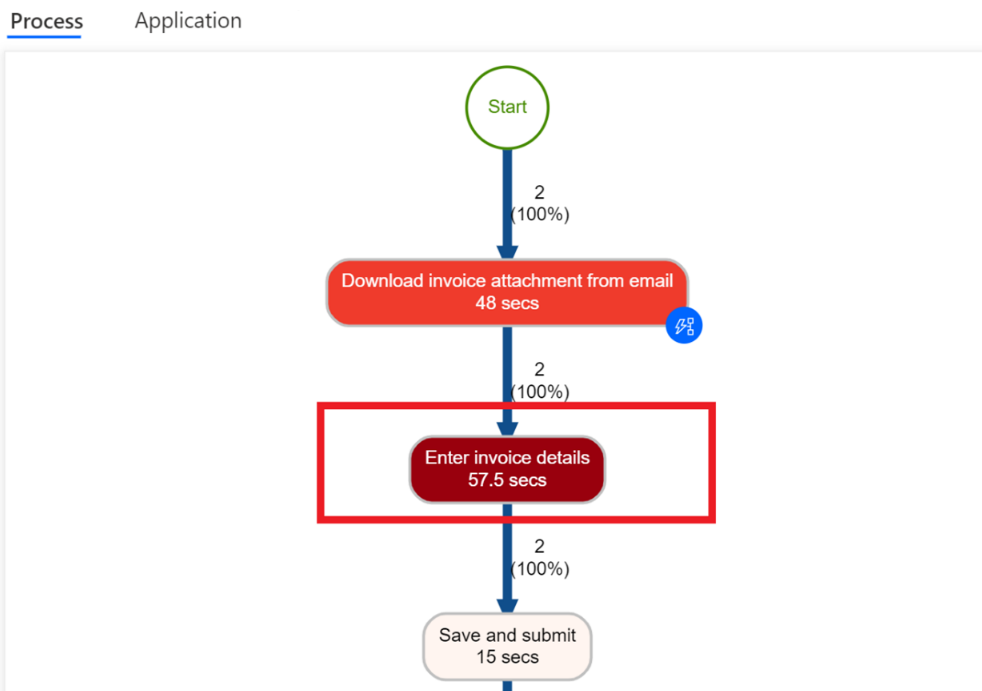
Identify automation opportunities
You can see that people spend a lot of their time entering the information in the application. This helps identify an opportunity to automate the process.
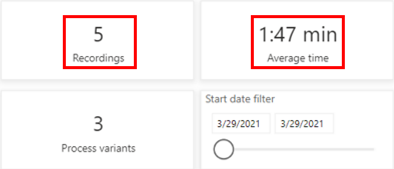
View analytics data
Deselect Var 1 by selecting any blank space within the Variant by frequency area.
Look at the top analytics data. The average process time is 1.47 minutes out of five recordings.
Analyze other time-based metrics dashboards.
Activity by average time in sec: Notice that Enter invoice details and Download invoice are taking the most time.
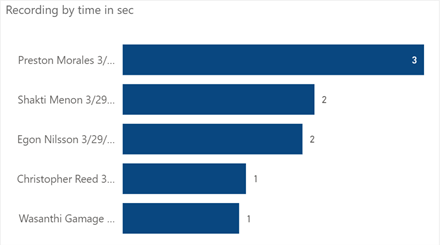
Recording by average time in min: Notice that some people (Preston Morales and Shakti Menon) are taking more time than others.
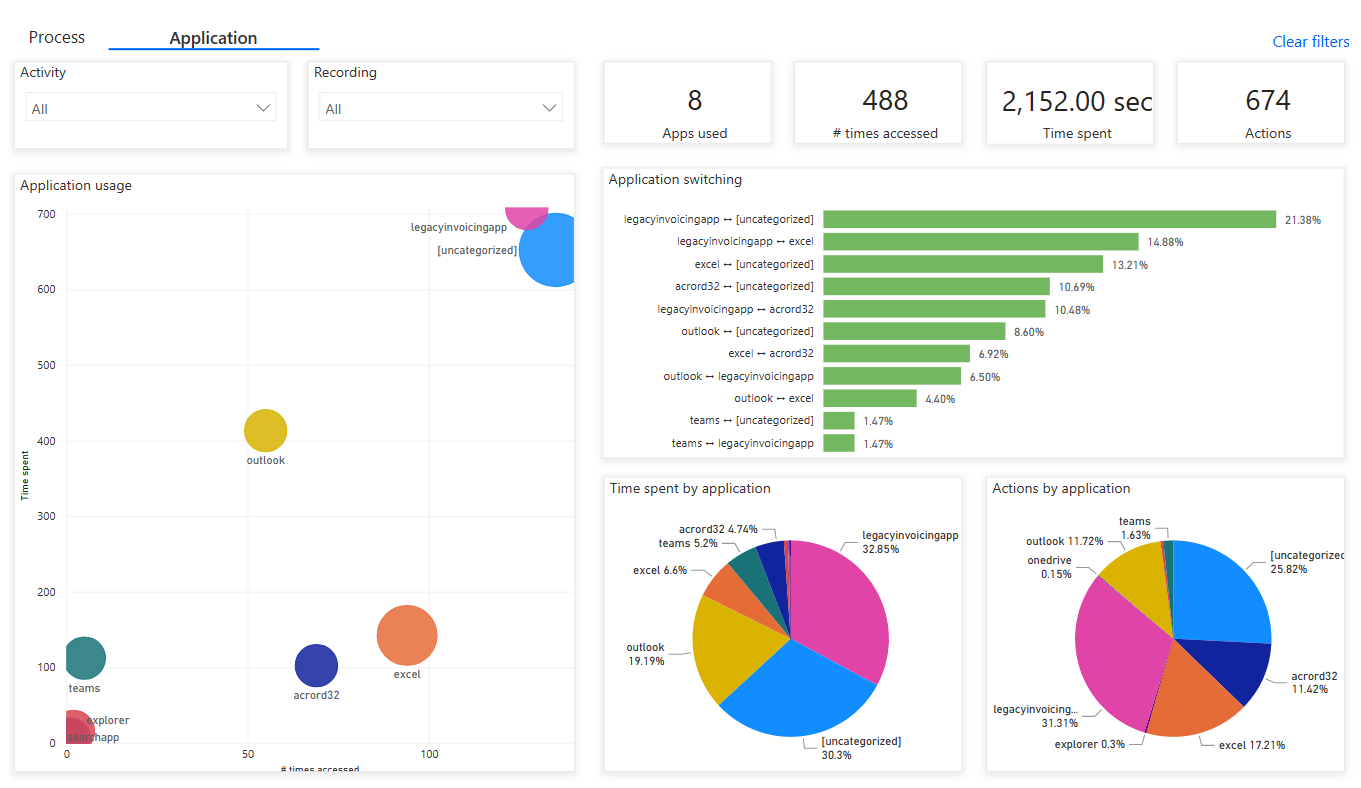
Select the Application tab to see details on which applications were used.
It might take a while to load the reports.
By providing information on the applications utilized in a business process, their frequency of usage, and the amount of time spent on each application, this report is crucial for gaining insights into the process.
For example, the dashboard shows that a legacy invoicing app, Outlook, and Excel have significant contributions to time spent and actions by applications.
Take time to get familiar with the different reports.
Go back to the process map by selecting Process.
Look at the automate activities feature. From the process map, you can see that the process mining capability has highlighted several activities as potential candidates for automation based on applications.
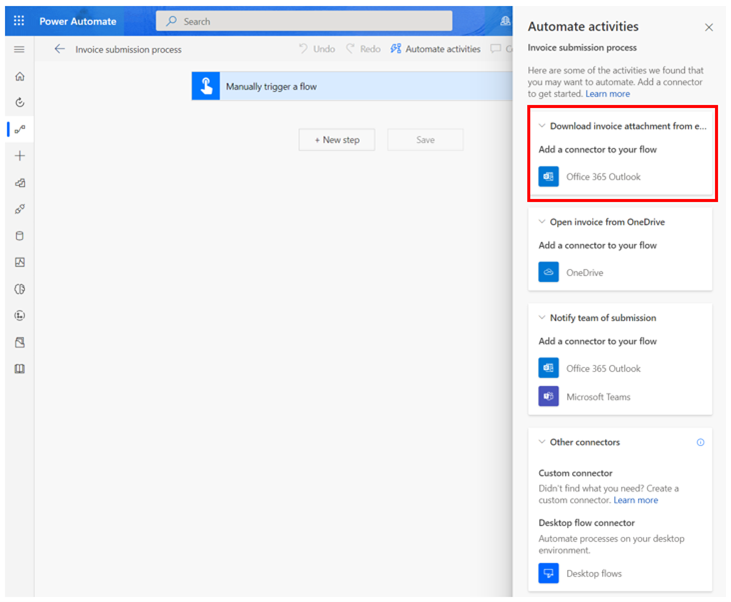
Start to create a flow for automation by selecting Automate activities at the top.
A tab opens in the browser and shows the flow designer. The recommended actions that match to the activities from the process map automatically appear on the right panel. For example, several email connectors are suggested for you to use in order to automate the Download invoice attachment from email activity.
Feedback
Coming soon: Throughout 2024 we will be phasing out GitHub Issues as the feedback mechanism for content and replacing it with a new feedback system. For more information see: https://aka.ms/ContentUserFeedback.
Submit and view feedback for