Create reports in Power BI using accessibility tools
For report creators who use accessibility tools to create reports, Power BI has many built-in capabilities that can help in the process.
This article describes the many types of accessibility tools available for report creators in Power BI Desktop.
App-level navigation
When navigating in Power BI Desktop, you can move focus to the main areas of the app by pressing Ctrl + F6. Shifting focus in the main area of Power BI Desktop progresses in the following order:
- Objects on canvas
- Page tabs
- Panes (each one separately, left to right for open panes)
- View navigator
- Footer
- Sign in
- Yellow warning / error / updates bar
In most cases, the common procedures to use in Power BI are Enter to select or enter an area, and Esc to exit.
Ribbon navigation
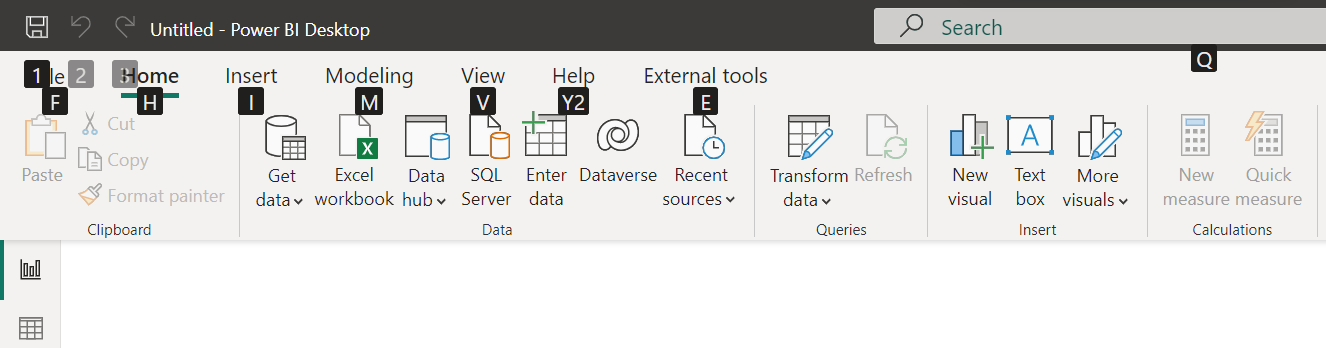
Press Alt to see the little boxes called KeyTips over each command available in the current view of the ribbon. Then you can press the letter shown in the KeyTip that hovers over the command you want to use.
For example, in the following image, the Alt key has been pressed to display KeyTips, which contain the letters for accessible commands. Pressing M opens the Modeling tab on the ribbon.
Depending on which letter you press, you might see other KeyTips. For example, if the Home tab is active and you press V, the View tab is displayed along with the KeyTips for the groups in that View ribbon tab. You can continue pressing letters displayed in KeyTips until you press the letter of the specific command you want to use. To move to the previous set of KeyTips, press Esc. To cancel the action you’re taking and hide the KeyTips, press the Alt key.
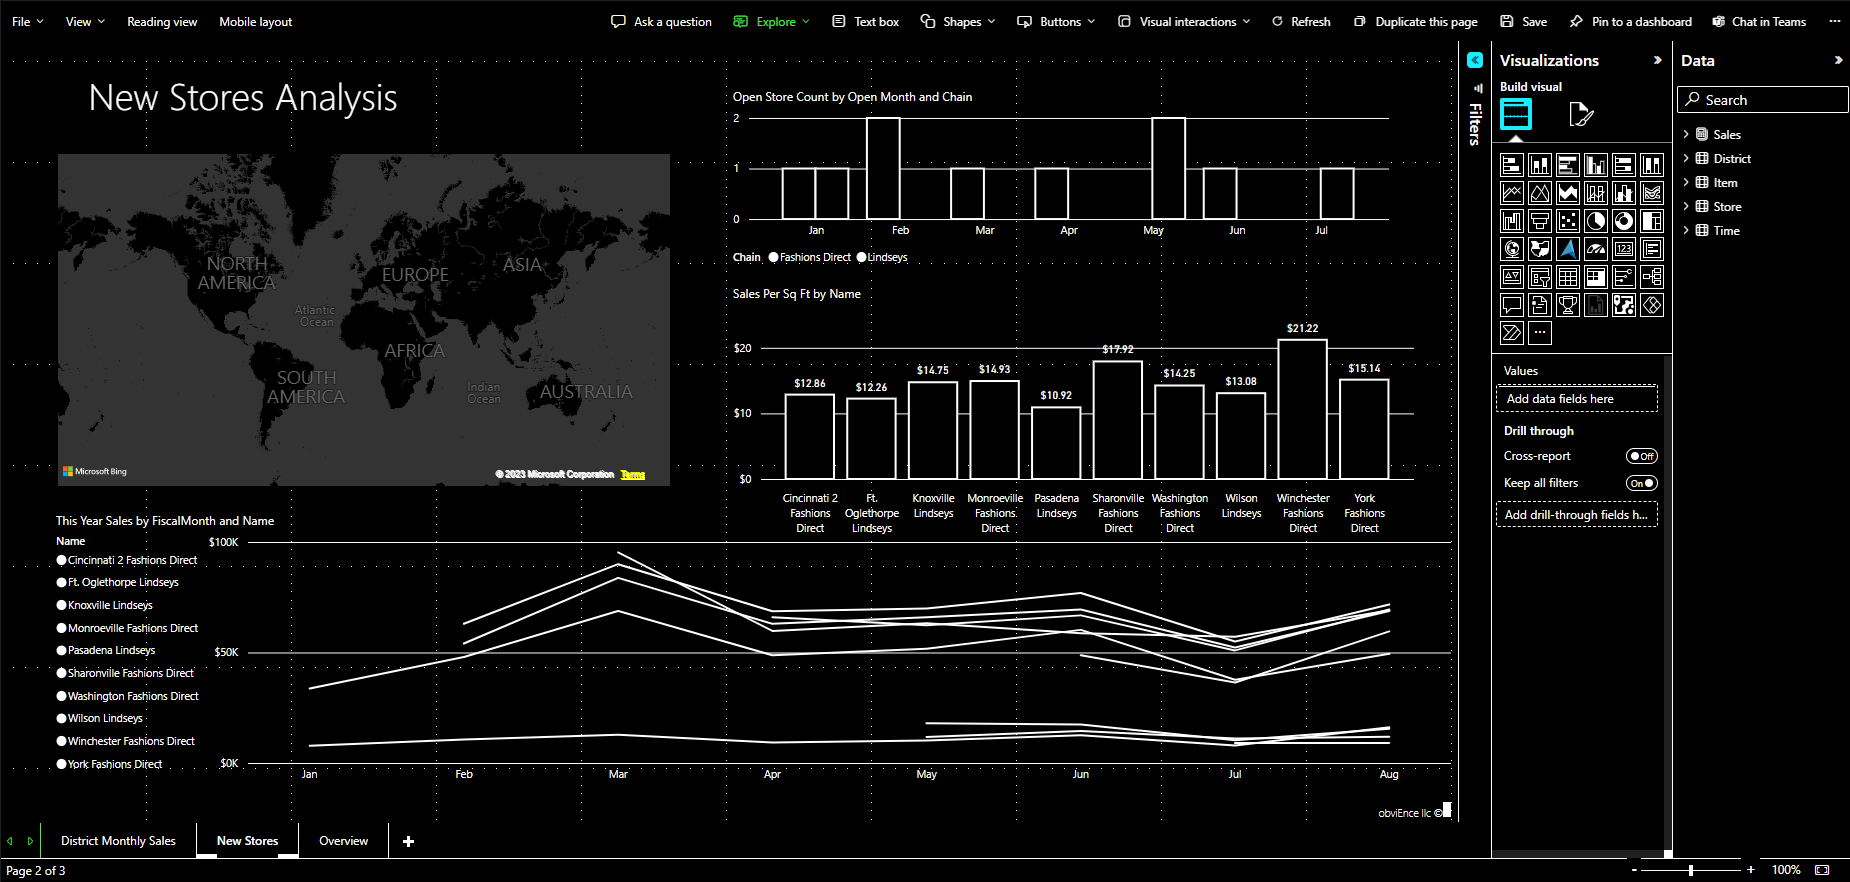
Visual pane navigation
To navigate the Visualizations pane, make sure your focus is on the pane by pressing Ctrl + F6 until you reach that pane. When you navigate through the visualizations pane, the focus first lands on the header. The tab order starts from the top and is shown in the following image:
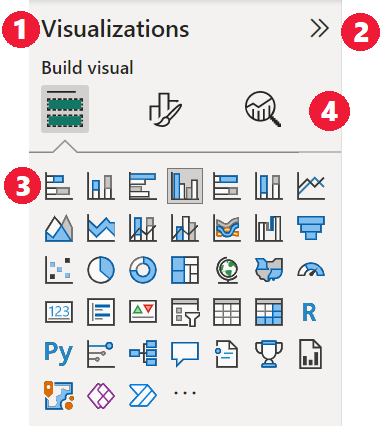
- The header title
- The expand and collapse carat
- The first visual icon
- Pane pivots
When focus is on the pane pivots, tabbing lands only on the icon for the pane that is selected. To switch to other panes, use arrow keys.
When you get to the visuals, you can use arrow keys to navigate to a particular visual and press Enter to select it. A screen reader calls out if you’ve created a new chart and tells you the chart's type. It also tells you when you’ve changed a chart of a particular type to another type.
Fields well
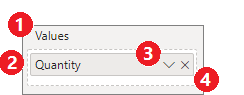
When focus is on the pane pivots, as described in the previous section, pressing tab again advances focus to the Field well.
In the Field well, the focus order moves to:
- Each well's title.
- A given field in each well.
- The dropdown button to open the field menu.
- Then the removal button.
The following image shows this focus progression ordering.
A screen reader reads out the well’s name and its tooltip. For each field in a well, a screen reader reads the field name and its tooltip. If a well is empty, the focus should move to the entire empty well. The screen reader should read the well name, tooltip, and that it's empty.
When the Field menu is open, you can move through it by using Tab or Shift + Tab or the Up and Down arrow keys. A screen reader calls out the option names.
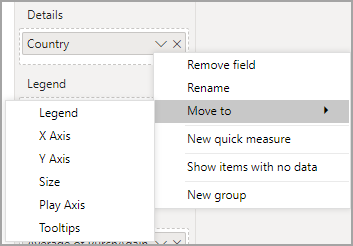
If you’d like to move a field from one bucket in the field well to another bucket, you can use your keyboard and the Move to option in the field well menu, as shown in the following image:
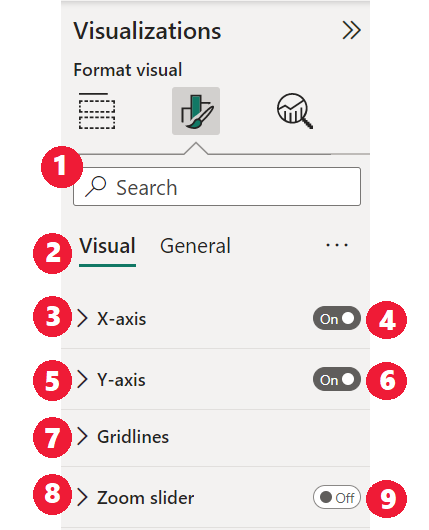
Formatting pane
The focus order for the Formatting pane moves from the top then down in the card order. The focus goes around the card name followed by its On / Off toggle button if one exists. When the focus is on the card name, a screen reader reads out the name of the card and whether the card is expanded or collapsed. You can press Enter to expand or collapse the card. The Enter key also works to switch On or Off the toggle button.
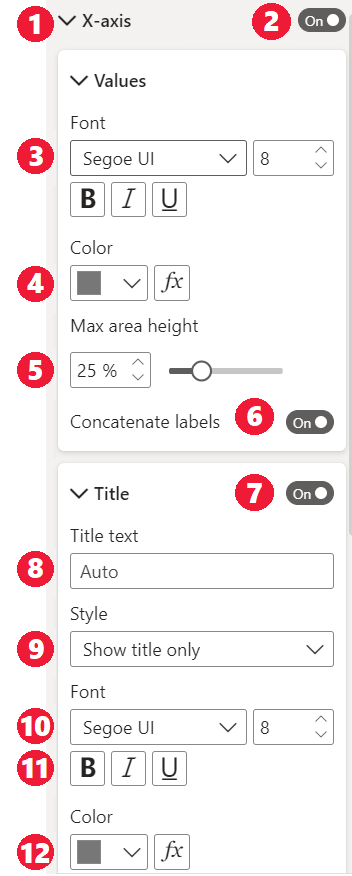
If a card is open, Tab moves through the controls in the card before going on to the next card. For the controls in a card, a screen reader calls out the title, the current value, and the control type.
Data list navigation
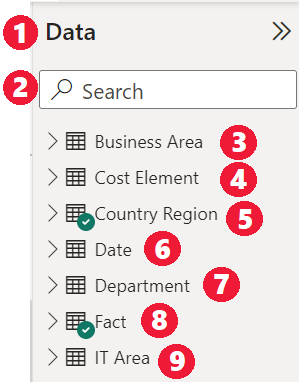
You can press Tab to navigate around the Data list. Similar to the formatting pane, if tables are collapsed the focus order cycles through in the following order:
- The Data list header
- The search bar
- Each table name
To expand all the tables in the Data well, press Alt + Shift + 9. To collapse all the tables press Alt + Shift + 1. To expand a single table, press the Right arrow key. To collapse a single table, press the Left arrow key. Similar to the formatting pane, if a table is expanded, then tabbing and navigating through the fields list includes the fields that are being shown. A screen reader calls out whether you've expanded or collapsed a table.
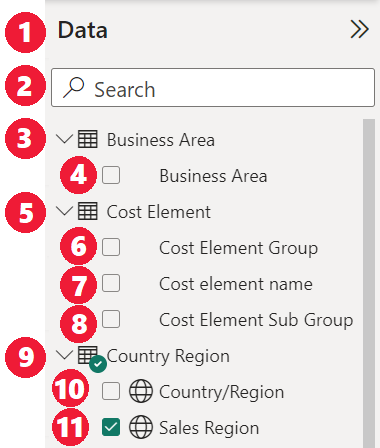
You can checkmark a field by navigating to the desired field and pressing Enter. A screen reader calls out the field the focus is on and whether the field is checked or unchecked.
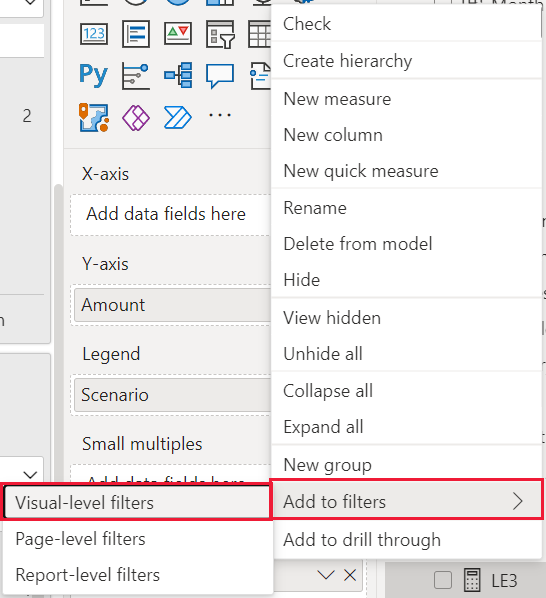
Mouse users typically drag-and-drop fields to the canvas or to the relevant filter buckets they desire. If you’d like to use your keyboard, you can add a field to a filter bucket by entering a field’s context menu by pressing Shift + F10. Then use arrow keys to navigate to Add to filters and press Enter on the type of filter to which you’d like to add the field.
Selection pane navigation
The Selection pane has the following focus order progression:
- Header title
- Collapse carat and the exit button
- Layer and tab order switcher
- Move up in layer button
- Move down in layer button
- Show button
- Hide button
- Objects
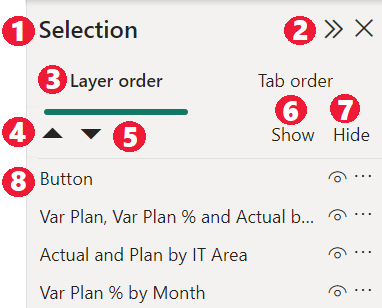
You can tab through the focus order and press Enter to select the element you're interested in.
When you get to the layer and tab order switcher, use the left and right arrow keys to switch between the layer order and tab order.
When you get to the objects in the Selection pane, press F6 to activate the Selection pane. After activating the Selection pane, you can use the Up and Down arrow keys to navigate to the different objects in the Selection pane. Once you’ve navigated to an object of interest, there are a few different actions you can take:
- Press Ctrl + Shift + S to hide or show an object.
- Press Ctrl + Shift + F to move up an object in the layer order.
- Press Ctrl + Shift + B to move an object down in the layer order.
- Press Ctrl + Space to multi-select objects.
Power BI Desktop dialogs
All dialogs in Power BI Desktop are accessible through keyboard navigation and work with screen readers.
Dialogs in Power BI Desktop include:
- Quick Measures dialog
- Conditional Formatting & data bars dialog
- Q&A Explorer dialog
- Getting Started dialog
- File menu and About dialog
- Warning bar
- File Restore dialog
- Frowns dialog
High contrast support
When you use high-contrast modes in Windows, those settings and the palette you select are also applied to reports in Power BI Desktop.
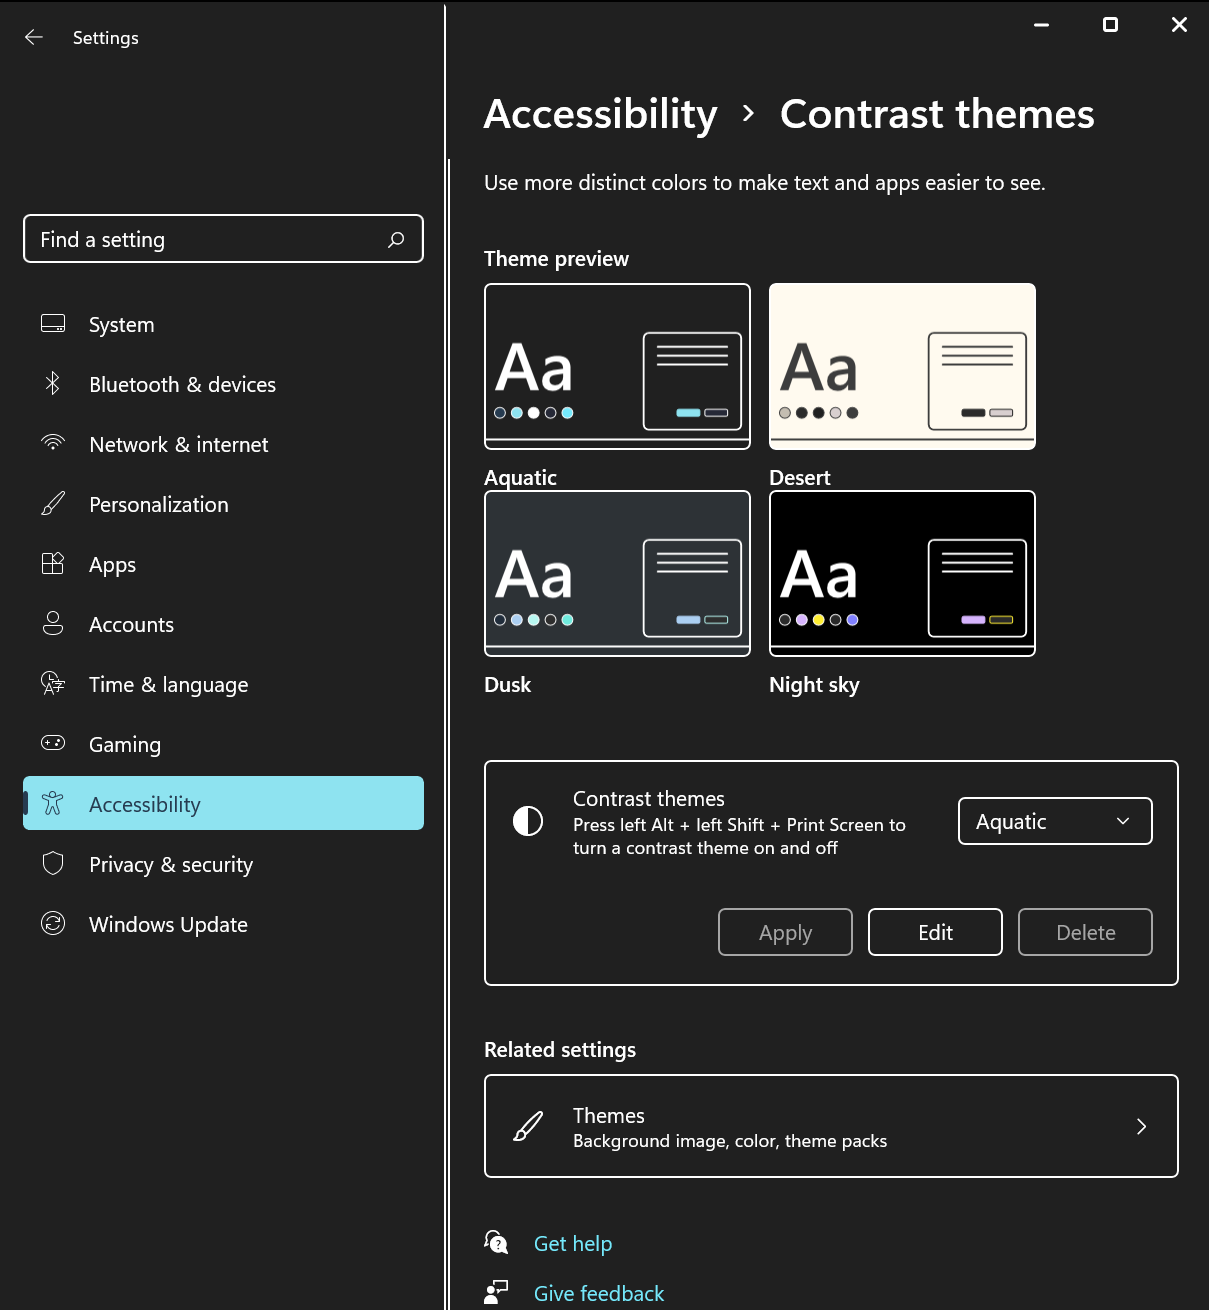
Power BI Desktop automatically detects which high-contrast theme Windows uses and applies those settings to your reports. Those high-contrast colors follow the report when published to the Power BI service or elsewhere.