Compare Power BI Desktop and the Power BI service
Use this article to get a basic overview of Power BI Desktop and the Power BI service. Then use the links provided in the article to expand your knowledge.
Power BI Desktop is a free application that you download and install on your local computer. Desktop is a complete data analysis and report creation tool that is used to connect to, transform, visualize, and analyze your data. It includes the Query Editor, in which you can connect to many different sources of data, and combine them (often called modeling) into a data model. Then you design a report based on that data model. Reports can be shared with others directly or by publishing to the Power BI service. Sharing reports requires a Power BI Pro license. The Power BI Desktop getting started guide walks through the process.
The Power BI service is a cloud-based service, or software as a service (SaaS). It supports report editing and collaboration for teams and organizations. You can connect to data sources in the Power BI service, too, but modeling is limited. The Power BI service is used to do things such as creating dashboards, creating and sharing apps, and analyzing and exploring your data to uncover business insights. What is the Power BI service details many of the capabilities of the Power BI service. Your license determines what you can do in the Power BI service. For more information about licenses, see Power BI licenses and subscriptions.
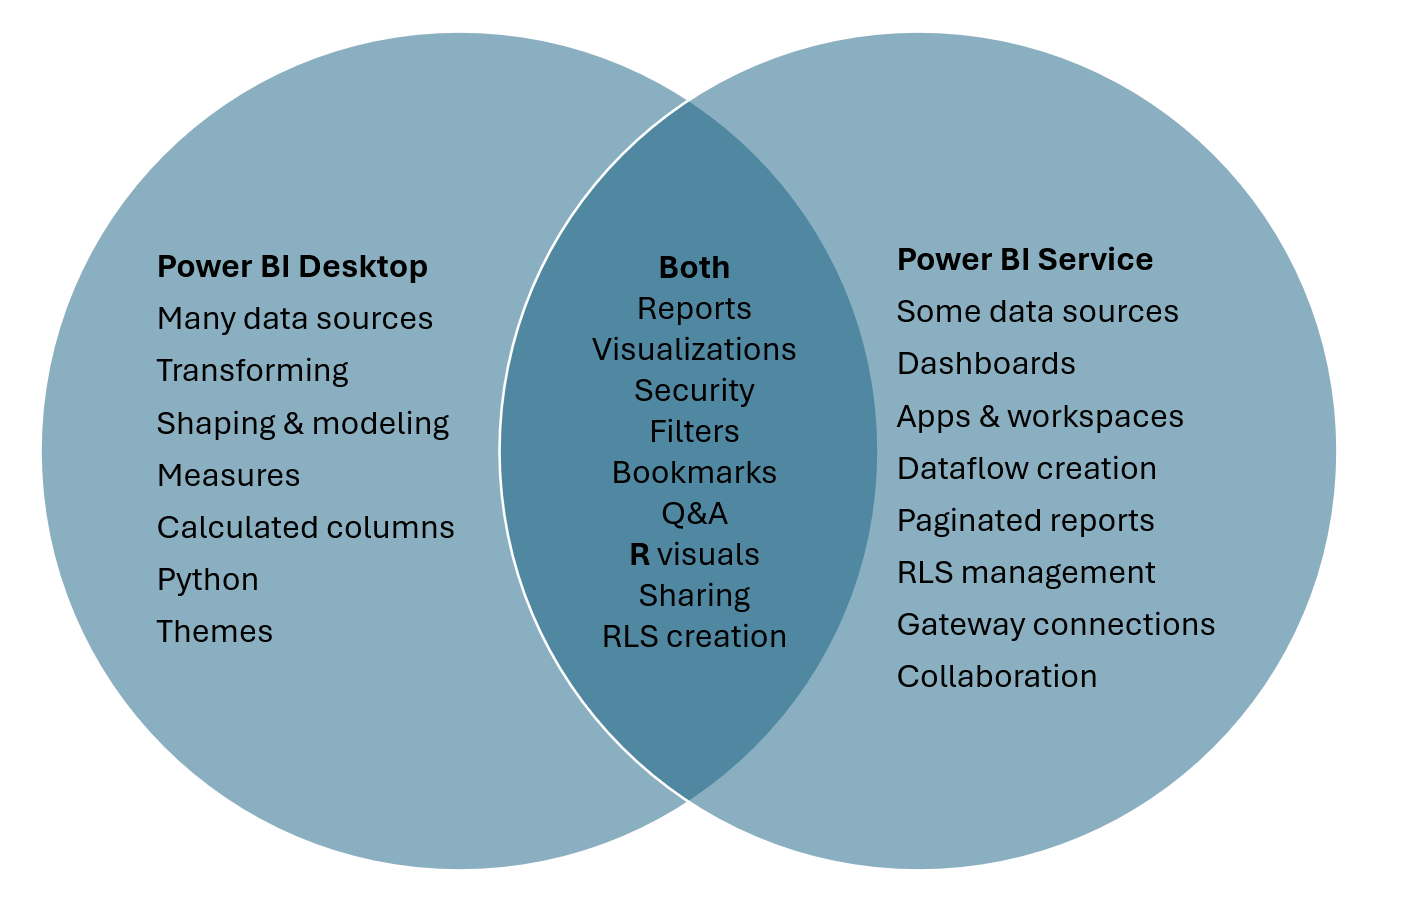
The following Venn diagram compares Power BI Desktop and the Power BI service. The middle shows some of the areas where they overlap. Some tasks you can do in either Power BI Desktop or the service. The two outer sides of the Venn diagram show the features that are unique to either the Desktop application or to the Power BI service.
Workflow example
One typical workflow begins in Desktop. Designers connect to data sources, combine data, clean data, and build a model. Once the model is ready, designers create reports and dashboards and share that content with their colleagues. Sometimes the content is shared directly and other times the content is shared in workspaces and as apps. Business users then use those reports, dashboards, and apps to discover trends and actionable insights. Other business users rely on the shared content to track, monitor, measure, and report out on the state of the business. Everyone is working from a single source of truth, the same semantic model. Work done in the reports, dashboards, and apps doesn't change the underlying data in the semantic model.
The shared content isn't static. You can slice and dice the content discovering insights. You can also build your own dashboards, add filters and slicers, collaborate in workspaces, subscribe to content, export data, set alerts, and reformat reports and visuals with spotlights, color changes, backgrounds, and so much more.
Permissions
When designers share content, they also assign permissions. Those permissions determine what you can do with the content. Someone with a Contributor role has more access than someone with a Viewer role. For example, a Viewer can highlight and filter a report, set alerts, and subscribe to content. And a Contributor can edit a report and change the fields being used to create the visuals.
To learn more about permissions and roles, see Roles in workspaces.
Licenses
In addition to permissions, your license determines what actions you can take with the content. Permissions and licenses work together. For example, a Contributor may have the permissions to share content but unless they also have a paid license, sharing is disabled.
To learn more about licenses, see Power BI licenses and subscriptions.
Capacities
In addition to permissions and licenses, where the content is saved also plays a role in what actions you can take with the content.
To learn more about capacities, see Power BI Premium and capacities.
Related content
Create a report in the Power BI service
More questions? Try the Power BI Community.
Feedback
Coming soon: Throughout 2024 we will be phasing out GitHub Issues as the feedback mechanism for content and replacing it with a new feedback system. For more information see: https://aka.ms/ContentUserFeedback.
Submit and view feedback for