Nurture in the CoE Power BI dashboard
As you establish your Center of Excellence (CoE), a significant part of your activity will be nurturing your maker community, enabling them to follow best practices and working together with them to identify whether they need more support.
The Nurture section helps you find your "star" app and flow makers and see what connectors they're using, where they're based (department/city/country), and how they're adopting Microsoft Power Platform.
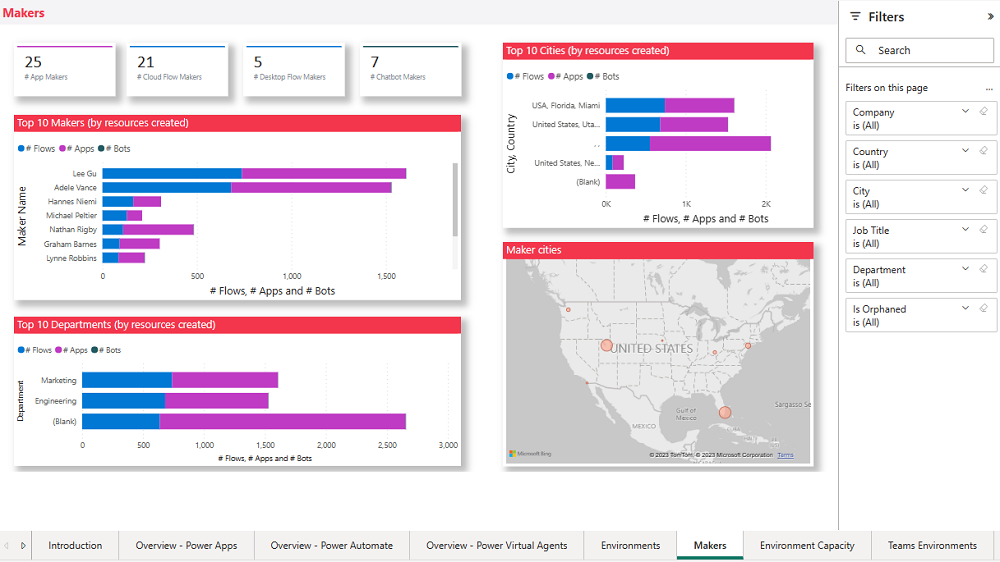
Makers
The Maker page helps you see your top makers, how many apps and flows those makers have created, your top active departments, and where your makers are based.
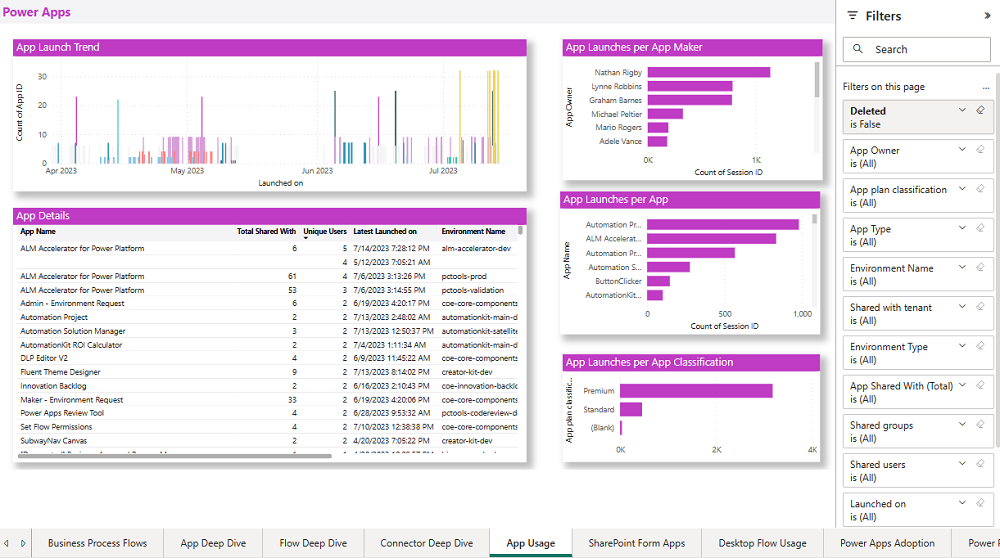
App usage
The App Usage page shows your top apps by number of app launches and your users who most frequently launch apps.
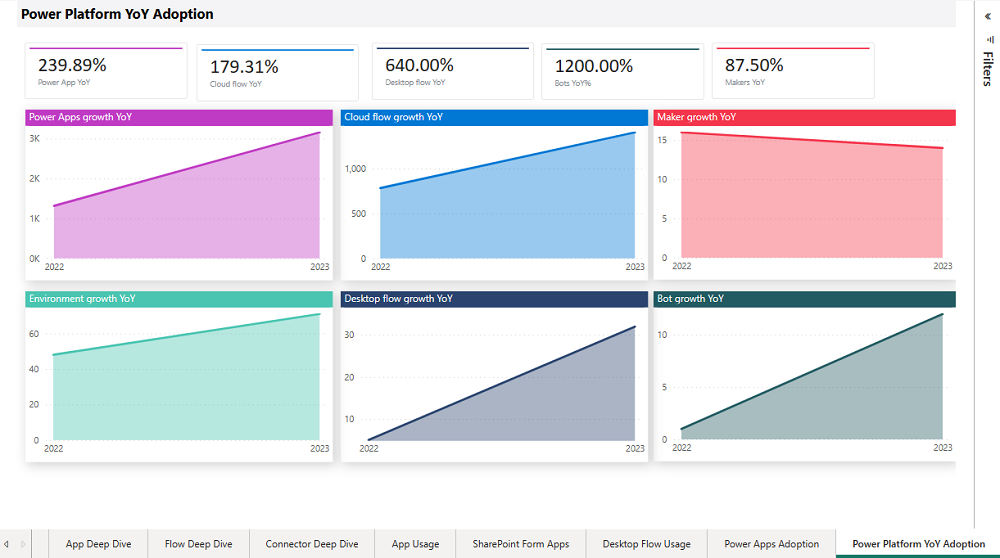
Year-over-year (YoY) adoption
The YoY Adoption page shows your year-over-year adoption of Power Platform. This page highlights growth in number of apps, cloud flows, desktop flows, chatbots, environments, and makers, and shows you the percentage increase or decrease year-on-year.
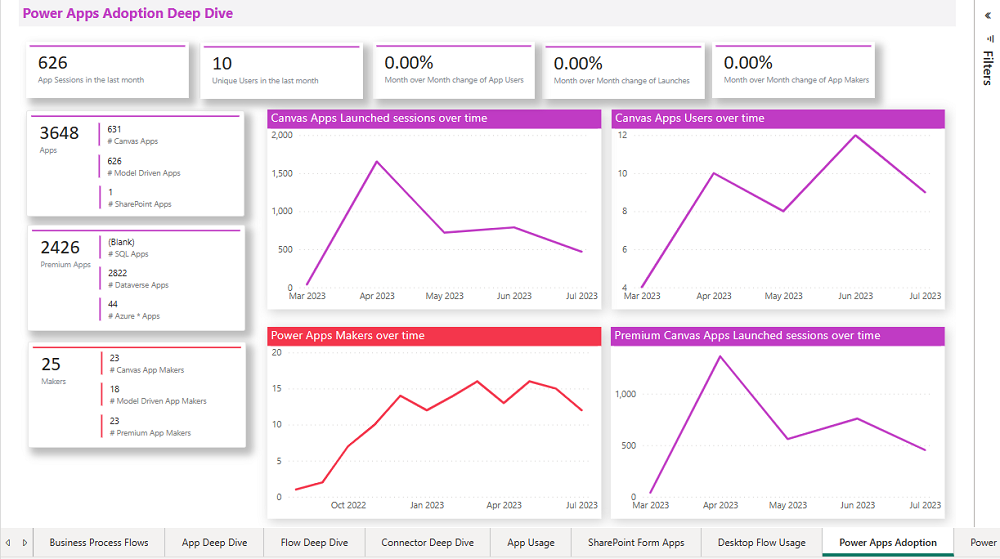
Power Apps adoption
The Power Apps Adoption page shows you further insights into how Power Apps is getting adopted in your organization. This page highlights total and monthly new users, and month-on-month growth of users. This page additionally shows Power Apps monthly active users (MAU) and Premium MAU over time, and the number of apps using Azure, SharePoint, and Dataverse as data sources.
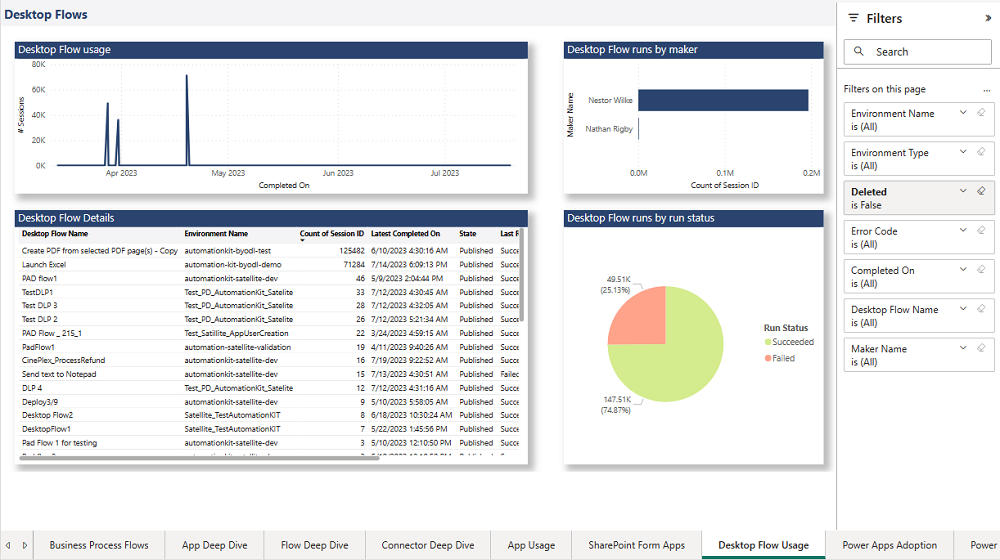
Desktop flows usage
The Desktop flows usage page provides an overview of UI-based robotic process automation (RPA) flow runs in your environment:
- Number of runs per date and desktop flow type
- Total number of runs
- Last run date and status
Filters on this page can help you narrow down this view by desktop flow type, run status, maker, and environment.
Feedback
Coming soon: Throughout 2024 we will be phasing out GitHub Issues as the feedback mechanism for content and replacing it with a new feedback system. For more information see: https://aka.ms/ContentUserFeedback.
Submit and view feedback for