Note
Access to this page requires authorization. You can try signing in or changing directories.
Access to this page requires authorization. You can try changing directories.
Azure IoT Operations
Azure Event Hubs
Azure Data Explorer
Azure Logic Apps
Azure Arc
Azure Managed Grafana
Solution ideas
This article describes a solution idea. Your cloud architect can use this guidance to help visualize the major components for a typical implementation of this architecture. Use this article as a starting point to design a well-architected solution that aligns with your workload's specific requirements.
This solution shows how manufacturers can connect production sites globally to a single industrial IoT platform that supports condition monitoring, overall equipment effectiveness (OEE) calculation, forecasting, and anomaly detection. It uses Azure services and the IEC 62541 Open Platform Communications (OPC) Unified Architecture (UA) standard for operational technology (OT) data, so production sites can interoperate and feed insights back into the production process.
Architecture
The following diagrams show the architecture of the industrial IoT solution:
Simplified architecture that shows both Azure and Microsoft Fabric options:

Detailed architecture that shows the Azure option:

Workflow
This solution uses a production line simulation made up of several stations, using the station OPC UA information model, and a simple manufacturing execution system (MES). Both the stations and the MES are containerized for easy deployment.
You configure the simulation to include two production lines. The default configuration is:
| Production Line | Ideal Cycle Time (in seconds) |
|---|---|
| Munich | 6 |
| Seattle | 10 |
| Shift Name | Start | End |
|---|---|---|
| Morning | 07:00 | 14:00 |
| Afternoon | 15:00 | 22:00 |
| Night | 23:00 | 06:00 |
Note
Shift times are in local time, specifically the time zone the virtual machine (VM) hosting the production line simulation is set to.
The station OPC UA server uses the following OPC UA node IDs for telemetry to the cloud:
i=379- manufactured product serial numberi=385- number of manufactured productsi=391- number of discarded productsi=398- running timei=399- faulty timei=400- status (0=station ready to do work, 1=work in progress, 2=work done and good part manufactured, 3=work done and scrap manufactured, 4=station in fault state)i=406- energy consumptioni=412- ideal cycle timei=418- actual cycle timei=434- pressure
The solution uses a digital feedback loop to manage the pressure in a simulated station. To implement the feedback loop, the solution triggers a command from the cloud on one of the OPC UA servers in the simulation. The trigger activates when simulated time-series pressure data reaches a certain threshold. You can see the pressure of the assembly machine in the Azure Data Explorer dashboard. The pressure is released at regular intervals for the Seattle production line.
Components
- Industrial assets: A set of simulated OPC UA enabled production lines hosted in Docker containers.
- Azure IoT Operations is a unified data plane for the edge. It includes a set of modular, scalable, and highly available data services that run on Azure Arc-enabled edge Kubernetes clusters.
- Data gateway connects your on-premises data sources, such as SAP, to Azure Logic Apps in the cloud.
- Azure Event Hubs is the cloud message broker that receives OPC UA pub/sub messages from edge gateways and stores them until retrieved by subscribers.
- Azure Data Explorer is the time series database and front-end dashboard service for advanced cloud analytics, including built-in anomaly detection and predictions.
- Azure Logic Apps is a cloud platform you can use to create and run automated workflows with little to no code.
- Azure Arc is the cloud service that is used to manage the on-premises Kubernetes cluster at the edge.
- Azure Managed Grafana is a data visualization platform built on top of the Grafana software by Grafana Labs. Grafana is a fully managed service that Microsoft hosts and supports.
- Microsoft Power BI is a collection of SaaS software services, apps, and connectors that work together to turn your unrelated sources of data into coherent, visually immersive, and interactive insights.
- Microsoft Dynamics 365 Field Service is a turnkey SaaS solution for managing field service requests.
- UA Cloud Action is an open-source reference cloud application that queries the Azure Data Explorer for a specific data value. The data value is the pressure in one of the simulated production line machines. It calls UA Cloud Commander via Azure Event Hubs when a certain threshold is reached (4,000 mbar). UA Cloud Commander then calls the OpenPressureReliefValve method on the machine via OPC UA.
- UA Cloud Library is an online store of OPC UA Information Models, hosted by the OPC Foundation.
- WoT-Connectivity Solution is a third-party containerized industrial connectivity solution supporting the WoT-Connectivity interface that translates from proprietary asset interfaces to OPC UA. The solution uses the W3C Web of Things descriptions as the schema to describe the industrial asset interface. Commercial implementations include ProsysOPC Forge and an open-source reference implementation is UA Edge Translator.
Note
In a real-world deployment, something as critical as opening a pressure relief valve would be done on-premises. This example simply demonstrates how to achieve the digital feedback loop.
Scenario details
Manufacturers want to deploy an overall industrial IoT solution on a global scale and connect all of their production sites to this solution to increase efficiencies for each individual production site.
These increased efficiencies lead to faster production and lower energy consumption, which all lead to lowering the cost for the produced goods while increasing their quality in most cases.
The solution must be as efficient as possible and enable all required use cases such as condition monitoring, overall equipment effectiveness (OEE) calculation, forecasting, and anomaly detection. By using the insights gained from these use cases, you can then create a digital feedback loop which can then apply optimizations and other changes to the production processes.
Interoperability is the key to achieving a fast rollout of the solution architecture. The use of open standards such as OPC UA significantly helps to achieve this interoperability.
To complete the steps in this scenario, you need an Azure subscription. If you don't have an Azure subscription, create a free account before you begin.
Install the production line simulation and cloud services
Select the Deploy button to deploy all required resources to your Azure subscription:
The deployment process prompts you to provide a password for the virtual machine (VM) that hosts the production line simulation and the Edge infrastructure. The password should include three of: a lowercase character, an uppercase character, a number, and a special character. The password length must be between 12 and 72 characters.
Note
To reduce cost, the deployment creates a single Linux VM for both the production line simulation and the edge infrastructure. In a production scenario, the production line simulation isn't required, and for the base OS you should use Azure Local.
Run the production line simulation
Use SSH to connect to the deployed VM by using the credentials you provide during the deployment. You might need to enable Just-in-time access in the Azure portal first. Go to the /opt/ManufacturingOntologies-main/Tools/FactorySimulation directory and run the StartSimulation shell script:
sudo ./StartSimulation.sh "<Your Event Hubs connection string>"
<Your Event Hubs connection string> is your Event Hubs namespace connection string. To learn more, see Get an Event Hubs connection string. A connection string looks like: Endpoint=sb://ontologies.servicebus.windows.net/;SharedAccessKeyName=RootManageSharedAccessKey;SharedAccessKey=abcdefgh=
Tip
If the external IP address for some Kubernetes services shows as <pending>, use the following command to assign the external IP address of the traefik service: sudo kubectl patch service <theService> -n <the service's namespace> -p '{"spec": {"type": "LoadBalancer", "externalIPs":["<the traefik external IP address>"]}}'.
UA Cloud Library (hosted by the OPC Foundation)
To read OPC UA Information Models directly from Azure Data Explorer, import the OPC UA nodes defined in an OPC UA Information Model into a table. You can use the imported information for lookup of more metadata within queries.
First, configure an Azure Data Explorer callout policy for the UA Cloud Library by running the following query on your Azure Data Explorer cluster. Before you start, make sure you're a member of the AllDatabasesAdmin role in the cluster. You can configure this role in the Azure portal by navigating to the Permissions page for your Azure Data Explorer cluster.
.alter cluster policy callout @'[{"CalloutType": "webapi","CalloutUriRegex": "uacloudlibrary.opcfoundation.org","CanCall": true}]'
Then, run the following Azure Data Explorer query from the Azure portal. In the query:
- Replace
<INFORMATION_MODEL_IDENTIFIER_FROM_THE_UA_CLOUD_LIBRARY>with the unique ID of the Information Model you want to import from the UA Cloud Library. You can find this ID in the URL of the Information Model's page in the UA Cloud Library. For example, the ID of the station nodeset that this tutorial uses is1627266626. - Replace
<HASHED_CLOUD_LIBRARY_CREDENTIALS>with a basic authorization header hash of your UA Cloud Library credentials. Use a tool such as Basic Auth Header Generator to generate the hash. You can also use the following bash command:echo -n 'username:password' | base64.
let uri='https://uacloudlibrary.opcfoundation.org/infomodel/download/<INFORMATION_MODEL_IDENTIFIER_FROM_THE_UA_CLOUD_LIBRARY>';
let headers=dynamic({'accept':'text/plain', 'Authorization':'Basic <HASHED_CLOUD_LIBRARY_CREDENTIALS>'});
evaluate http_request(uri, headers)
| project title = tostring(ResponseBody.['title']), contributor = tostring(ResponseBody.contributor.name), nodeset = parse_xml(tostring(ResponseBody.nodeset.nodesetXml))
| mv-expand UAVariable=nodeset.UANodeSet.UAVariable
| project-away nodeset
| extend NodeId = UAVariable.['@NodeId'], DisplayName = tostring(UAVariable.DisplayName.['#text']), BrowseName = tostring(UAVariable.['@BrowseName']), DataType = tostring(UAVariable.['@DataType'])
| project-away UAVariable
| take 10000
To view a graphical representation of an OPC UA Information Model, use the Kusto Explorer tool. To render station model, run the following query in Kusto Explorer. For best results, change the Layout option to Grouped and the Labels to name:
let uri='https://uacloudlibrary.opcfoundation.org/infomodel/download/1627266626';
let headers=dynamic({'accept':'text/plain', 'Authorization':'Basic <HASHED_CLOUD_LIBRARY_CREDENTIALS>'});
let variables = evaluate http_request(uri, headers)
    | project title = tostring(ResponseBody.['title']), contributor = tostring(ResponseBody.contributor.name), nodeset = parse_xml(tostring(ResponseBody.nodeset.nodesetXml))
    | mv-expand UAVariable = nodeset.UANodeSet.UAVariable
    | extend NodeId = UAVariable.['@NodeId'], ParentNodeId = UAVariable.['@ParentNodeId'], DisplayName = tostring(UAVariable['DisplayName']), DataType = tostring(UAVariable.['@DataType']), References = tostring(UAVariable.['References'])
    | where References !contains "HasModellingRule"
    | where DisplayName != "InputArguments"
    | project-away nodeset, UAVariable, References;
let objects = evaluate http_request(uri, headers)
    | project title = tostring(ResponseBody.['title']), contributor = tostring(ResponseBody.contributor.name), nodeset = parse_xml(tostring(ResponseBody.nodeset.nodesetXml))
    | mv-expand UAObject = nodeset.UANodeSet.UAObject
    | extend NodeId = UAObject.['@NodeId'], ParentNodeId = UAObject.['@ParentNodeId'], DisplayName = tostring(UAObject['DisplayName']), References = tostring(UAObject.['References'])
    | where References !contains "HasModellingRule"
    | project-away nodeset, UAObject, References;
let nodes = variables
    | project source = tostring(NodeId), target = tostring(ParentNodeId), name = tostring(DisplayName)
    | join kind=fullouter (objects
        | project source = tostring(NodeId), target = tostring(ParentNodeId), name = tostring(DisplayName)) on source
        | project source = coalesce(source, source1), target = coalesce(target, target1), name = coalesce(name, name1);
let edges = nodes;
edges
    | make-graph source --> target with nodes on source

Deploy Azure IoT Operations on the edge
You can use Azure IoT Operations on the edge. Azure IoT Operations is a unified data plane for the edge. It includes a set of modular, scalable, and highly available data services that run on Azure Arc-enabled edge Kubernetes clusters.
Follow these steps in Azure IoT Operations deployment details.
You can configure your Azure IoT Operations deployment by using the operations experience web UI. Add the asset endpoints, assets, and data flows to process the data from the production line simulation and route it to the data hub in your Event Hubs namespace.
In your Azure IoT Operations deployment, create asset endpoints that define connections to the following OPC UA servers in the production simulation:
opc.tcp://assembly.munich/opc.tcp://test.munich/opc.tcp://packaging.munich/opc.tcp://assembly.seattle/opc.tcp://test.seattle/opc.tcp://packaging.seattle/
Use cases for condition monitoring, OEE calculation, anomaly detection, and predictions in Azure Data Explorer
To learn how to create no-code dashboards for condition monitoring, yield or maintenance predictions, or anomaly detection, see the Azure Data Explorer documentation. You can also deploy a sample dashboard. To learn how to deploy a dashboard, see Visualize data with Azure Data Explorer dashboards > create from file. After you import the dashboard, update its data source. Specify the HTTPS endpoint of your Azure Data Explorer server cluster in the top-right corner of the dashboard. The HTTPS endpoint looks like: https://<ADXInstanceName>.<AzureRegion>.kusto.windows.net/.

Note
To display the OEE for a specific shift, select Custom Time Range in the Time Range drop-down in the top-left corner of the Azure Data Explorer Dashboard and enter the date and time from start to end of the shift you're interested in.
Render the built-in Unified NameSpace (UNS) and ISA-95 model graph in Kusto Explorer
This solution implements a Unified Namespace (UNS), based on the OPC UA metadata sent to the Azure Data Explorer time-series database in the cloud. This OPC UA metadata includes the ISA-95 asset hierarchy. You can visualize the resulting graph in the Kusto Explorer tool.
Add a new connection to your Azure Data Explorer instance and then run the following query in Kusto Explorer:
let edges = opcua_metadata_lkv
| project source = DisplayName, target = Workcell
| join kind=fullouter (opcua_metadata_lkv
    | project source = Workcell, target = Line) on source
    | join kind=fullouter (opcua_metadata_lkv
        | project source = Line, target = Area) on source
        | join kind=fullouter (opcua_metadata_lkv
            | project source = Area, target = Site) on source
            | join kind=fullouter (opcua_metadata_lkv
                | project source = Site, target = Enterprise) on source
                | project source = coalesce(source, source1, source2, source3, source4), target = coalesce(target, target1, target2, target3, target4);
let nodes = opcua_metadata_lkv;
edges | make-graph source --> target with nodes on DisplayName
For best results, change the Layout option to Grouped.

Use Azure Managed Grafana
You can also use Azure Managed Grafana to create a dashboard on Azure for the solution described in this article. Use Grafana within manufacturing to create dashboards that display real-time data. The following steps show you how to enable Grafana on Azure and create a dashboard with the simulated production line data from Azure Data Explorer.
Enable the Azure Managed Grafana service
To create an Azure Managed Grafana service and configure it with permissions to access the ontologies database:
In the Azure portal, search for Grafana, and then select the Azure Managed Grafana service.
To create the service, on Create Grafana Workspace enter a name for your instance. Choose all the default options.
After the service is created, make sure your Grafana instance has a system assigned managed identity. In the Azure portal, go to the Identity blade of your Azure Managed Grafana instance. If the system assigned managed identity isn't enabled, enable it. Make a note of the Object (principal) ID value, you need it later.
To grant permission for the managed identity to access the ontologies database in Azure Data Explorer:
- Go to the Permissions blade in your Azure Data Explorer instance in the Azure portal.
- Select Add > AllDatabasesViewer.
- Search for and select the Object (principal) ID value you noted previously.
Add a new data source in Grafana
Add a new data source to connect to Azure Data Explorer. In this sample, use a system assigned managed identity to connect to Azure Data Explorer. To configure the authentication, follow these steps:
To add the data source in Grafana, follow these steps:
Go to the endpoint URL for your Grafana instance. You can find the endpoint URL in the Azure Managed Grafana page for your instance in the Azure portal. Then sign in to your Grafana instance.
In the Grafana dashboard, select Connections > Data sources, and then select Add new data source. Scroll down and select Azure Data Explorer Datasource.
Choose Managed Identity as the authentication menu. Then add the URL of your Azure Data Explorer cluster. You can find the URL in the Azure Data Explorer instance menu in the Azure portal under URI.
Select Save and test to verify the datasource connection.
Import a sample dashboard
Now you're ready to import the sample dashboard.
Download the Sample Grafana Manufacturing Dashboard dashboard.
In the Grafana menu, go to Dashboards and then select New > Import.
Select Upload dashboard JSON file and select the samplegrafanadashboard.json file that you downloaded previously. Select Import.
On the OEE Station panel, select Edit and then select the Azure Data Explorer Data source you set up previously. Then select KQL in the query panel and add the following query:
print round (CalculateOEEForStation('${Station}', '${Location}', '${CycleTime}', '${__from:date:iso}', '${__to:date:iso}') * 100, 2). Select Apply to apply your changes and go back to the dashboard.On the OEE Line panel, select Edit and then select the Azure Data Explorer Data source you set up previously. Then select KQL in the query panel and add the following query:
print round(CalculateOEEForLine('${Location}', '${CycleTime}', '${__from:date:iso}', '${__to:date:iso}') * 100, 2). Select Apply to apply your changes and go back to the dashboard.On the Discarded products panel, select Edit and then select the Azure Data Explorer Data source you set up previously. Then select KQL in the query panel and add the following query:
opcua_metadata_lkv| where Name contains '${Station}'| where Name contains '${Location}'| join kind=inner (opcua_telemetry| where Name == "NumberOfDiscardedProducts"| where Timestamp > todatetime('${__from:date:iso}') and Timestamp < todatetime('${__to:date:iso}')) on DataSetWriterID| extend numProd = toint(Value)| summarize max(numProd). Select Apply to apply your changes and go back to the dashboard.On the Manufactured products panel, select Edit and then select the Azure Data Explorer Data source you set up previously. Then select KQL in the query panel and add the following query:
opcua_metadata_lkv| where Name contains '${Station}'| where Name contains '${Location}'| join kind=inner (opcua_telemetry| where Name == "NumberOfManufacturedProducts"| where Timestamp > todatetime('${__from:date:iso}') and Timestamp < todatetime('${__to:date:iso}')) on DataSetWriterID| extend numProd = toint(Value)| summarize max(numProd). Select Apply to apply your changes and go back to the dashboard.On the Energy Consumption panel, select Edit and then select the Azure Data Explorer Data source you set up previously. Then select KQL in the query panel and add the following query:
opcua_metadata_lkv| where Name contains '${Station}'| where Name contains '${Location}'| join kind=inner (opcua_telemetry | where Name == "Pressure" | where Timestamp > todatetime('${__from:date:iso}') and Timestamp < todatetime('${__to:date:iso}')) on DataSetWriterID| extend energy = todouble(Value)| summarize avg(energy)); print round(toscalar(averageEnergyConsumption) * 1000, 2). Select Apply to apply your changes and go back to the dashboard.On the Pressure panel, select Edit and then select the Azure Data Explorer Data source you set up previously. Then select KQL in the query panel and add the following query:
opcua_metadata_lkv| where Name contains '${Station}'| where Name contains '${Location}'| join kind=inner (opcua_telemetry | where Name == "Pressure" | where Timestamp > todatetime('${__from:date:iso}') and Timestamp < todatetime('${__to:date:iso}')) on DataSetWriterID| extend NodeValue = toint(Value)| project Timestamp1, NodeValue. Select Apply to apply your changes and go back to the dashboard.
Configure alerts
In Grafana, you can also create alerts. In this example, you create a low OEE alert for one of the production lines.
In the Grafana menu, go to Alerting > Alert rules.
Select New alert rule.
Enter a name for your alert, and select Azure Data Explorer as the data source. In the Define query and alert condition pane, select KQL.
In the query field, enter the following query. This example uses the Seattle production line:
let oee = CalculateOEEForStation("assembly", "seattle", 10000, now(), now(-1h));
print round(oee * 100, 2)
Select Set as alert condition.
Scroll down to the Expressions section. Delete the Reduce expression, you don't need it.
For the alert threshold, select A as Input. Select IS BELOW and enter 10.
Scroll down to the Set evaluation behavior section. Create a new Folder to save your alerts. Create a new Evaluation group and specify 2m.
Select the Save rule and exit button in the upper right.
In the overview of your alerts, you can now see that an alert is triggered when your OEE is less than 10.
Connect the solution to Microsoft Power BI
To connect the solution Power BI, you need access to a Power BI subscription.
To create the Power BI dashboard, complete the following steps:
Install the Power BI desktop app.
Sign in to the Power BI desktop app using the user with access to the Power BI subscription.
In the Azure portal, navigate to your Azure Data Explorer database called ontologies and add Database Admin permissions to a Microsoft Entra ID user with access to only the subscription used for your deployed instance of this solution. If necessary, create a new user in Microsoft Entra ID.
From Power BI, create a new report and select Azure Data Explorer time-series data as a data source: Get data > Azure > Azure Data Explorer (Kusto).
In the popup window, enter the Azure Data Explorer endpoint of your cluster (
https://<your cluster name>.<location>.kusto.windows.net), the database name (ontologies), and the following query:let _startTime = ago(1h); let _endTime = now(); opcua_metadata_lkv | where Name contains "assembly" | where Name contains "munich" | join kind=inner (opcua_telemetry | where Name == "ActualCycleTime" | where Timestamp > _startTime and Timestamp < _endTime ) on DataSetWriterID | extend NodeValue = todouble(Value) | project Timestamp, NodeValueSign in to Azure Data Explorer using the Microsoft Entra ID user you gave permission to access the Azure Data Explorer database previously.
Note
If the Timestamp column contains the same value for all rows, modify the last line of the query as follows:
| project Timestamp1, NodeValue.Select Load. This action imports the actual cycle time of the Assembly station of the Munich production line for the last hour.
From the
Table view, select the NodeValue column and select Don't summarize in the Summarization menu item.Switch to the
Report view.Under Visualizations, select the Line Chart visualization.
Under Visualizations, move the
Timestampfrom theDatasource to theX-axis, select it, and select Timestamp.Under Visualizations, move the
NodeValuefrom theDatasource to theY-axis, select it, and select Median.Save your new report.
Tip
Use the same approach to add other data from Azure Data Explorer to your report.

Connect the solution to Microsoft Dynamics 365 Field Service
This integration showcases the following scenarios:
- Upload assets from the manufacturing ontologies solution to Dynamics 365 Field Service.
- Create alerts in Dynamics 365 Field Service when a certain threshold on manufacturing ontologies solution telemetry data is reached.
The integration uses Azure Logic Apps. With Logic Apps, you can use no-code workflows to connect business-critcal apps and services. This example shows you how to fetch data from Azure Data Explorer and trigger actions in Dynamics 365 Field Service.
If you're not already a Dynamics 365 Field Service customer, activate a 30 day trial.
Tip
To avoid the need to configure cross-tenant authentication, use the same Microsoft Entra ID that you used to deploy the manufacturing ontologies solution.
Create an Azure Logic Apps workflow to create assets in Dynamics 365 Field Service
To upload assets from the manufacturing ontologies solution into Dynamics 365 Field Service:
Go to the Azure portal and create a new logic app resource.
Give the Azure Logic Apps a name, and place it in the same resource group as the manufacturing ontologies solution.
Select Workflows.
Give your workflow a name. For this scenario, use the stateful state type because assets aren't flows of data.
In the workflow designer, select Add a trigger. Create a Recurrence trigger to run every day. You can change the trigger to occur more frequently.
Add an action after the recurrence trigger. In Add an action, search for
Azure Data Explorerand select the Run KQL query command. Leave the default authentication OAuth. Enter your Azure Data Explorer cluster URL andontologiesas the database name. In this query, you check what kind of assets you have. Use the following query to get assets from the manufacturing ontologies solution:opcua_telemetry | join kind=inner ( opcua_metadata | distinct Name, DataSetWriterID | extend AssetList = split(Name, ';') | extend AssetName = tostring(AssetList[0]) ) on DataSetWriterID | project AssetName | summarize by AssetNameTo get your asset data into Dynamics 365 Field Service, you need to connect to Microsoft Dataverse. In Add an action, search for
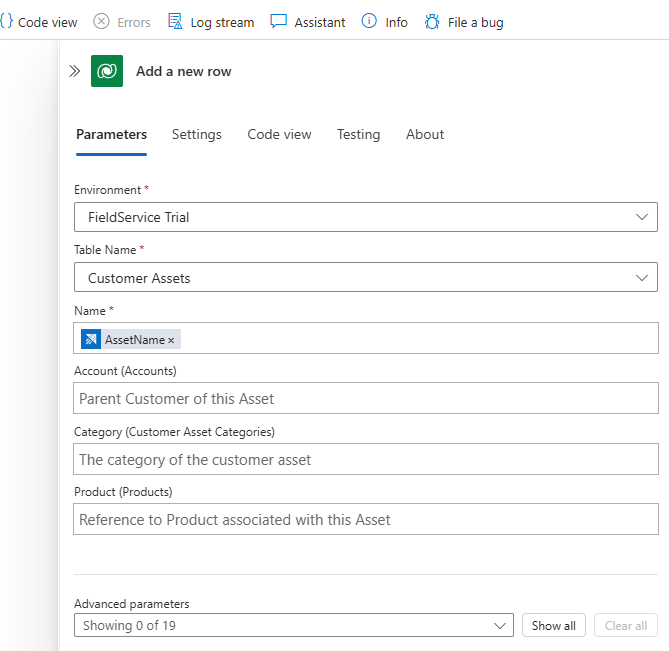
Dataverseand select the Add a new row command. Leave the default authentication OAuth. Connect to your Dynamics 365 Field Service instance and use the following configuration:- In the Table Name field, select Customer Assets
- In the Name field, select Enter data from a previous step, and the select AssetName.
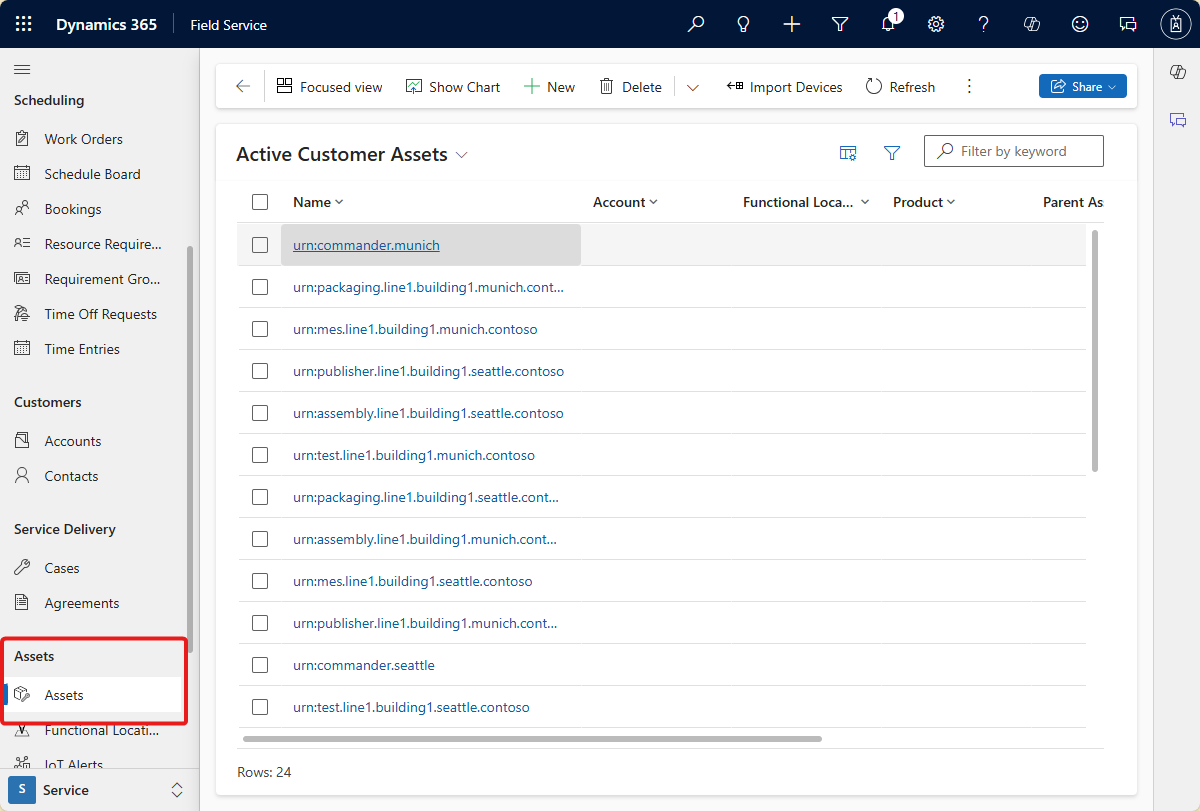
Save your workflow and run it. You can see the new assets are created in Dynamics 365 Field Service:


Create an Azure Logic Apps workflow to create alerts in Dynamics 365 Field service
This workflow creates alerts in Dynamics 365 Field Service, when the FaultyTime for an asset in the manufacturing ontologies solution reaches a threshold.
To fetch the data, create an Azure Data Explorer function. In the Azure Data Explorer query panel in the Azure portal, run the following code to create a
FaultyFieldAssetsfunction in the ontologies database:.create-or-alter function FaultyFieldAssets() { let Lw_start = ago(3d); opcua_telemetry | where Name == 'FaultyTime' and Value > 0 and Timestamp between (Lw_start .. now()) | join kind=inner ( opcua_metadata | extend AssetList =split (Name, ';') | extend AssetName=AssetList[0] ) on DataSetWriterID | project AssetName, Name, Value, Timestamp}Create a new stateful workflow in your Logic App.
In the workflow designer, create a recurrence trigger that runs every three minutes. Then add an action and select the Run KQL query action.
Enter your Azure Data Explorer Cluster URL, then enter ontologies as the database name and use the
FaultyFieldAssetsfunction name as the query.To get your asset data into Dynamics 365 Field Service, you need to connect to Microsoft Dataverse. In Add an action, search for
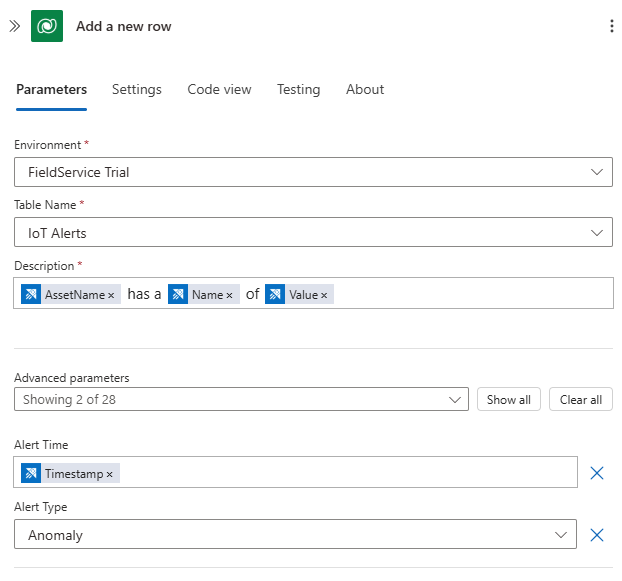
Dataverseand select the Add a new row command. Leave the default authentication OAuth. Connect to your Dynamics 365 Field Service instance and use the following configuration:- In the Table Name field, select IoT Alerts
- In the Description field, use Enter data from a previous step, to build a message "[AssetName] has a [Name] of [Value]". AssetName, Name, and Value are the fields from the previous step.
- In the Alert Time field, select Enter data from a previous step, and the select Timestamp.
- In the Alert Type field, select Anomaly.
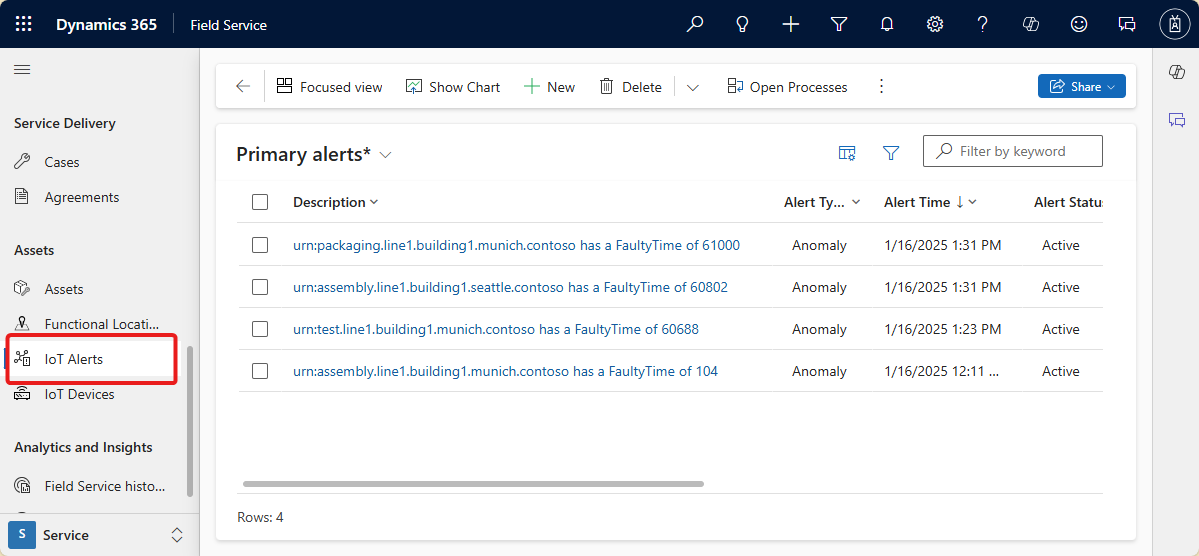
Run the workflow and to see new alerts generated in your Dynamics 365 Field Service IoT Alerts dashboard:


Potential use cases
- Condition monitoring
- Overall equipment effectiveness (OEE) calculation
- Forecasting
- Anomaly detection
Contributors
Microsoft maintains this article. The following contributors wrote this article.
Principal authors:
- Erich Barnstedt | Senior Director & Architect, Industrial Standards, Corporate Standards Group
To see nonpublic LinkedIn profiles, sign in to LinkedIn.
Next steps
- Connect on-premises SAP systems to Azure
- Enable an industrial dataspace on Azure
- Connect Microsoft Fabric to the solution
- Connect Azure Databricks to the solution