Create or edit a log search alert rule
This article shows you how to create a new log search alert rule or edit an existing log search alert rule in Azure Monitor. To learn more about alerts, see the alerts overview.
Alert rules combine the resources to be monitored, the monitoring data from the resource, and the conditions that you want to trigger the alert. You can then define action groups and alert processing rules to determine what happens when an alert is triggered.
Alerts triggered by these alert rules contain a payload that uses the common alert schema.
Prerequisites
To create or edit an alert rule, you must have the following permissions:
- Read permission on the target resource of the alert rule.
- Write permission on the resource group in which the alert rule is created. If you're creating the alert rule from the Azure portal, the alert rule is created by default in the same resource group in which the target resource resides.
- Read permission on any action group associated to the alert rule, if applicable.
Access the alert rule wizard in the Azure portal
There are multiple ways to create or edit an alert rule.
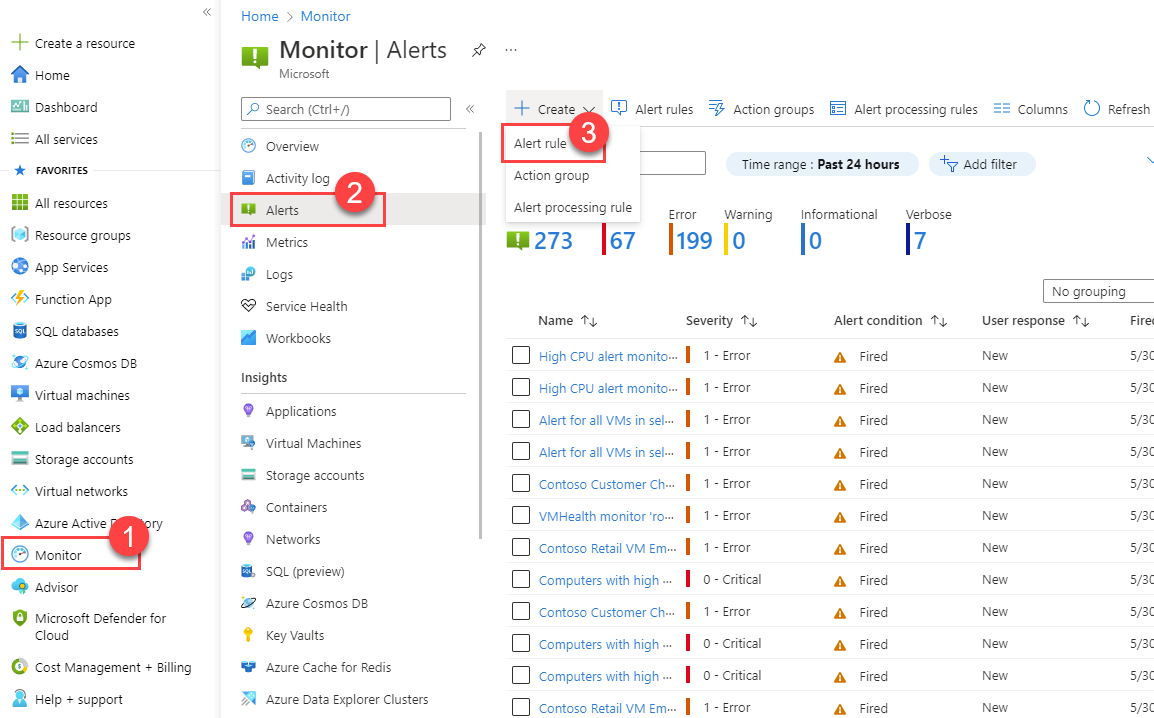
Create or edit an alert rule from the portal home page
- In the Azure portal, select Monitor.
- On the left pane, select Alerts.
- Select + Create > Alert rule.
Create or edit an alert rule from a specific resource
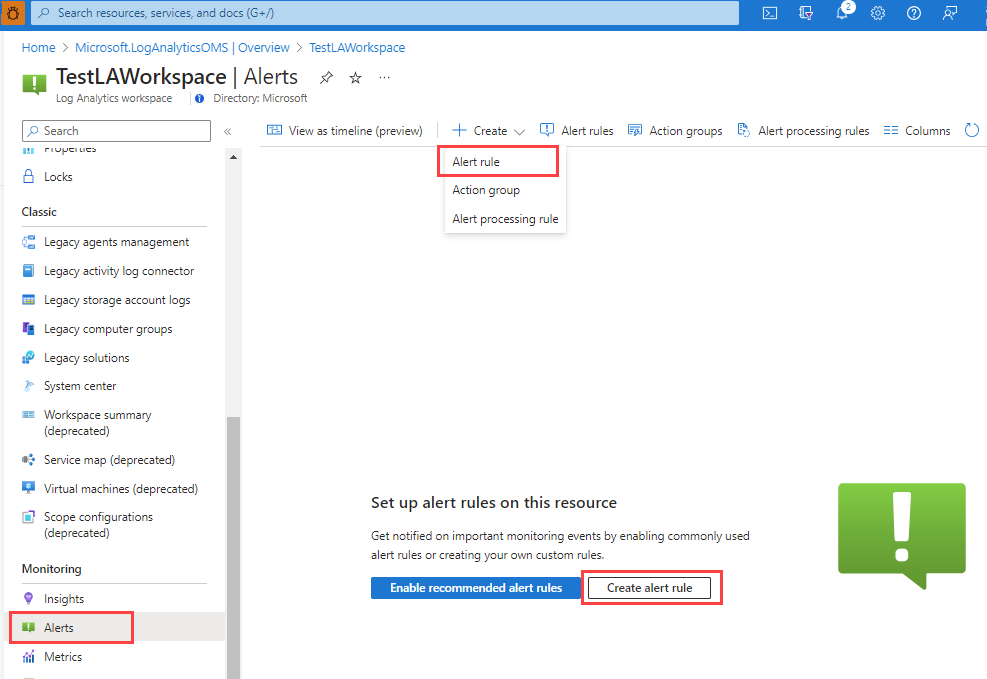
- In the Azure portal, go to the resource.
- On the left pane, select Alerts.
- Select + Create > Alert rule.
Edit an existing alert rule
In the Azure portal, either from the home page or from a specific resource, select Alerts on the left pane.
Select Alert rules.
Select the alert rule that you want to edit, and then select Edit.
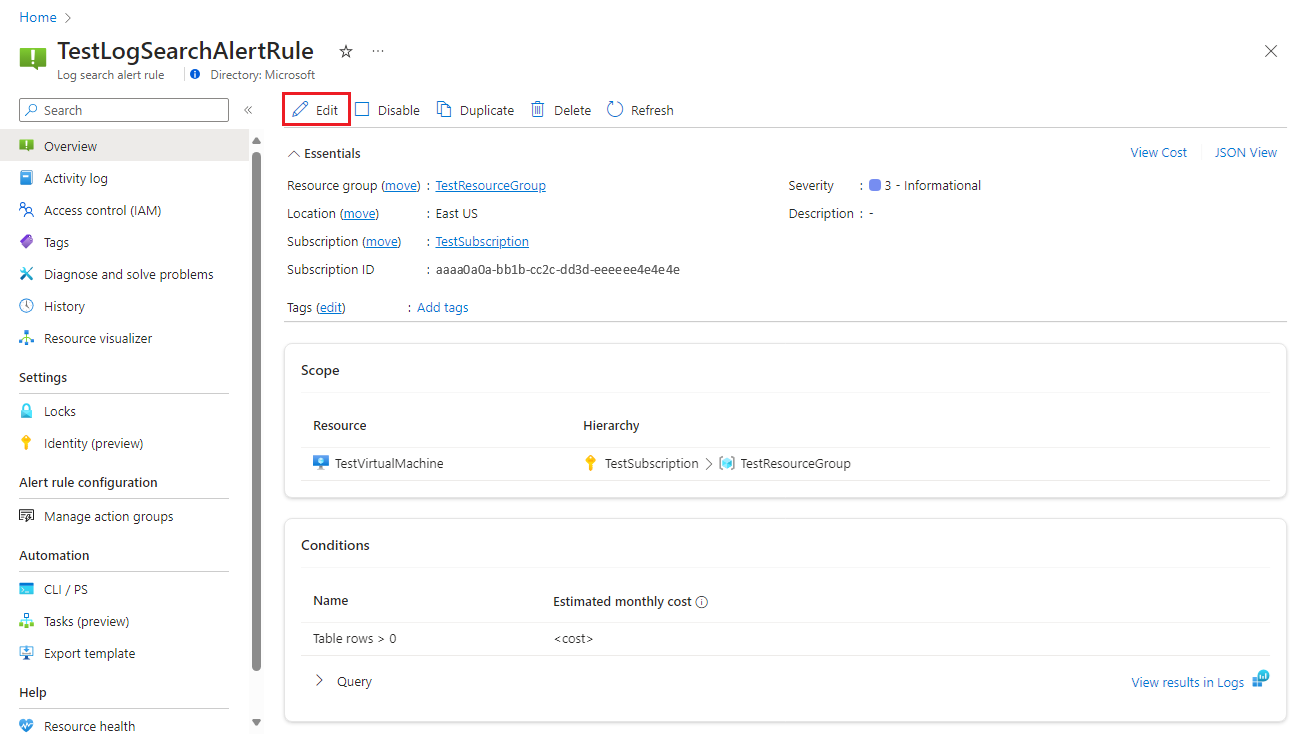
Select any of the tabs for the alert rule to edit the settings.
Configure the scope of the alert rule
On the Select a resource pane, set the scope for your alert rule. You can filter by subscription, resource type, or resource location.
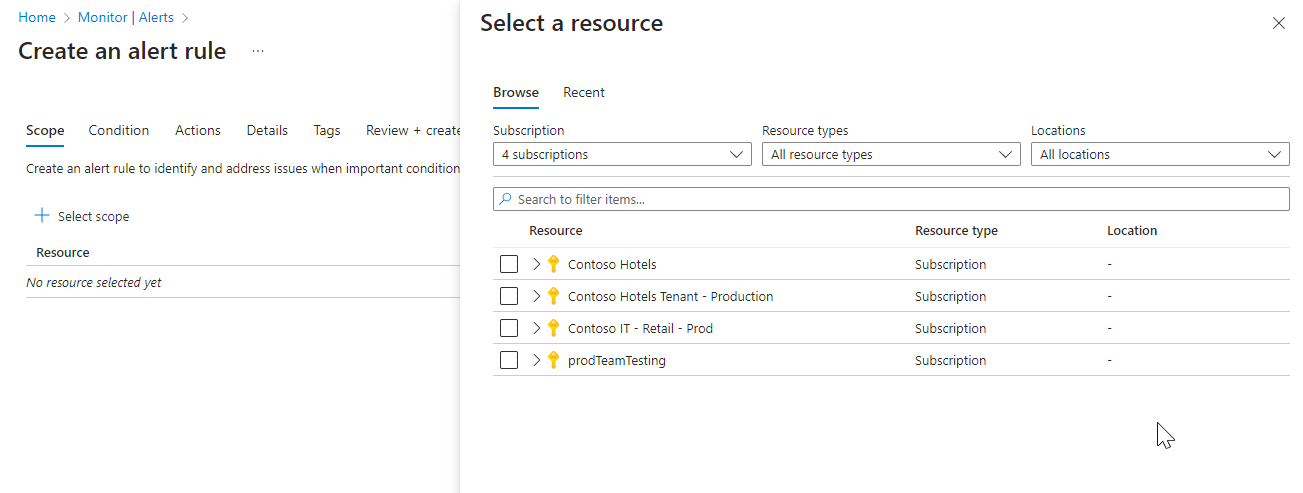
Select Apply.
Configure alert rule conditions
On the Condition tab, when you select the Signal name field, select Custom log search. Or select See all signals if you want to choose a different signal for the condition.
(Optional) If you selected See all signals in the previous step, use the Select a signal pane to search for the signal name or filter the list of signals. Filter by:
- Signal type: Select Log search.
- Signal source: The service that sends the Custom log search and Log (saved query) signals. Select the signal name, and then select Apply.
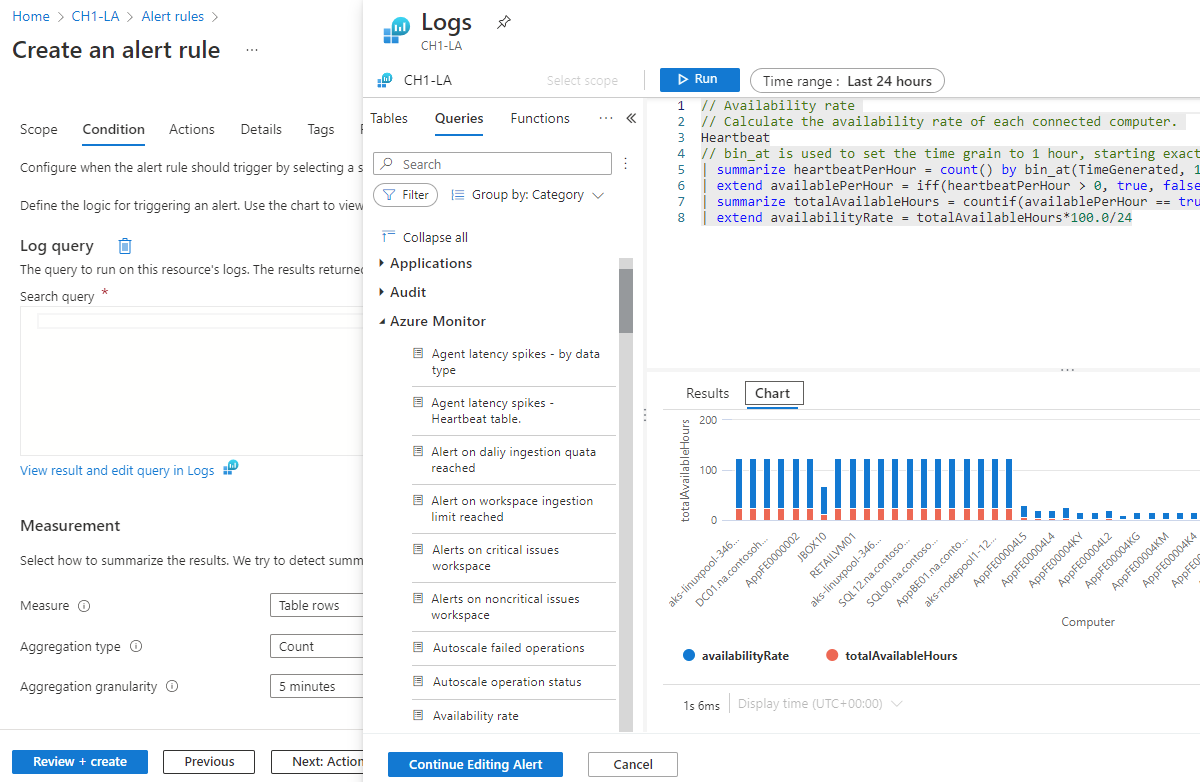
On the Logs pane, write a query that returns the log events for which you want to create an alert. To use one of the predefined alert rule queries, expand the Schema and filter pane next to the Logs pane. Then select the Queries tab, and select one of the queries.
Be aware of these limitations for log search alert rule queries:
- Log search alert rule queries don't support
bag_unpack(),pivot(), andnarrow(). - Log search alert rule queries support ago() with timespan literals only.
AggregatedValueis a reserved word. You can't use it in the query on log search alert rules.- The combined size of all data in the properties of the log search alert rules can't exceed 64 KB.
- When defining custom functions in the KQL query for log search alerts, it is important to be cautious with function code that includes relative time clauses (e.g., now()). Custom functions with relative time clauses that are not defined within the log search alert KQL query itself can introduce inconsistencies in query results, potentially impacting the accuracy and reliability of alert evaluations. Therefore:
- To ensure accurate and timely alerting, always define relative time clauses directly within the log search alert KQL query.
- If time ranges are needed inside the function, they should be passed as parameters and used in the function.
- Log search alert rule queries don't support
(Optional) If you're querying an Azure Data Explorer or Azure Resource Graph cluster, the Log Analytics workspace can't automatically identify the column with the event time stamp. We recommend that you add a time range filter to the query. For example:
    adx('https://help.kusto.windows.net/Samples').table
    | where MyTS >= ago(5m) and MyTS <= now()
arg("").Resources | where type =~ 'Microsoft.Compute/virtualMachines' | project _ResourceId=tolower(id), tags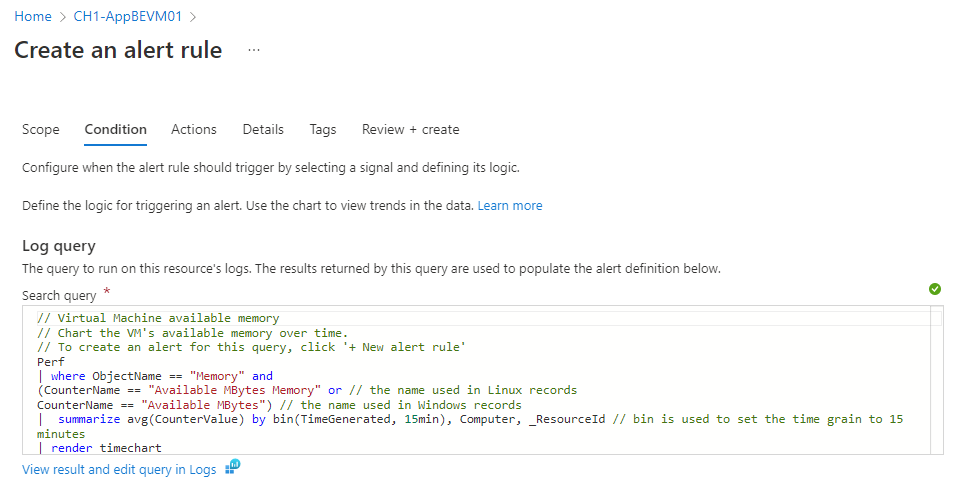
Sample log search alert queries are available for Azure Data Explorer and Resource Graph.
Cross-service queries aren't supported in government clouds. For more information about limitations, see Cross-service query limitations and Combine Azure Resource Graph tables with a Log Analytics workspace.
Select Run to run the alert.
The Preview section shows you the query results. When you finish editing your query, select Continue Editing Alert.
The Condition tab opens and is populated with your log query. By default, the rule counts the number of results in the last five minutes. If the system detects summarized query results, the rule is automatically updated with that information.
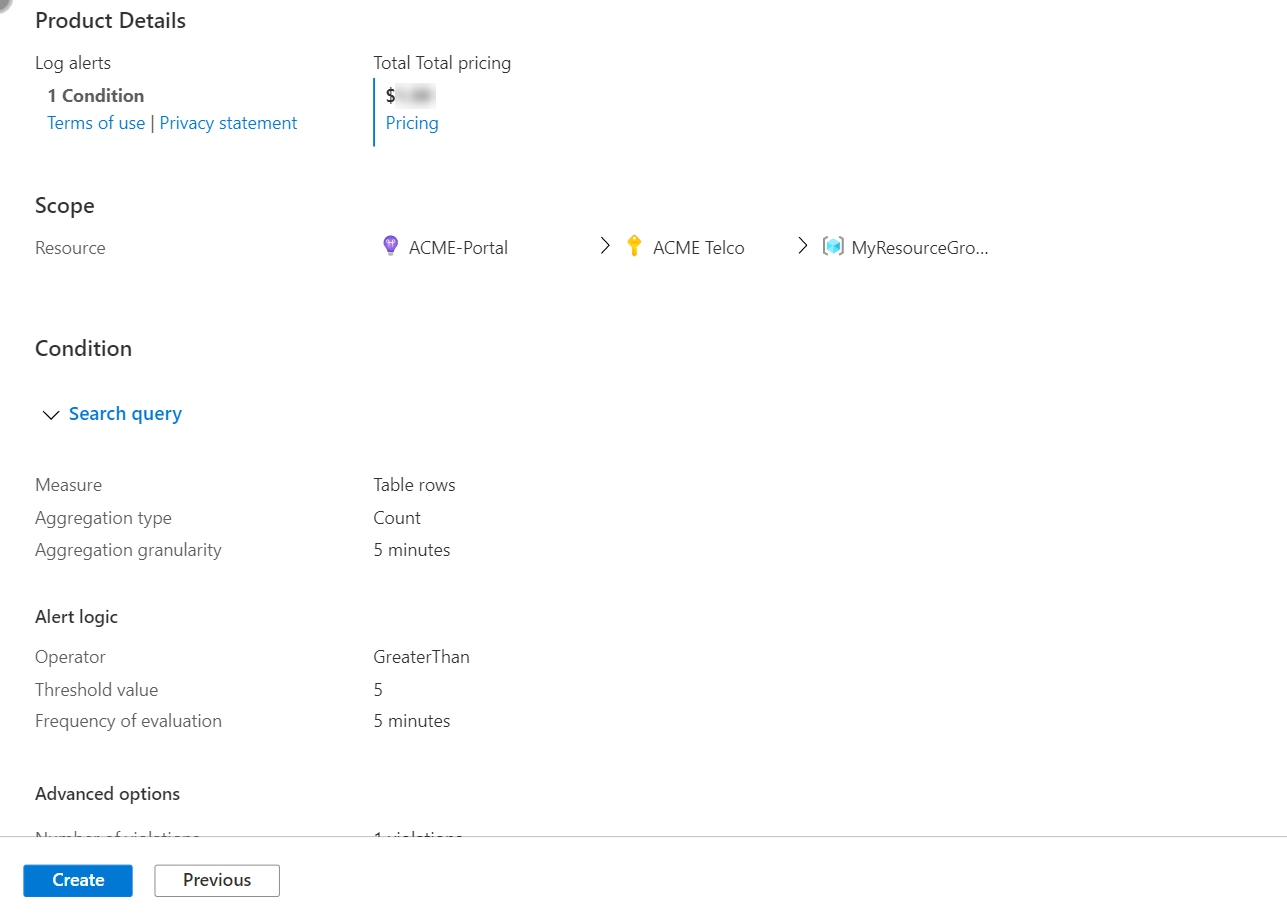
In the Measurement section, select values for these fields:
Field Description Measure Log search alerts can measure two things that you can use for various monitoring scenarios:
Table rows: You can use the number of returned rows to work with events such as Windows event logs, Syslog, and application exceptions.
Calculation of a numeric column: You can use calculations based on any numeric column to include any number of resources. An example is CPU percentage.Aggregation type The calculation performed on multiple records to aggregate them to one numeric value by using the aggregation granularity. Examples are Total, Average, Minimum, and Maximum. Aggregation granularity The interval for aggregating multiple records to one numeric value. 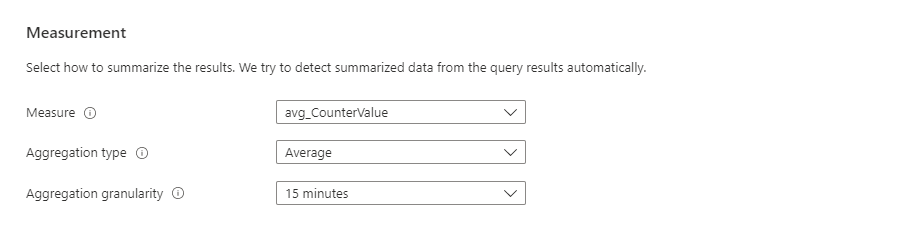
(Optional) In the Split by dimensions section, you can use dimensions to help provide context for the triggered alert.
Dimensions are columns from your query results that contain additional data. When you use dimensions, the alert rule groups the query results by the dimension values and evaluates the results of each group separately. If the condition is met, the rule fires an alert for that group. The alert payload includes the combination that triggered the alert.
You can apply up to six dimensions per alert rule. Dimensions can be only string or numeric columns. If you want to use a column that isn't a number or string type as a dimension, you must convert it to a string or numeric value in your query. If you select more than one dimension value, each time series that results from the combination triggers its own alert and is charged separately.
For example:
- You could use dimensions to monitor CPU usage on multiple instances that run your website or app. Each instance is monitored individually, and notifications are sent for each instance where the CPU usage exceeds the configured value.
- You could decide not to split by dimensions when you want a condition applied to multiple resources in the scope. For example, you wouldn't use dimensions if you want to fire an alert if at least five machines in the resource group scope have CPU usage above the configured value.
In general, if your alert rule scope is a workspace, the alerts are fired on the workspace. If you want a separate alert for each affected Azure resource, you can:
Use the Azure Resource Manager Azure Resource ID column as a dimension. When you use this option, the alert is fired on the workspace with the Azure Resource ID column as a dimension.
Specify the alert as a dimension in the Azure Resource ID property. This option makes the resource that your query returns the target of the alert. Alerts are then fired on the resource that your query returns, such as a virtual machine or a storage account, as opposed to the workspace.
When you use this option, if the workspace gets data from resources in more than one subscription, alerts can be triggered on resources from a subscription that's different from the alert rule subscription.
Select values for these fields:
Field Description Dimension name Dimensions can be either number or string columns. Dimensions are used to monitor specific time series and provide context to a fired alert. Operator The operator that's used on the dimension name and value. Dimension values The dimension values are based on data from the last 48 hours. Select Add custom value to add custom dimension values. Include all future values Select this field to include any future values added to the selected dimension. 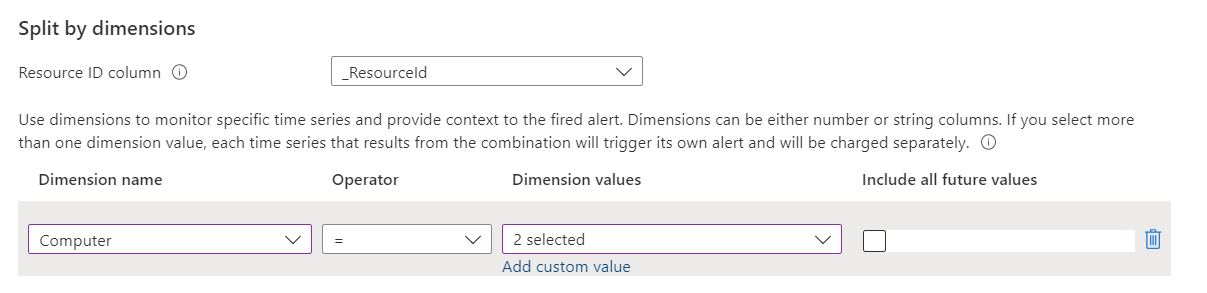
In the Alert logic section, select values for these fields:
Field Description Operator The query results are transformed into a number. In this field, select the operator to use for comparing the number against the threshold. Threshold value A number value for the threshold. Frequency of evaluation How often the query is run. You can set it anywhere from one minute to one day (24 hours). 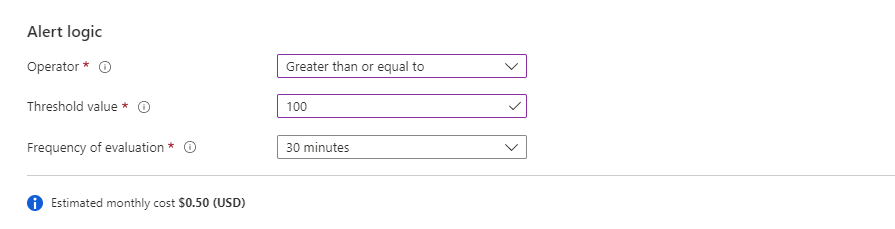
Note
The frequency is not a specific time that the alert runs every day. It's how often the alert rule runs.
There are some limitations to using an alert rule frequency of one minute. When you set the alert rule frequency to one minute, an internal manipulation is performed to optimize the query. This manipulation can cause the query to fail if it contains unsupported operations. The most common reasons why a query isn't supported are:
- The query contains the
search,union, ortake(limit) operation. - The query contains the
ingestion_time()function. - The query uses the
adxpattern. - The query calls a function that calls other tables.
Sample log search alert queries are available for Azure Data Explorer and Resource Graph.
- The query contains the
(Optional) In the Advanced options section, you can specify the number of failures and the alert evaluation period that's required to trigger an alert. For example, if you set Aggregation granularity to 5 minutes, you can specify that you want to trigger an alert only if three failures (15 minutes) happened in the last hour. Your application's business policy determines this setting.
Select values for these fields under Number of violations to trigger the alert:
Field Description Number of violations The number of violations that trigger the alert. Evaluation period The time period within which the number of violations occur. Override query time range If you want the alert evaluation period to be different from the query time range, enter a time range here.
The alert time range is limited to a maximum of two days. Even if the query contains anagocommand with a time range of longer than two days, the two-day maximum time range is applied. For example, even if the query text containsago(7d), the query only scans up to two days of data. If the query requires more data than the alert evaluation, you can change the time range manually. If the query contains anagocommand, it changes automatically to two days (48 hours).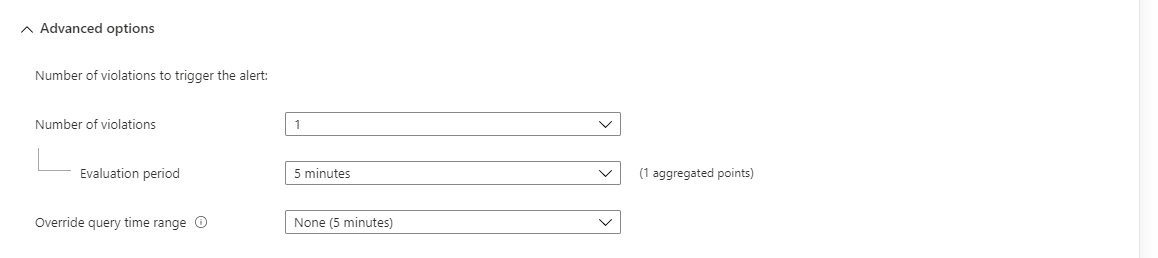
Note
If you or your administrator assigned the Azure policy Azure Log Search Alerts over Log Analytics workspaces should use customer-managed keys, you must select Check workspace linked storage. If you don't, the rule creation will fail because it won't meet the policy requirements.
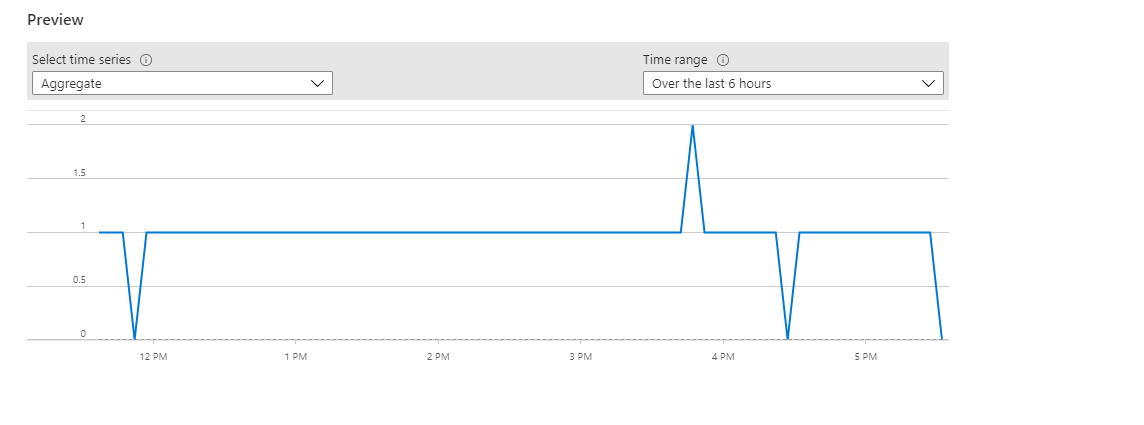
The Preview chart shows the results of query evaluations over time. You can change the chart period or select different time series that resulted from a unique alert splitting by dimensions.
Select Done. From this point on, you can select the Review + create button at any time.
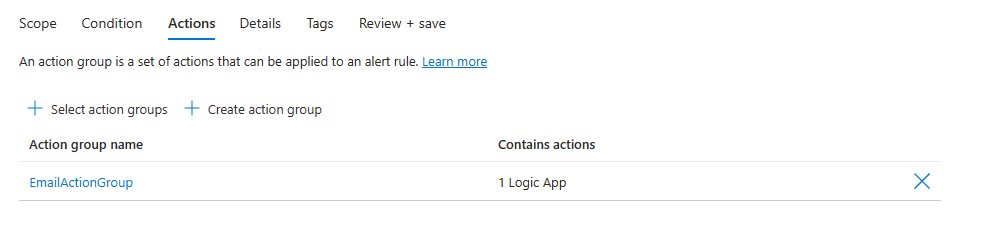
Configure alert rule actions
On the Actions tab, select or create the required action groups.
Configure alert rule details
On the Details tab, under Project details, select the Subscription and Resource group values.
Under Alert rule details:
Select the Severity value.
Enter values for Alert rule name and Alert rule description.
Note
A rule that uses an identity can't have the semicolon (;) character in the Alert rule name value.
Select the Region value.
In the Identity section, select which identity the log search alert rule uses for authentication when it sends the log query.
Keep these points in mind when you're selecting an identity:
- A managed identity is required if you're sending a query to Azure Data Explorer or Resource Graph.
- Use a managed identity if you want to be able to view or edit the permissions associated with the alert rule.
- If you don't use a managed identity, the alert rule permissions are based on the permissions of the last user to edit the rule, at the time that the rule was last edited.
- Use a managed identity to help you avoid a case where the rule doesn't work as expected because the user who last edited the rule didn't have permissions for all the resources added to the scope of the rule.
The identity associated with the rule must have these roles:
- If the query is accessing a Log Analytics workspace, the identity must be assigned a reader role for all workspaces that the query accesses. If you're creating resource-centric log search alerts, the alert rule might access multiple workspaces, and the identity must have a reader role on all of them.
- If you're querying an Azure Data Explorer or Resource Graph cluster, you must add the reader role for all data sources that the query accesses. For example, if the query is resource centric, it needs a reader role on that resource.
- If the query is accessing a remote Azure Data Explorer cluster, the identity must be assigned:
- A reader role for all data sources that the query accesses. For example, if the query is calling a remote Azure Data Explorer cluster by using the
adx()function, it needs a reader role on that Azure Data Explorer cluster. - A database viewer role for all databases that the query accesses.
- A reader role for all data sources that the query accesses. For example, if the query is calling a remote Azure Data Explorer cluster by using the
For detailed information on managed identities, see Managed identities for Azure resources.
Select one of the following options for the identity that the alert rule uses:
Identity option Description None Alert rule permissions are based on the permissions of the last user who edited the rule, at the time that the rule was edited. Enable system assigned managed identity Azure creates a new, dedicated identity for this alert rule. This identity has no permissions and is automatically deleted when the rule is deleted. After you create the rule, you must assign permissions to this identity to access the necessary workspace and data sources for the query. For more information about assigning permissions, see Assign Azure roles using the Azure portal. Log search alert rules that use linked storage are not supported. Enable user assigned managed identity Before you create the alert rule, you create an identity and assign it appropriate permissions for the log query. This is a regular Azure identity. You can use one identity in multiple alert rules. The identity isn't deleted when the rule is deleted. When you select this type of identity, a pane opens for you to select the associated identity for the rule. 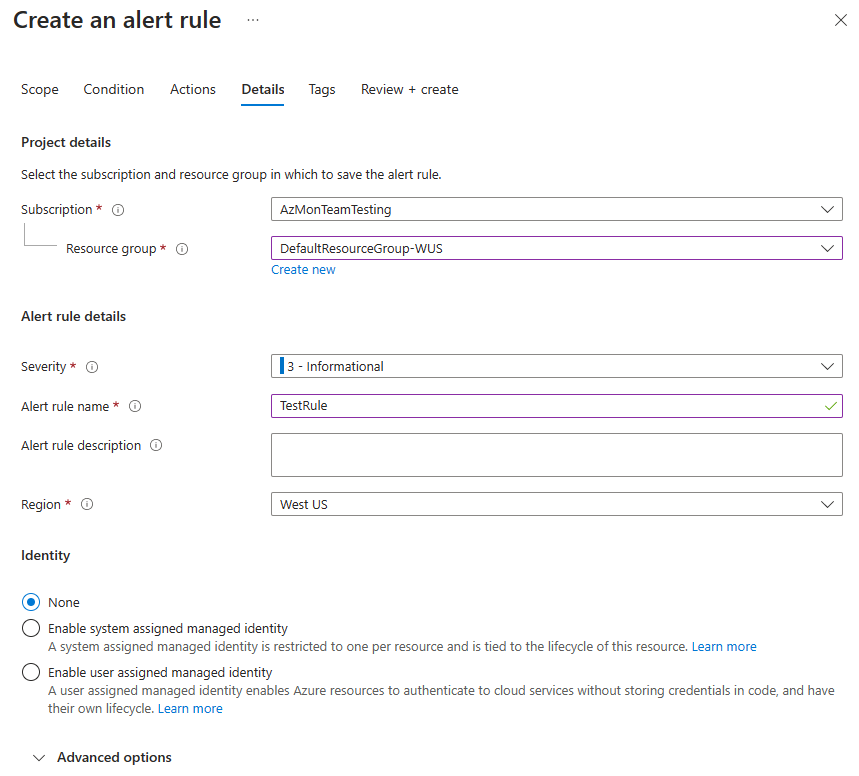
(Optional) In the Advanced options section, you can set several options:
Field Description Enable upon creation Select this option to make the alert rule start running as soon as you finish creating it. Automatically resolve alerts Select this option to make the alert stateful. When an alert is stateful, the alert is resolved when the condition is no longer met for a specific time range. The time range differs based on the frequency of the alert:
1 minute: The alert condition isn't met for 10 minutes.
5 to 15 minutes: The alert condition isn't met for three frequency periods.
15 minutes to 11 hours: The alert condition isn't met for two frequency periods.
11 to 12 hours: The alert condition isn't met for one frequency period.
Note that stateful log search alerts have these limitations.Mute actions Select this option to set a period of time to wait before alert actions are triggered again. In the Mute actions for field that appears, select the amount of time to wait after an alert is fired before triggering actions again. Check workspace linked storage Select this option if workspace linked storage for alerts is configured. If no linked storage is configured, the rule isn't created. -
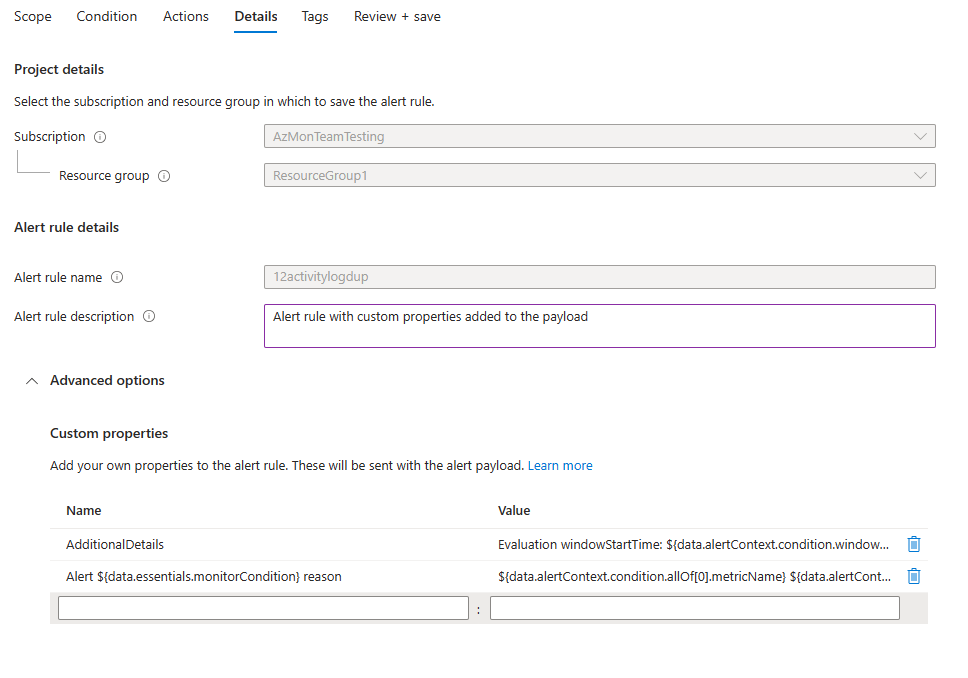
(Optional) In the Custom properties section, if this alert rule contains action groups, you can add your own properties to include in the alert notification payload. You can use these properties in the actions that the action group calls, such as by a webhook, Azure function, or logic app action.
The custom properties are specified as key/value pairs by using static text, a dynamic value extracted from the alert payload, or a combination of both.
The format for extracting a dynamic value from the alert payload is:
${<path to schema field>}. For example:${data.essentials.monitorCondition}.Use the format of the common alert schema to specify the field in the payload, whether or not the action groups configured for the alert rule use the common schema.
Note
- Custom properties are added to the payload of the alert, but they don't appear in the email template or in the alert details in the Azure portal.
The following examples use values in Custom properties to utilize data from a payload that uses the common alert schema.
This example creates an Additional Details tag with data regarding the window start time and window end time:
- Name:
Additional Details - Value:
Evaluation windowStartTime: ${data.alertContext.condition.windowStartTime}. windowEndTime: ${data.alertContext.condition.windowEndTime} - Result:
AdditionalDetails:Evaluation windowStartTime: 2023-04-04T14:39:24.492Z. windowEndTime: 2023-04-04T14:44:24.492Z
This example adds data regarding the reason for resolving or firing the alert:
- Name:
Alert ${data.essentials.monitorCondition} reason - Value:
${data.alertContext.condition.allOf[0].metricName} ${data.alertContext.condition.allOf[0].operator} ${data.alertContext.condition.allOf[0].threshold} ${data.essentials.monitorCondition}. The value is ${data.alertContext.condition.allOf[0].metricValue} - Potential results:
Alert Resolved reason: Percentage CPU GreaterThan5 Resolved. The value is 3.585Alert Fired reason": "Percentage CPU GreaterThan5 Fired. The value is 10.585
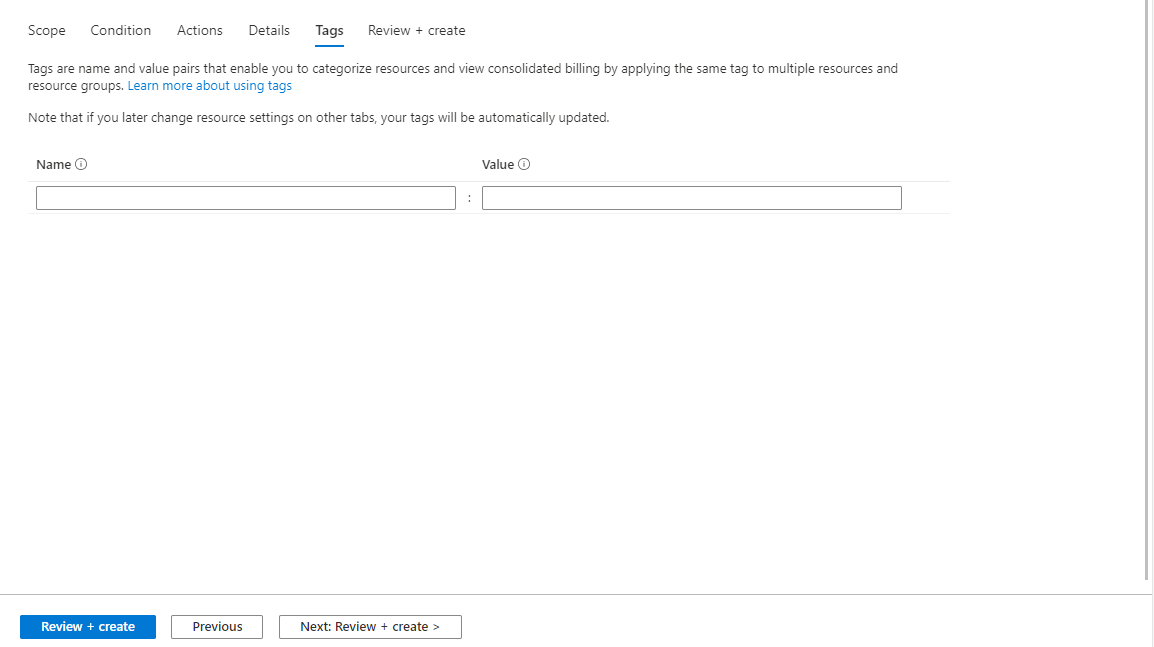
Configure alert rule tags
On the Tags tab, set any required tags on the alert rule resource.
Review and create the alert rule
On the Review + create tab, the rule is validated. If there's a problem, go back and fix it.
When validation passes and you've reviewed the settings, select the Create button.