Note
Access to this page requires authorization. You can try signing in or changing directories.
Access to this page requires authorization. You can try changing directories.
Important
This feature is in Beta. To use it, a workspace admin must turn on Lakebase Insights from the Previews page. See Manage Azure Databricks previews.
Important
Lakebase telemetry now lands in system tables automatically. Insights powered by this new telemetry is coming soon. Until then, existing beta configurations with Insights enabled continue generating insights.
Insights is a background agent that reviews a Lakebase project's telemetry from system.lakebase and surfaces issues and early warnings without you having to ask. It runs per project, in isolation, on a managed Azure Databricks system identity, either on a schedule you set or once on demand. This page explains how to enable Insights for a project, then walks through a real insight end to end: what it found, why it matters, and how to respond.
A project still on an earlier observability configuration reads from the Unity Catalog destination that configuration writes to, rather than from system.lakebase. See Lakebase telemetry in system tables.
Insights detects and diagnoses an issue. Resolving it is usually the next step, in Genie, which picks up the diagnosis and carries out a fix you confirm. You can also ask Genie about a problem directly, without waiting for an insight.
Note
There's no separate charge for storing the captured telemetry within its 7-day retention period. Other costs are bundled into products you already use. Querying the telemetry counts toward the compute you run the query on. Each Insights run counts toward the compute and the model tokens it consumes in your account, so the analysis frequency you set determines how often that happens. Asking Genie counts toward your Genie usage.
Prerequisites
- The Lakebase Observability in System Tables and Lakebase Insights previews both enabled for your workspace. Capture is a prerequisite for Insights: Insights reads the
system.lakebasetelemetry, so the data needs to be there before the agent has anything to analyze. - A Lakebase project on AWS or Azure, with a running compute.
Enable and use Insights
Enable Insights for a project
Enabling Insights has two parts:
- A workspace admin can turn on the Lakebase Insights preview from the Previews page. Insights also requires the Lakebase Observability in System Tables preview, because it reads the captured telemetry.
- In each project you want analyzed, open the project's Settings and configure Insights, including its analysis frequency. Insights doesn't start analyzing a project until it's configured there. Enabling the preview alone doesn't put every project under analysis.
The agent's analysis instructions aren't configurable.
Find an insight
Insights evaluates telemetry on the schedule you set, so expect a delay between an issue occurring and an insight appearing for it, particularly on a newly configured project. You can also run the agent once, on demand, instead of waiting for the next scheduled run.
To see a project's insights, open the project, go to Monitoring, and select the Insights tab. Each row shows a Severity (for example Minor or Moderate), the Insight title, the Time window the issue covers, and its Status.
Read an insight
Click an insight to open its detail page. Every insight follows the same structure:
- Summary: what's happening, in plain language.
- Evidence: the specific signals and values that support the diagnosis, in a table.
- Recommendations: concrete next steps, with the reasoning behind each one.
What Insights finds depends on your own telemetry, so your insights differ from the one below. This is a real insight, included to show the level of detail to expect.
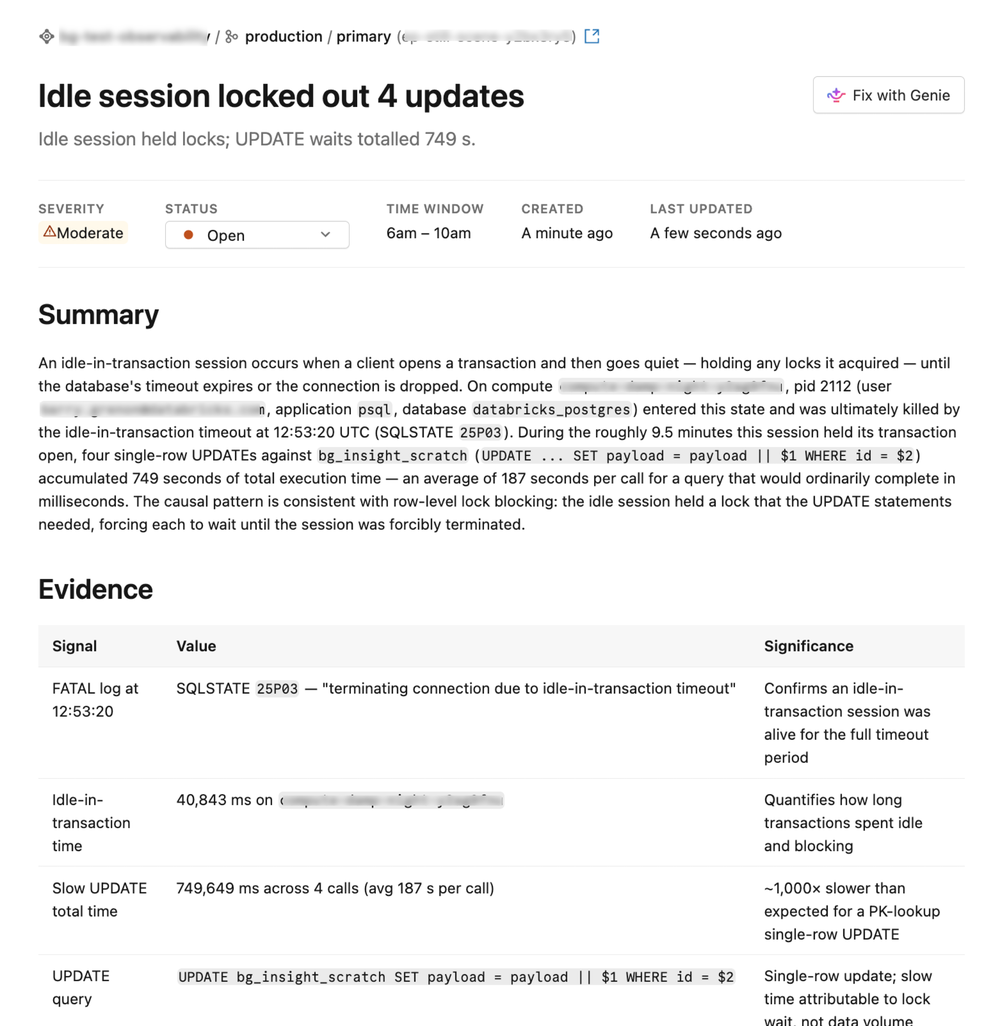
In this example, "Idle session locked out 4 updates," the subtitle already tells you where to look: "Idle session held locks; UPDATE waits totalled 749 s." The Summary explains what happened: a session opened a transaction, went idle while still holding a row lock, and stayed that way for roughly 9.5 minutes until the database's own idle-in-transaction timeout forcibly closed it. The Evidence table backs that up with the specific numbers, including the terminating log entry and a total of 749 seconds of UPDATE wait time spread across 4 calls, averaging 187 seconds each for updates that would normally complete in milliseconds.
Recommendations:
- Tune
idle_in_transaction_session_timeoutto a safe value, such as 30-60 seconds, so an idle session releases its locks quickly instead of blocking other queries for minutes.- Audit for unclosed transactions and use connection pooling with short checkout timeouts, so a client that opens a transaction and goes idle can't hold a lock indefinitely.
The evidence identifies the session responsible, how long it held the lock, and the wait time it cost other queries. Severity is inferred from the available data, so read the Evidence to confirm the root cause before acting on Severity alone.
Respond to an insight
After you've read an insight, respond in one of three ways:
- Apply the recommendation yourself, using the evidence and recommendations as a guide.
- Click Fix with Genie on the insight's detail page to hand it off to the interactive agent and keep investigating conversationally. This helps when the recommendation needs more context before you act, or when the fix involves a database-side change. See Investigate and fix issues with Genie.
- Set its status to Resolved once you've addressed it, or Not an issue if it doesn't need action.
A finding can disappear on its own
Because Insights re-evaluates on its own schedule, a finding can drop off the list even if you never change its Status: a transient event like a one-time bulk load might not recur in a later window, or the compute behind it might scale to zero and resume fresh with the problematic session gone. A finding leaving the active list doesn't mean anyone marked it Resolved or Not an issue, or that anything went wrong. It reflects that the condition is no longer present in the latest evaluation window.
Note
Configuring Insights for a project and viewing its insights both require CAN MANAGE on that project. See Manage project permissions.
Next steps
- Investigate and fix issues with Genie: resolve what an insight found, or start a new investigation.
- Lakebase telemetry in system tables: the tables Insights reads, and current limitations.
- Observability: the rest of the Lakebase observability tools.