Note
Access to this page requires authorization. You can try signing in or changing directories.
Access to this page requires authorization. You can try changing directories.
This article shows you how to instrument a .NET web API with OpenTelemetry and send its logs, metrics, and traces to the Aspire Dashboard by using OTLP. You add the OpenTelemetry packages, configure custom metrics and traces, and view the results in the dashboard.
The Aspire Dashboard is a standard part of Aspire, but it's also available as a standalone Docker container that provides an OTLP endpoint for sending telemetry. The dashboard visualizes logs, metrics, and traces. Using the dashboard this way has no dependency on Aspire, and it visualizes telemetry from any app that sends telemetry by using OTLP. It works equally well for apps written in Java, Go, or Python, provided they can send their telemetry to an OTLP endpoint.
The Aspire Dashboard requires less configuration and fewer setup steps than open-source solutions such as Prometheus, Grafana, and Jaeger. But unlike those tools, the Aspire Dashboard is a developer visualization tool, not a production monitoring tool.
1. Create the project
Create a simple web API project by using the ASP.NET Core Empty template in Visual Studio or the following .NET CLI command:
dotnet new web
2. Reference the OpenTelemetry packages
To add the OpenTelemetry packages, use the NuGet Package Manager, or run the following dotnet add package commands:
dotnet add package OpenTelemetry.Exporter.OpenTelemetryProtocol
dotnet add package OpenTelemetry.Extensions.Hosting
dotnet add package OpenTelemetry.Instrumentation.AspNetCore
dotnet add package OpenTelemetry.Instrumentation.Http
Alternatively, add the following PackageReference items directly to the project file:
<ItemGroup>
  <PackageReference Include="OpenTelemetry.Exporter.OpenTelemetryProtocol" Version="1.19.1" />
  <PackageReference Include="OpenTelemetry.Extensions.Hosting" Version="1.19.1" />
  <PackageReference Include="OpenTelemetry.Instrumentation.AspNetCore" Version="1.19.0" />
  <PackageReference Include="OpenTelemetry.Instrumentation.Http" Version="1.19.0" />
</ItemGroup>
Note
Because the OTel APIs are constantly evolving, use the latest versions.
3. Add using directives
Add the following using directives to the top of the file:
using System.Diagnostics;
using System.Diagnostics.Metrics;
using OpenTelemetry.Exporter;
using OpenTelemetry.Logs;
using OpenTelemetry.Metrics;
using OpenTelemetry.Resources;
using OpenTelemetry.Trace;
4. Add metrics and activity definitions
The following code defines a new metric (greetings.count) that counts how many times a client calls the API, and a new activity source (Otel.Example). Insert this code before builder.Build:
// Custom metrics for the application
var greeterMeter = new Meter("OTel.Example", "1.0.0");
var countGreetings = greeterMeter.CreateCounter<int>("greetings.count", description: "Counts the number of greetings");

// Custom ActivitySource for the application
var greeterActivitySource = new ActivitySource("OTel.Example");
5. Configure OpenTelemetry with the correct providers
Insert the following code before builder.Build:
// Configure the shared OTLP connection used by logs, metrics, and traces.
var otlpEndpoint = new Uri(builder.Configuration["OTEL_EXPORTER_OTLP_ENDPOINT"]!);
Action<OtlpExporterOptions> configureOtlp = options =>
{
    options.Endpoint = otlpEndpoint;
    options.Protocol = OtlpExportProtocol.Grpc;
    options.Headers = builder.Configuration["OTEL_EXPORTER_OTLP_HEADERS"]; // To secure endpoint (not in this example)
};

// Setup logging to be exported via OpenTelemetry
builder.Logging.AddOpenTelemetry(logging =>
{
    logging.IncludeFormattedMessage = true;
    logging.IncludeScopes = true;
    logging.AddOtlpExporter(configureOtlp);
});

var otel = builder.Services.AddOpenTelemetry();

// Identify this application as a single service in the Aspire dashboard.
otel.ConfigureResource(resource => resource.AddService(builder.Configuration["OTEL_SERVICE_NAME"]!));

// Add Metrics for ASP.NET Core and our custom metrics and export via OTLP
otel.WithMetrics(metrics =>
{
    // Metrics provider from OpenTelemetry
    metrics.AddAspNetCoreInstrumentation();

    // Our custom metrics
    metrics.AddMeter(greeterMeter.Name);

    // Metrics provided by ASP.NET Core in .NET
    metrics.AddMeter("Microsoft.AspNetCore.Hosting");
    metrics.AddMeter("Microsoft.AspNetCore.Server.Kestrel");

    // Export the metrics via OTLP
    metrics.AddOtlpExporter(configureOtlp);
});

// Add Tracing for ASP.NET Core and our custom ActivitySource and export via OTLP
otel.WithTracing(tracing =>
{
    tracing.AddAspNetCoreInstrumentation();
    tracing.AddHttpClientInstrumentation();
    tracing.AddSource(greeterActivitySource.Name);
    tracing.AddOtlpExporter(configureOtlp);
});
This code sets up OpenTelemetry with the different sources of telemetry:
- It adds an OTel provider to
ILoggerto collect log records. - It sets up metrics, registering instrumentation providers and meters for ASP.NET and the custom meter.
- It sets up tracing, registering instrumentation providers and the custom
ActivitySource.
It then registers the OTLP exporter, using environment variables for its configuration.
6. Configure OTLP settings
You can configure the OTLP exporter through APIs in code, environment variables, or application configuration. For this example, add the OTLP settings at the root of appsettings.Development.json, after the Logging section:
{
  "Logging": {
    "LogLevel": {
      "Default": "Information",
      "Microsoft.AspNetCore": "Warning"
    }
  },
  "OTEL_EXPORTER_OTLP_ENDPOINT": "http://localhost:4317",
  "OTEL_SERVICE_NAME": "OTLP-Example"
}
Add other settings for the .NET OTLP exporter or common OTel settings such as OTEL_RESOURCE_ATTRIBUTES to define resource attributes.
Note
ASP.NET Core loads both appsettings.json and appsettings.Development.json. Settings in appsettings.Development.json override duplicate settings in appsettings.json when you run the app in the Development environment.
7. Create an API endpoint
Insert the following code between builder.Build and app.Run():
app.MapGet("/", SendGreeting);
Insert the following function at the bottom of the file:
async Task<string> SendGreeting(ILogger<Program> logger)
{
    // Create a new Activity scoped to the method
    using var activity = greeterActivitySource.StartActivity("GreeterActivity");

    // Log a message
    logger.LogInformation("Sending greeting");

    // Increment the custom counter
    countGreetings.Add(1);

    // Add a tag to the Activity
    activity?.SetTag("greeting", "Hello World!");

    return "Hello World!";
}
Note
The endpoint definition doesn't use anything specific to OpenTelemetry. It uses the .NET APIs for observability.
8. Start the Aspire Dashboard container
Use docker to download and run the dashboard container.
docker run --rm -it `
-p 18888:18888 `
-p 4317:18889 `
--name aspire-dashboard `
mcr.microsoft.com/dotnet/aspire-dashboard:latest
Data displayed in the dashboard can be sensitive. By default, the dashboard requires an authentication token to sign in. The container displays this token in its output.

Copy the URL, replace 0.0.0.0 with localhost, for example, http://localhost:18888/login?t=123456780abcdef123456780, and open it in your browser. Or, paste the key after /login?t= in the sign-in dialog. The token changes each time you start the container.
9. Run the project
Run the project with dotnet run. The console output displays the URLs the app listens on, for example:
info: Microsoft.Hosting.Lifetime[14]
      Now listening on: http://localhost:5086
Use the port shown in your own console output, because it might differ from the examples in this article. Use a browser or curl to access the API on that port:
curl -k http://localhost:5086
Each time you request the page, the count of greetings increases.
9.1 Log output
The code logs statements by using ILogger. By default, .NET enables the Console Provider, which directs output to the console.
You can egress logs from .NET in a few ways:
- Container systems such as Kubernetes redirect
stdoutandstderroutput to log files. - Use logging libraries that integrate with
ILogger, such as Serilog and NLog. - Use logging providers for OTel, such as OTLP. The logging section of the code in step 5 adds the OTel provider.
The dashboard shows logs as structured logs. Any properties you set in the log message become fields in the log record.
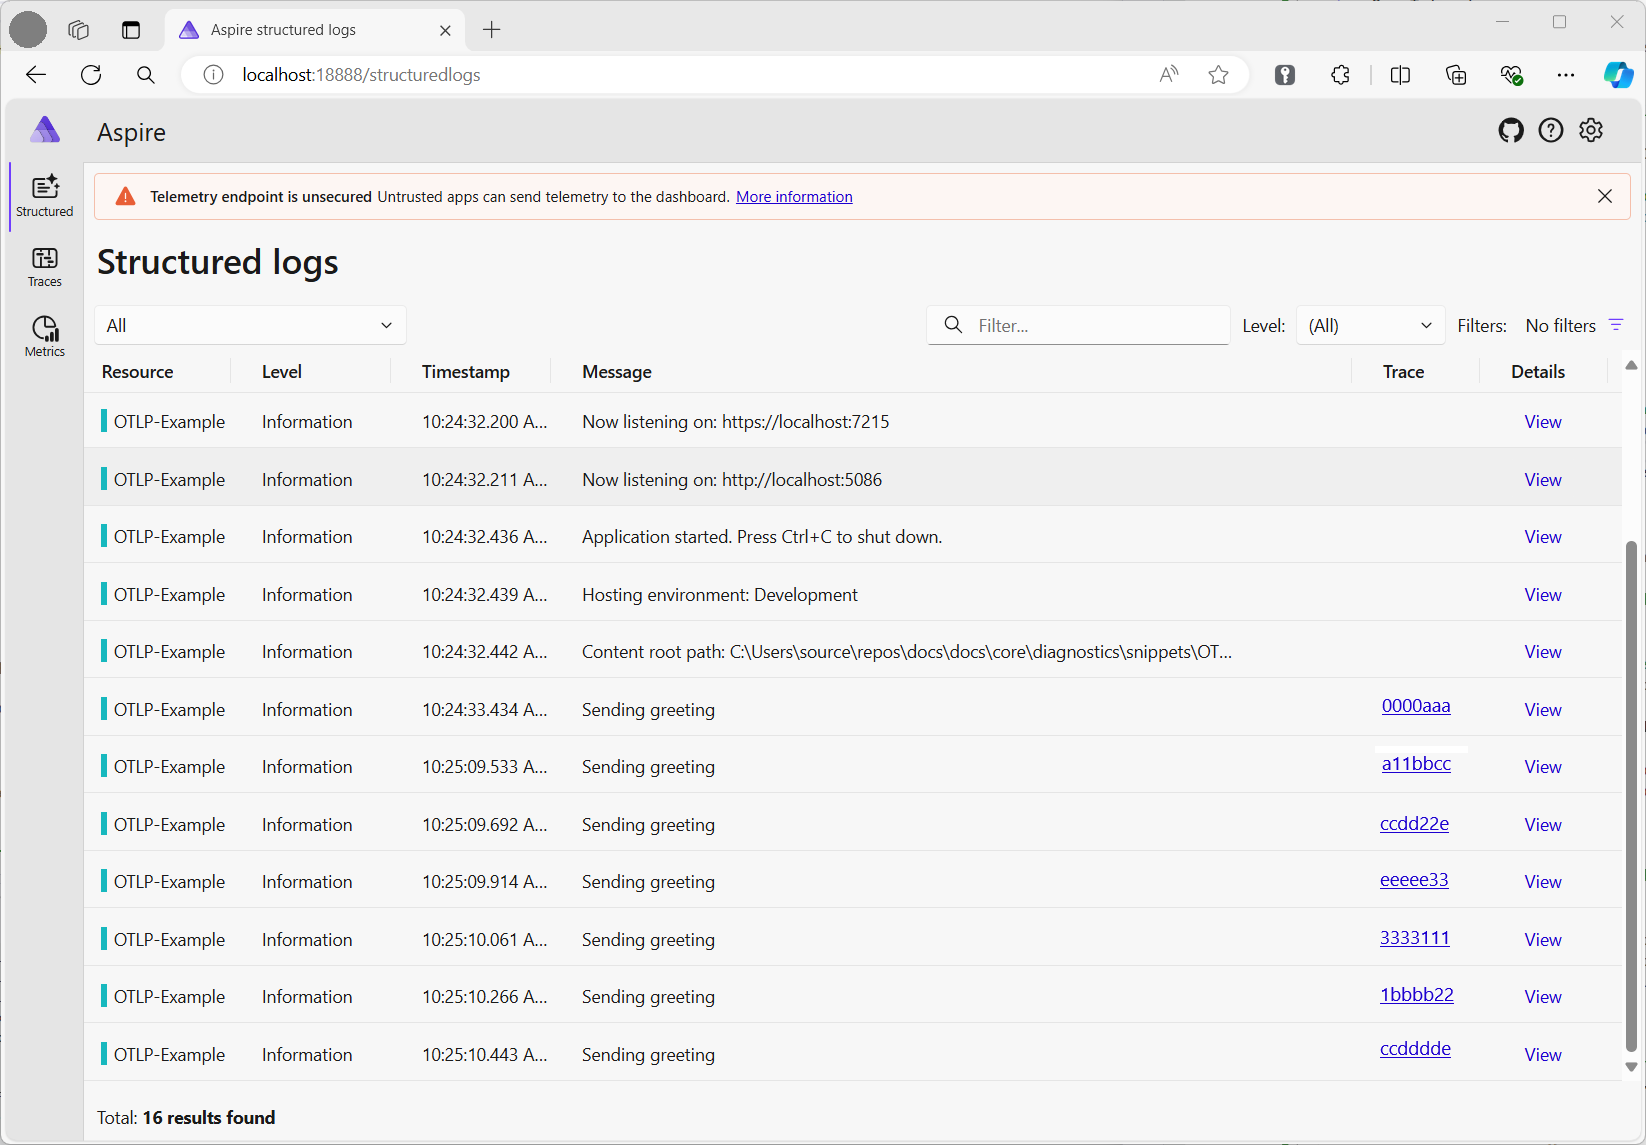
9.2 Metrics view
The Aspire dashboard shows metrics on a per-resource basis. A resource is the OTel term for a source of telemetry, such as a process. When you select a resource, the dashboard lists each metric that the resource sent to its OTLP endpoint. The list of metrics is dynamic, and it updates as the dashboard receives new metrics.
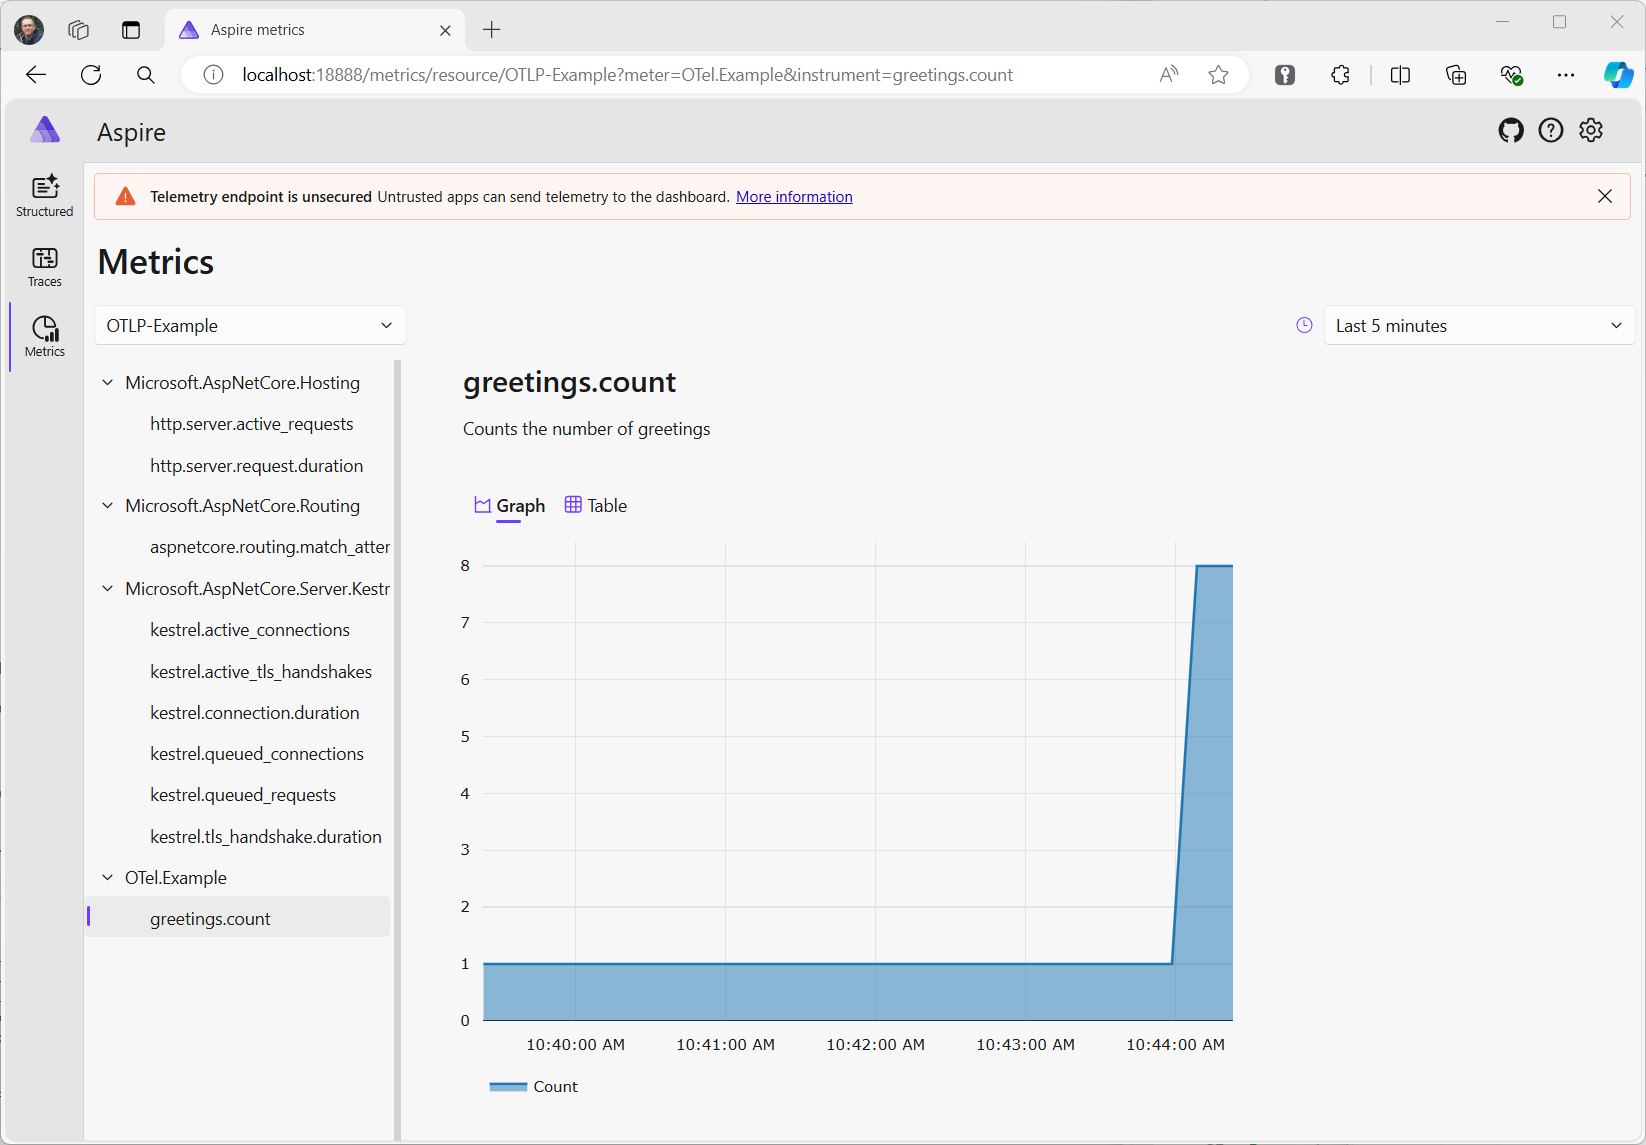
The metrics view depends on the type of metric you use:
- The dashboard shows counters directly.
- For histograms that track a value per request, such as a timespan or bytes sent per request, the dashboard collects values into a series of buckets and graphs the P50, P90, and P99 percentiles. Histogram results can include exemplars, which are individual data points together with the trace/span ID for that request. The dashboard shows these as dots on the graph. Select one to navigate to the respective trace, so you can see what caused that value. This feature helps you diagnose outliers.
- Metrics can include dimensions, which are key/value pairs associated with individual values. The dashboard aggregates values per dimension. Use the dropdowns in the view to filter results by specific dimensions, such as
GETrequests only, or a specific URL route in ASP.NET.
9.3 Tracing view
The tracing view lists traces. Each trace is a set of activities that share the same trace ID. Spans track work, and each span represents a unit of work. Processing an ASP.NET request creates a span. Making an HttpClient request is a span. By tracking each span's parent, you build a hierarchy of spans that you can visualize. When you collect spans from each resource (process), you can track work across a series of services. HTTP requests include a header that passes the trace ID and parent span ID to the next service. Each resource must collect telemetry and send it to the same collector, which then aggregates and presents a hierarchy of the spans.
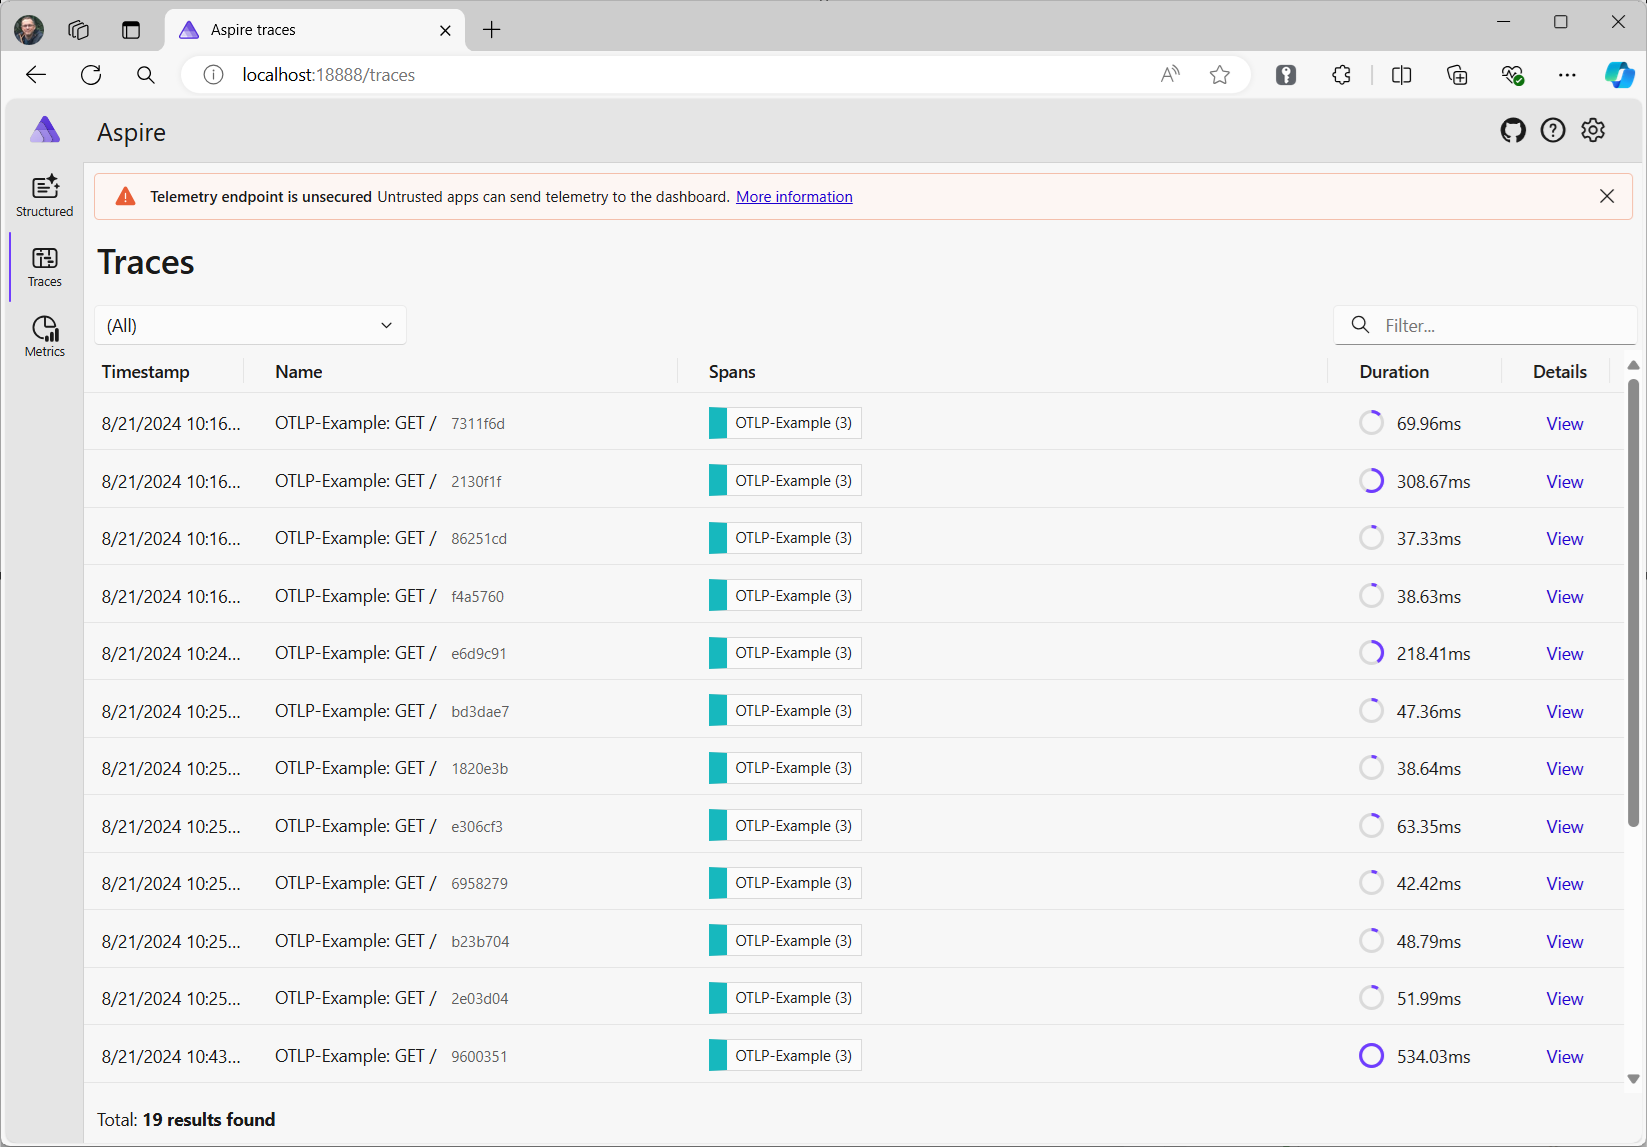
The dashboard shows a list of traces with summary information. Whenever the dashboard detects spans with a new trace ID, it adds a row to the table. Select View to show all the spans in the trace.
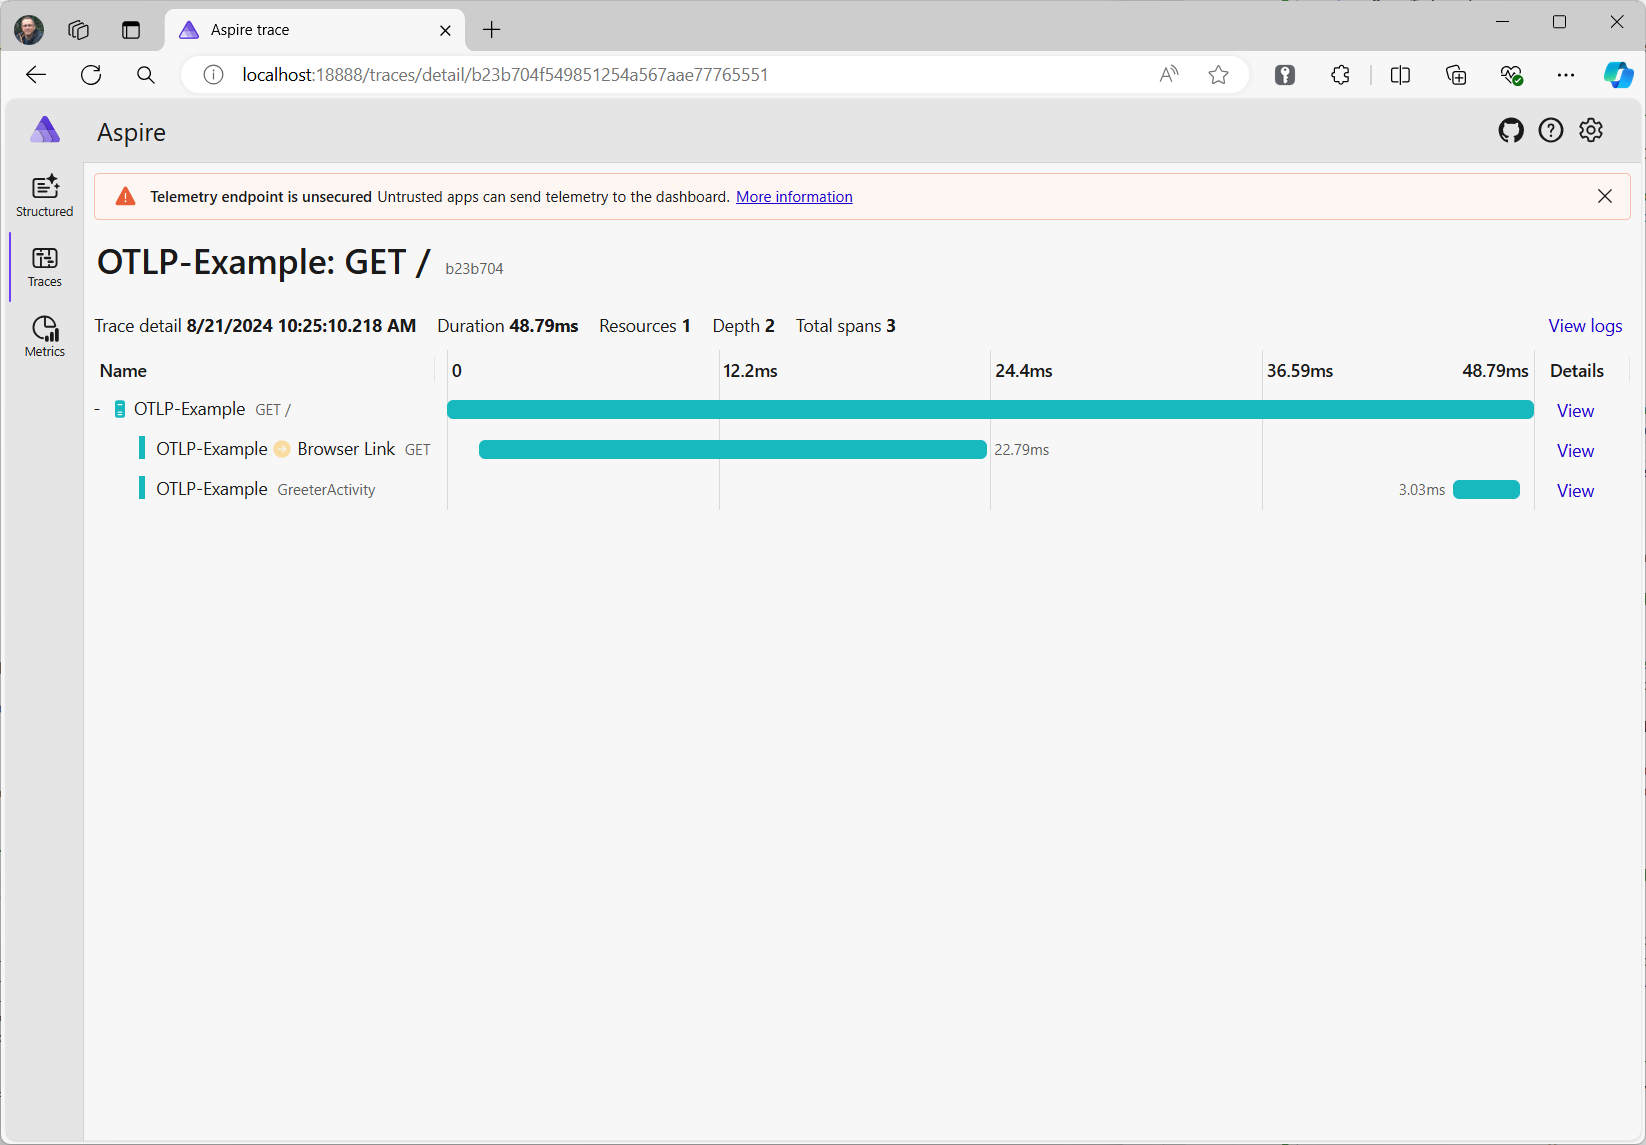
Select a span to show its details, including any properties on the span, such as the greeting tag you set in step 7.
Collaborate with us on GitHub
The source for this content can be found on GitHub, where you can also create and review issues and pull requests. For more information, see our contributor guide.