Note
Access to this page requires authorization. You can try signing in or changing directories.
Access to this page requires authorization. You can try changing directories.
This document describes the Fabric team's approach to maintaining a reliable, performant, and scalable service for customers. It describes monitoring service health, mitigating incidents and acting on necessary improvements. Other important operational aspects such as security and release management are outside of the scope of this document. This document was created to share knowledge with our customers, who often raise questions regarding site reliability engineering practices. The intention is to offer transparency into how Fabric minimizes service disruption through safe deployment, continuous monitoring, and rapid incident response. The techniques described here also provide a blueprint for teams hosting service-based solutions to build foundational live site processes that are efficient and effective at scale.
Why incidents occur and how to live with them
The Fabric team ships weekly feature updates to the service and on-demand targeted fixes to address service quality issues. The release process includes a comprehensive set of quality gates, including comprehensive code reviews, ad-hoc testing, automated component-based and scenario-based tests, feature flighting, and regional safe deployment. However, even with these safeguards, live site incidents can and do happen.
Live site incidents can be divided into several categories:
Dependent-service issues such as Azure AD, Azure SQL, Storage, virtual machine scale set, Service Fabric.
Infrastructure outage such as a hardware failure, data center failure.
Fabric environmental configuration issues such as insufficient capacity.
Fabric service code regressions
Customer misconfiguration such as insufficient resources and bad queries or reports.
Reducing incident volume is one way to decrease live site burden and to improve customer satisfaction. However, doing so isn't always possible given that some of the incident categories are outside the team's direct control. Furthermore, as the service footprint expands to support growth in usage, the probability of an incident occurring due to external factors increases. High incident counts can occur even in cases where the Fabric service has minimal service code regressions, and has met or exceeded its Service Level Objective (SLO) for overall reliability of 99.95%, which has led the Fabric team to devote significant resources to reducing incident impact.
Live site incident process
When investigating live site incidents, the Fabric team follows a standard operational process that's common across Microsoft and the industry. The following image summarizes the standard live site incident handling lifecycle.
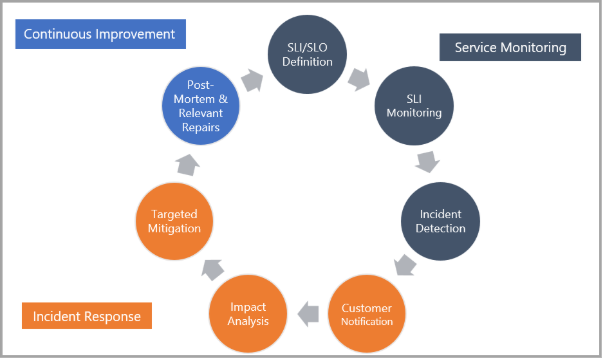
Phase 1: Service monitoring The SRE team works with engineers, program managers, and the Senior Leadership Team to define Service Level Indicators (SLIs) and Service Level Objectives (SLOs) for both major scenarios and minor scenarios. These objectives apply to different metrics of the service, including reliability scenarios and components, performance (latency) scenarios and components, and resource consumption. The live site team and product team then craft alerts that monitor Service Level Indicators (SLIs) against agreed upon targets. When violations are detected, an alert is triggered for investigation.
Phase 2: Incident response - Processes are structured to facilitate the following results:
Prompt and target notifications to customers of any relevant impact
Analysis of affected service components and workflows
Targeted mitigation of incident impact
Phase 3: Continuous improvement - Completion of relevant post-mortem analysis and resolution of any identified process, monitoring, or configuration or code fixes. The fixes are then prioritized against the team's general engineering backlog based on overall severity and risk of reoccurrence.
Our practices for service monitoring
The Fabric team emphasizes a consistent, data-driven, and customer-centric approach to its live site operations. Defining Service Level Indicators (SLIs) and implementing corresponding live site monitoring alerts is part of the approval criteria for enabling any new Fabric feature in production. Product group engineers also include steps for investigation and mitigation of alerts when they occur using a template Troubleshooting Guide (TSG). Those deliverables are then presented to the Site Reliability Engineering (SRE) team.
One way in which the Fabric team enables exponential service growth is by using an SRE team. These individuals are skilled with service architecture, automation and incident management practices, and are embedded within incidents to drive end-to-end resolution. The approach contrasts with the rotational model where engineering leaders from the product group take on an incident manager role for only a few weeks per year. The SRE team ensures that a consistent group of individuals are responsible for driving live site improvements and ensuring that learnings from previous incidents are incorporated into future escalations. The SRE team also assists with large-scale drills that test Business Continuity and Disaster Recovery (BCDR) capabilities of the service.
SRE team members use their unique skill set and considerable live site experience, and also partner with feature teams to enhance SLIs and alerts provided by the product team in numerous ways. Some of the ways they enhance SLIs include:
Anomaly Alerts - SREs develop monitors that consider typical usage and operational patterns within a given production environment and alert when significant deviations occur. Example: Datasets refresh latency increases by 50% relative to similar usage periods.
Customer/Environment-Specific Alerts - SREs develop monitors that detect when specific customers, provisioned capacities, or deployed clusters deviate from expected behavior. Example: A single capacity owned by a customer is failing to load datasets for querying.
Fine-Grained Alerts - SREs consider subsets of the population that might experience issues independently of the broader population. For such cases, specific alerts are crafted to ensure that alerts will in fact fire if those less common scenarios fail despite lower volume. Example: Refreshing datasets that use the GitHub connector are failing
Perceived Reliability Alerts - SREs also craft alerts that detect cases when customers are unsuccessful due to any type of error. This can include failures from user errors and indicate a need for improved documentation or a modified user experience. These alerts also can notify engineers of unexpected system errors that might otherwise be misclassified as a user error. Example: Dataset refresh fails due to incorrect credentials
Another critical role of the SRE team is to automate TSG actions to the extent possible through Azure Automation. In cases where complete automation isn't possible, the SRE team defines actions to enrich an alert with useful and incident-specific diagnostic information to accelerate subsequent investigation. Such enrichment is paired with prescriptive guidance in a corresponding TSG so that live site engineers can either take a specific action to mitigate the incident or quickly escalate to SMEs for an additional investigation.
As a direct result of these efforts, more than 82% of incidents are mitigated without any human interaction. The remaining incidents have enough enrichment data and supporting documentation to be handled without SME involvement in 99.7% of cases.
Live Site SREs also enforce alert quality in several ways, including the following:
Ensuring that TSGs include impact analysis and escalation policy
Ensuring that alerts execute for the absolute smallest time window possible for faster detection
Ensuring that alerts use reliability thresholds instead of absolute limits to scale clusters of different size
Our practices for incident response
When an automated live site incident is created for the Fabric service, one of the first priorities is to notify customers of potential impact. Azure has a target notification time of 15 minutes, which is difficult to achieve when notifications are manually posted by incident managers after joining a call. Communications in such cases are at risk of being late or inaccurate due to required manual analysis. Azure Monitoring offers centralized monitoring and alerting solutions that based on certain metrics within this time window, can detect possible impact. However, Fabric is an SaaS offering with complex scenarios and user interactions that can't be easily modeled and tracked using such alerting systems. In response, the Fabric team developed the Time To Notify Zero (TTN0) notification service.
Fabric’s live site philosophy emphasizes automated resolution of incidents to improve overall scalability and sustainability of the SRE team. The emphasis on automation enables mitigation at scale and can potentially avoid costly rollbacks or risky expedited fixes to production systems. When manual investigation is required, Fabric adopts a tiered approach with initial investigation done by a dedicated SRE team. SRE team members are experienced in managing live site incidents, facilitating cross-team communication, and driving mitigation. In cases where the acting SRE team member requires more context on an impacted scenario/component, they might engage the Subject Matter Expert (SME) of that area for guidance. Finally, the SME team conducts simulations of system component failures to understand and to mitigate issues in advance of an active live site incident.
Once the affected component or scenario of the service is determined, the Fabric team has multiple techniques for quickly mitigating impact. Some of them are:
Activate side-by-side deployment infrastructure - Fabric supports running different versioned workloads in the same cluster, allowing the team to run a new (or previous) version of a specific workload for certain customers without triggering a full-scale deployment (or rollback). The approach can reduce mitigation time to 15 minutes and lower overall deployment risk.
Execute Business Continuity/Disaster Recovery (BCDR) process - Allows the team to fail over primary workloads to this alternate environment in three minutes if a serious issue is found in a new service version. BCDR can also be used when environmental factors or dependent services prevent the primary cluster/region from operating normally.
Leverage resiliency of dependent services - Fabric proactively evaluates and invests in resiliency and redundancy efforts for all dependent services (such as SQL, Redis Cache, Key Vault). Resiliency includes sufficient component monitoring to detect upstream and downstream regressions as well as local, zone, and regional redundancy (where applicable). Investing in these capabilities ensures that tooling exists for automatic or manual triggering of recovery operations to mitigate impact from an affected dependency.
Time To Notify Zero
Time To Notify Zero, also known as TTN0, is a fully automated incident notification service that uses our internal alerting infrastructure to identify specific scenarios and customers that are impacted by a newly created incident. It's also integrated with external monitoring agents outside of Azure to detect connectivity issues that might otherwise go unnoticed. TTN0 allows customers to receive an email when TTN0 detects a service disruption or degradation. With TTN0, the Fabric team can send reliable, targeted notifications within 10 minutes of impact start time (which is 33% faster than the Azure target). Since the solution is fully automated, there's minimal risk from human error or delays.
Our practices for continuous improvement
The Fabric team reviews all customer-impacting incidents during a weekly service review with representation from all engineering groups that contribute to the Fabric service. The review disseminates key learnings from the incident to leaders across the organization and provides an opportunity to adapt our processes to close gaps and address inefficiencies.
Prior to review, the SRE team prepares post-mortem content and identifies preliminary repair items for the live site team and product development team. Items might include code fixes, augmented telemetry, or updated alerts or TSGs. Fabric SREs are familiar with many of these areas and often proactively make the adjustments in real time while responding to an active incident. Doing so helps to ensure that changes are incorporated into the system in time to detect reoccurrence of a similar issue. In cases where an incident was the result of a customer escalation, the SRE team adjusts existing automated alerting and SLIs to reflect customer expectations. For the small number of incidents that require escalation to a Subject Matter Expert (SME) of the impacted scenario/component, the Fabric SRE team will review ways in which the same incident (or similar incidents) could be handled without escalation in the future. The detailed analysis by the SRE team helps the product development team to design a more resilient, scalable, and supportable product.
Beyond review of specific postmortems, the SRE team also generates reports on aggregate incident data to identify opportunities for service improvement such as future automation of incident mitigation or product fixes. The reporting combines data from multiple sources, including the customer support team, automated alerting, and service telemetry. The consolidated view provides visibility into those issues that are most negatively impacting service and team health, and the SRE team then prioritizes potential improvements based on overall benefit to service reliability. For example, if a particular alert is firing too frequently or generating disproportionate impact on service reliability, the SRE team can partner with the product development team to invest in relevant quality improvements. Completing these work items drives improvement to service and live site metrics and directly contributes to organizational objective key results (OKRs). In cases where an SLI has been consistently met for a long period of time, the SRE team may suggest increases to the service SLO to provide an improved experience for our customers.
Measuring success through objective key results (OKRs)
The Fabric team has a comprehensive set of Objective Key Results (OKRs) that are used to ensure overall service health and customer satisfaction. OKRs can be divided into two categories:
Service Health OKRs - These OKRs directly or indirectly measure the health of scenarios or components in the service and often are tracked by monitoring or alerting. Example: A single capacity owned by a customer is failing to load datasets for querying.
Live Site Health OKRs - These OKRs directly or indirectly measure how efficiently, and effectively live site operations are addressing service incidents and outages. Example: Time To Notify (TTN) customers of an impacting incident.
The time required for the Fabric team to react to incidents as measured by TTN, TTA, and TTM significantly exceeds targets. Alert automation directly correlates with the team’s ability to sustain exponential service growth, while continuing to meet or exceed target response times for incident alerting, notification, and mitigation.
The above OKRs are actively tracked by the Fabric live site team, and the Senior Leadership Team, to ensure that the team continues to meet or exceed the baseline required to support substantial service growth, to maintain a sustainable live site workload, and to ensure high customer satisfaction.