Note
Access to this page requires authorization. You can try signing in or changing directories.
Access to this page requires authorization. You can try changing directories.
APPLIES TO: ![]() Power BI Desktop
Power BI Desktop ![]() Power BI service
Power BI service
You can add text boxes, shapes, and smart narrative visuals to reports in Power BI Desktop or the Power BI service. The smart narrative visual uses artificial intelligence to provide a text summary of your visuals and reports.
To add text and shapes to a report, you must have permission to edit the report.
Add a text box to a report
This procedure uses the Retail Analysis sample available in the Power BI service.
In Power BI Desktop, go to the Home tab. In the Insert section, select Text box.
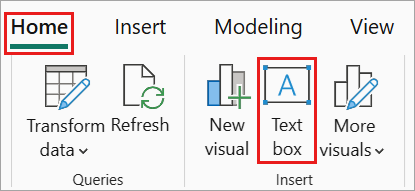
The Text box option is also available on the Insert tab.
Power BI adds an empty text box to the canvas. To position the text box, select the grey area at the top and drag it to your desired location. To resize the text box, select and drag any of the sizing handles.
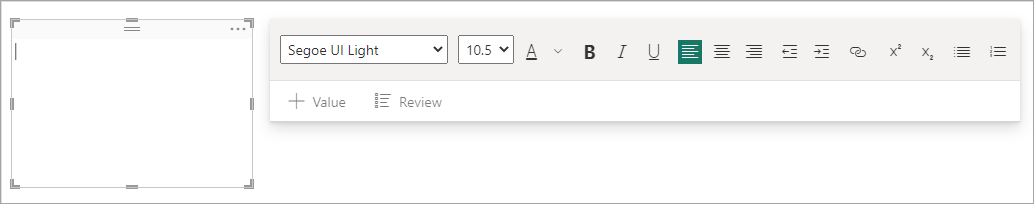
Type your text into the text box. Set the font style for your text. Font styles include color, size, and subscript or superscript, and text alignment, including indents and bulleted lists.
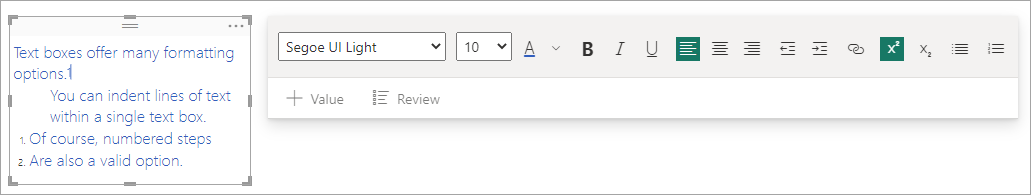
With the text box still selected, add other formatting in the Format text box pane. In this example, the text has a theme color, and added bullets and superscript. You can also specify an exact size and position for a text box.
When you finish editing the text box, select any blank space on the report canvas.
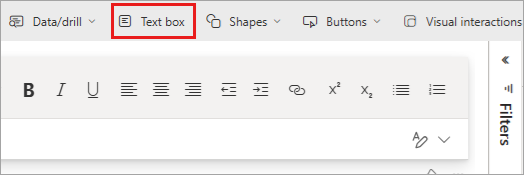
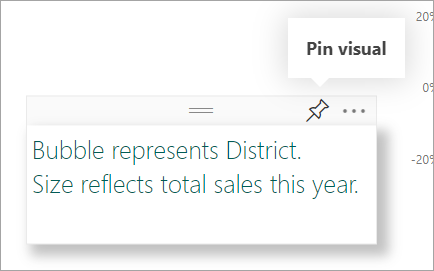
In the Power BI service, you can also pin a text box to a dashboard. Select the pin icon, and then select the dashboard where you want to pin it.
Add dynamic values to a text box
You can display dynamic measure values in text boxes rather than just static text. This feature is particularly useful when you want to show key metrics with custom formatting alongside other report content.
To add a dynamic measure value to a text box:
- Select the text box in your report.
- In the Format pane, under Values, select the field button (fx icon).
- Choose the measure you want to display.
- The text box displays the measure value, which updates dynamically based on your report filters and slicers.
Format dynamic values
After adding a measure to a text box, you can format how the value displays in the Values section of the Format pane:
- Display units: Choose how to display large numbers (None, Thousands, Millions, Billions, or Trillions). For example, selecting "Thousands" displays 5,000 as "5K".
- Value decimal places: Specify the number of decimal places to show, from 0 to 15.
- Text color: Set the color of the value text.
- Background color: Set the background color behind the value.
- Alignment: Control how the value aligns within the text box (left, center, or right).
If you're using measures with dynamic format strings, the text box automatically applies the formatting defined in the measure. For more information about dynamic format strings, see Create dynamic format strings for measures.
Add a shape to a report
You can add shapes to Power BI reports with various formatting options and styling. You can also upgrade old shapes in your reports.
In Power BI Desktop, go to the Insert tab. In the Elements section, select Shapes.
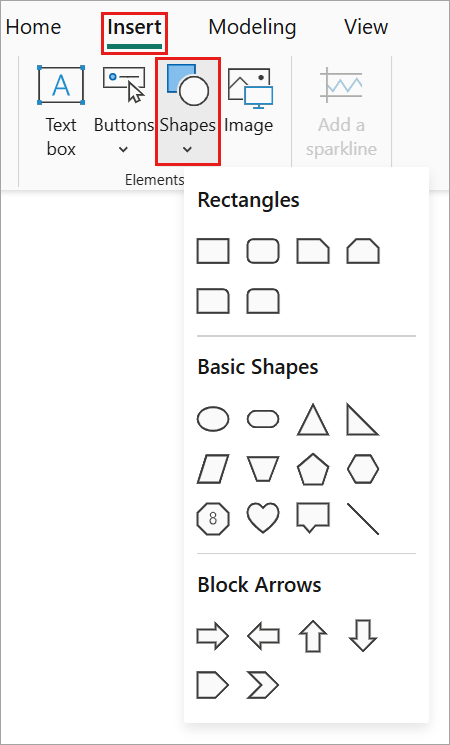
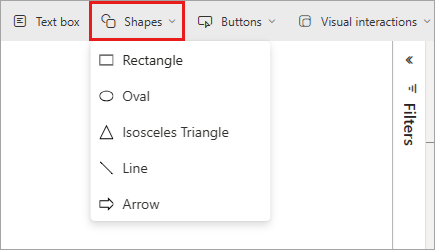
From the dropdown menu, select a shape to add it to your report canvas. In the Format pane, customize the shape to suit your needs. For this example, the arrow is rotated 45 degrees and formatted to include text and a shadow.
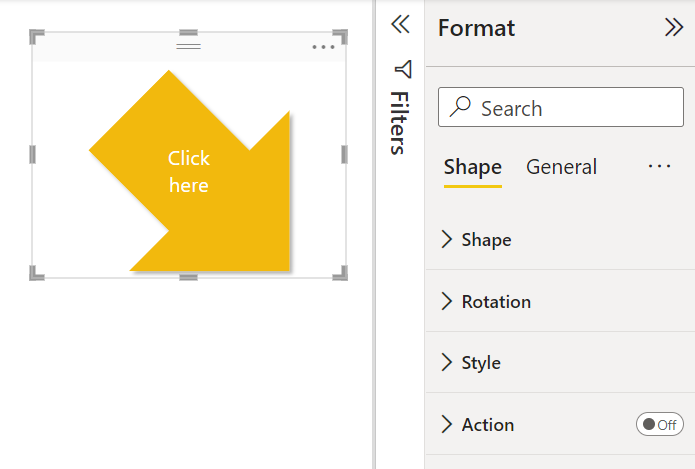
To position the shape, select the grey area at the top and drag to the desired location. To resize the shape, select and drag any of the sizing handles. As with the text box, you can also create an exact size and position for a shape.
Note
You can't pin shapes to a dashboard, except as one of the visuals when you pin a live page.
Add a smart narrative
You can also add a smart narrative to your report. The smart narrative visualization uses artificial intelligence to provide a text summary of your visuals and reports. It provides relevant insights that you can customize.
In the Visualizations pane, select the Smart narrative icon. If you don't see it, you might need to turn on the preview.
Power BI creates a text box with autogenerated text describing interesting features of the data in your report.
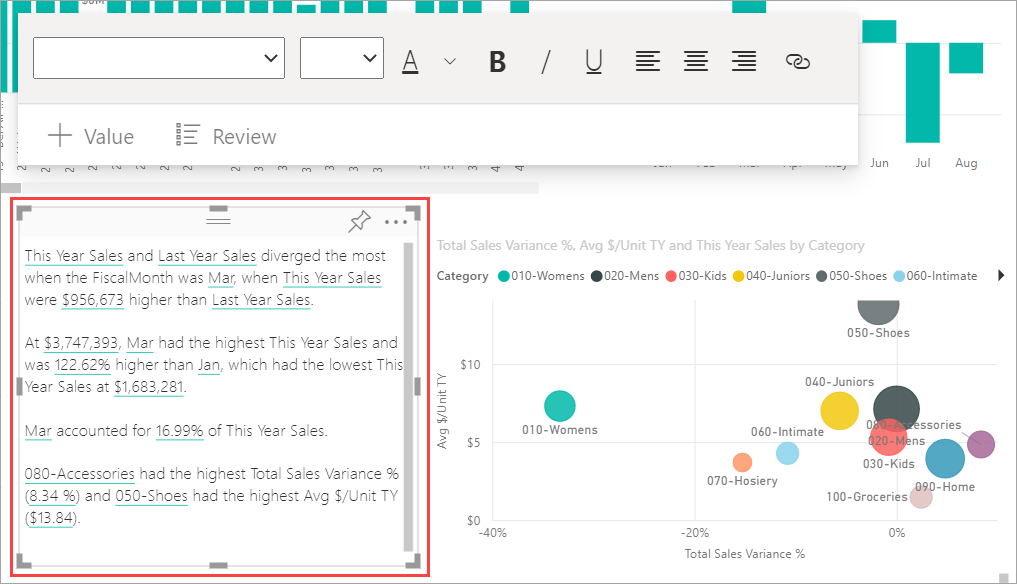
You can format it as you would any other text box. The smart narrative underlines values found in the data.
Read more about smart narratives.
Related content
For more information, see: