Tutorial: Fabric for Power BI users
In this tutorial, you learn how to use Dataflows Gen2 and Pipelines to ingest data into a Lakehouse and create a dimensional model. You also learn how to generate a beautiful report automatically to display the latest sales figures from start to finish in just 45 minutes.
Let’s get started!
- Prepare and load data into a lakehouse
- Build a dimensional model in a lakehouse
- Automatically create a report with quick create
Prerequisites
- Before you start, if you haven't enabled Fabric yet, enable Fabric for your organization
- If you aren't signed up yet, sign up for a free trial.
- Create a new workspace and assign a Fabric capacity.
- An existing workspace can also be used, although we recommend using a nonproduction workspace for simplicity of the tutorial.
- Download the Power Query template file that contains sample queries for Contoso data.
Create a lakehouse to store data
We start by creating a lakehouse to store our data, Dataflows Gen2 to prepare and transform columns, and a pipeline to handle the orchestration of a scheduled refresh and e-mail activity.
Navigate to your workspace and select New. Then select Show all.
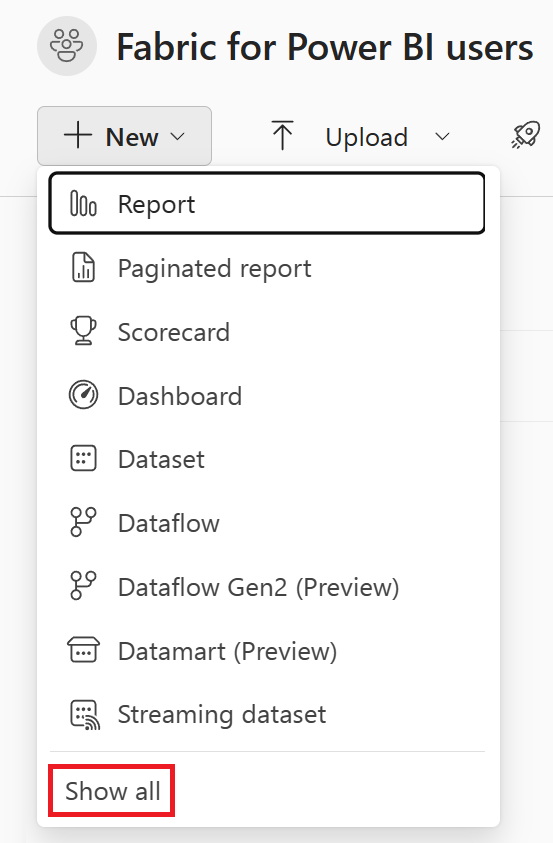
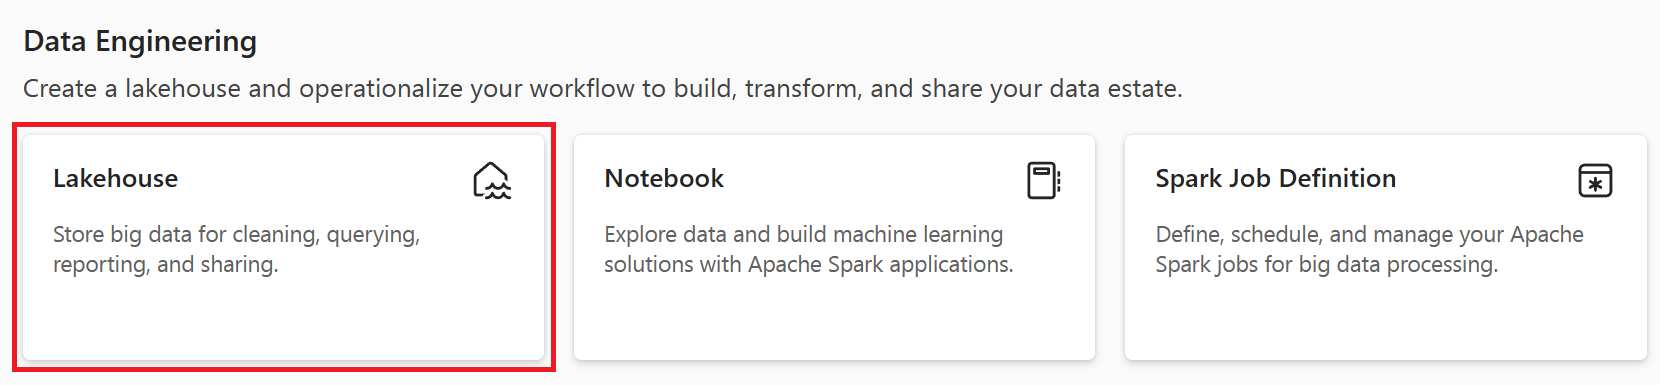
In the New item creation screen, select Lakehouse under the Data engineering category.
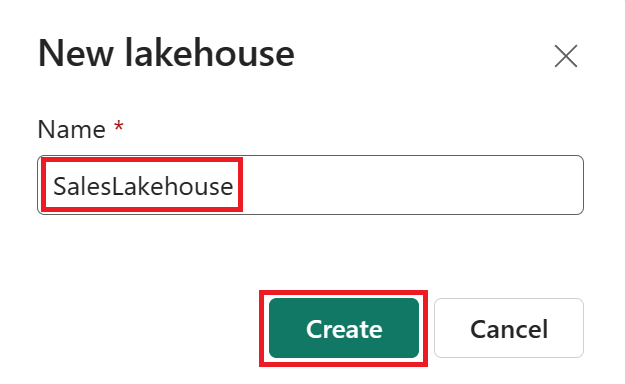
Set the Lakehouse name to SalesLakehouse. Then select Create.
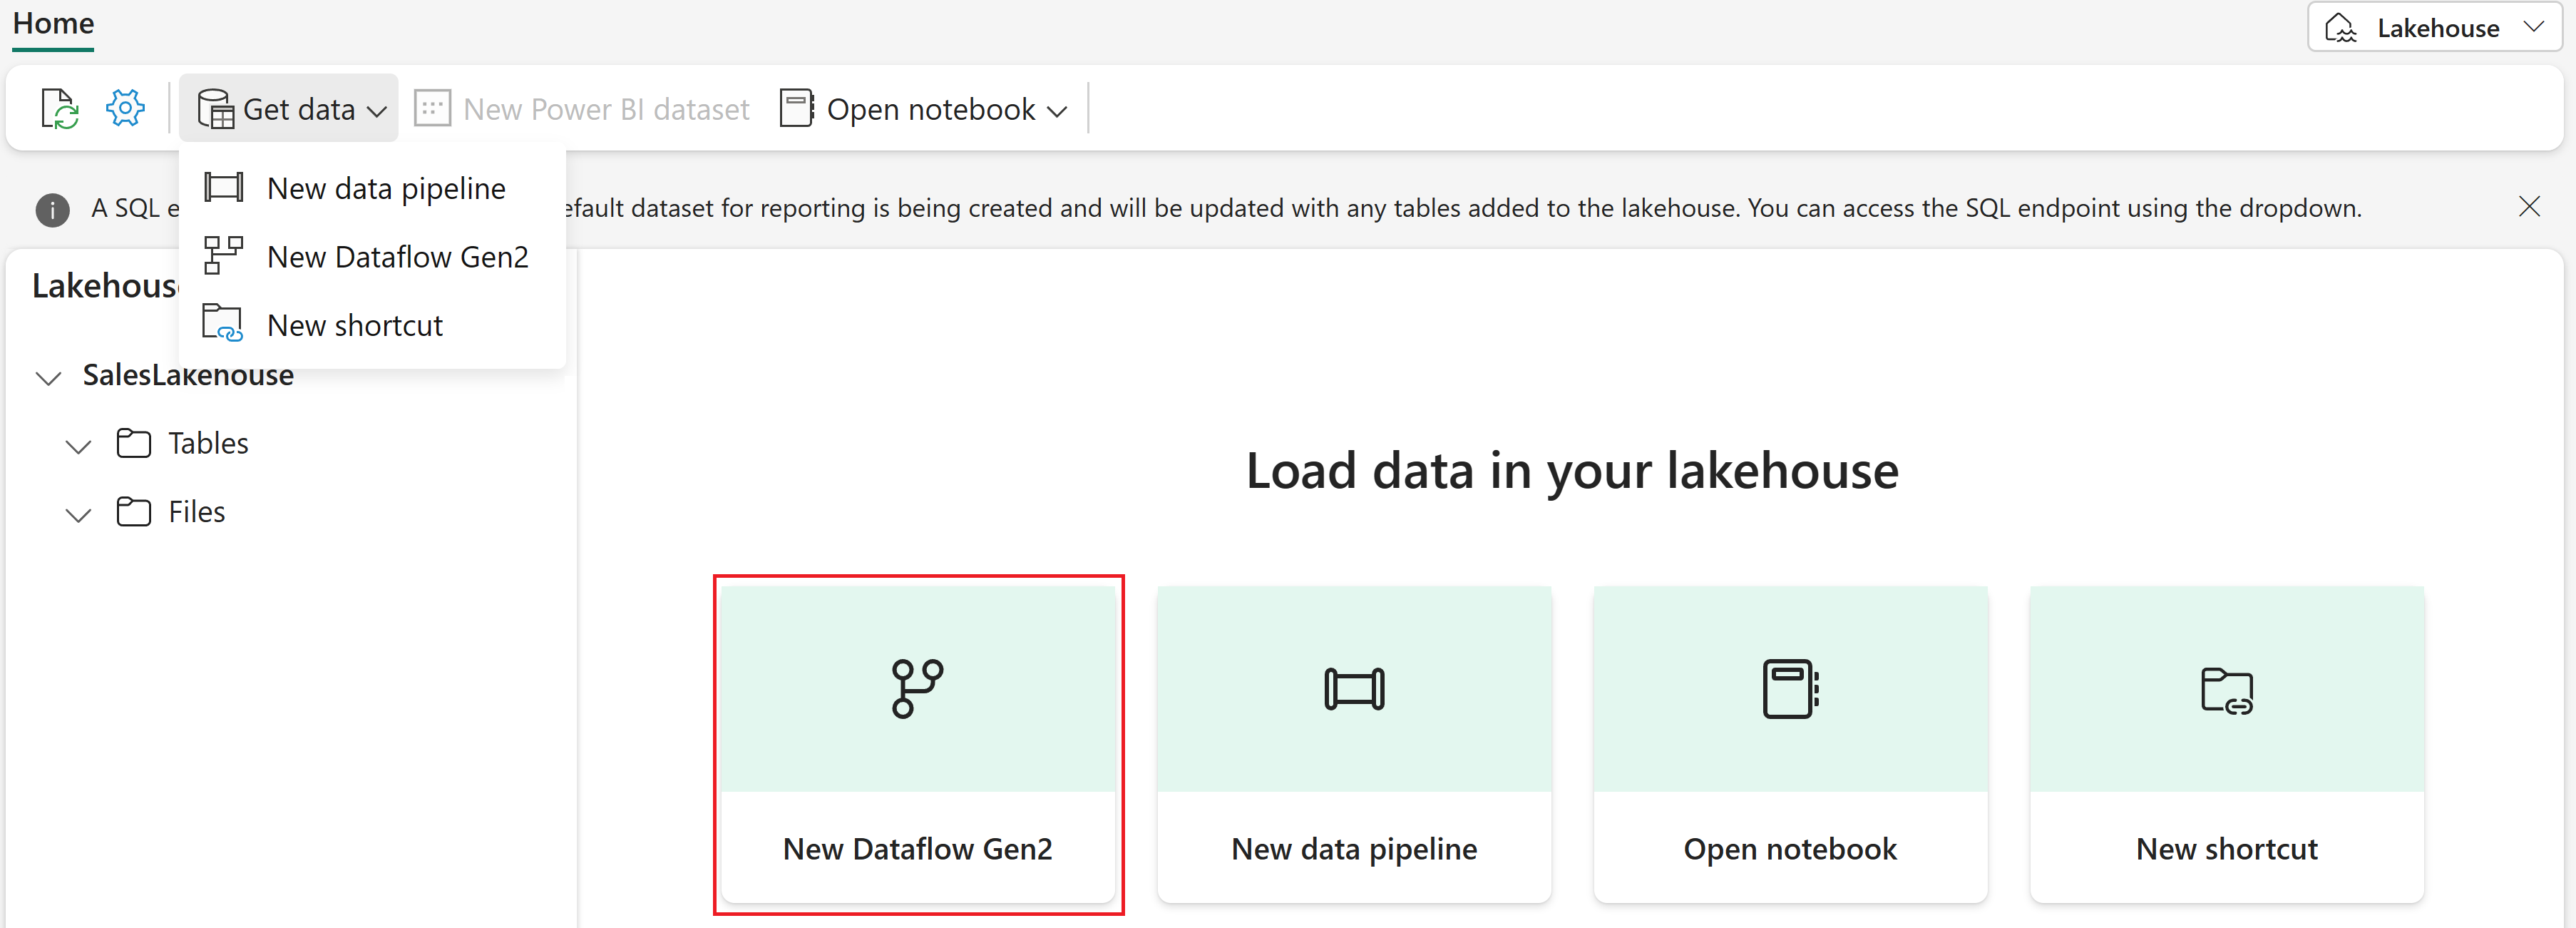
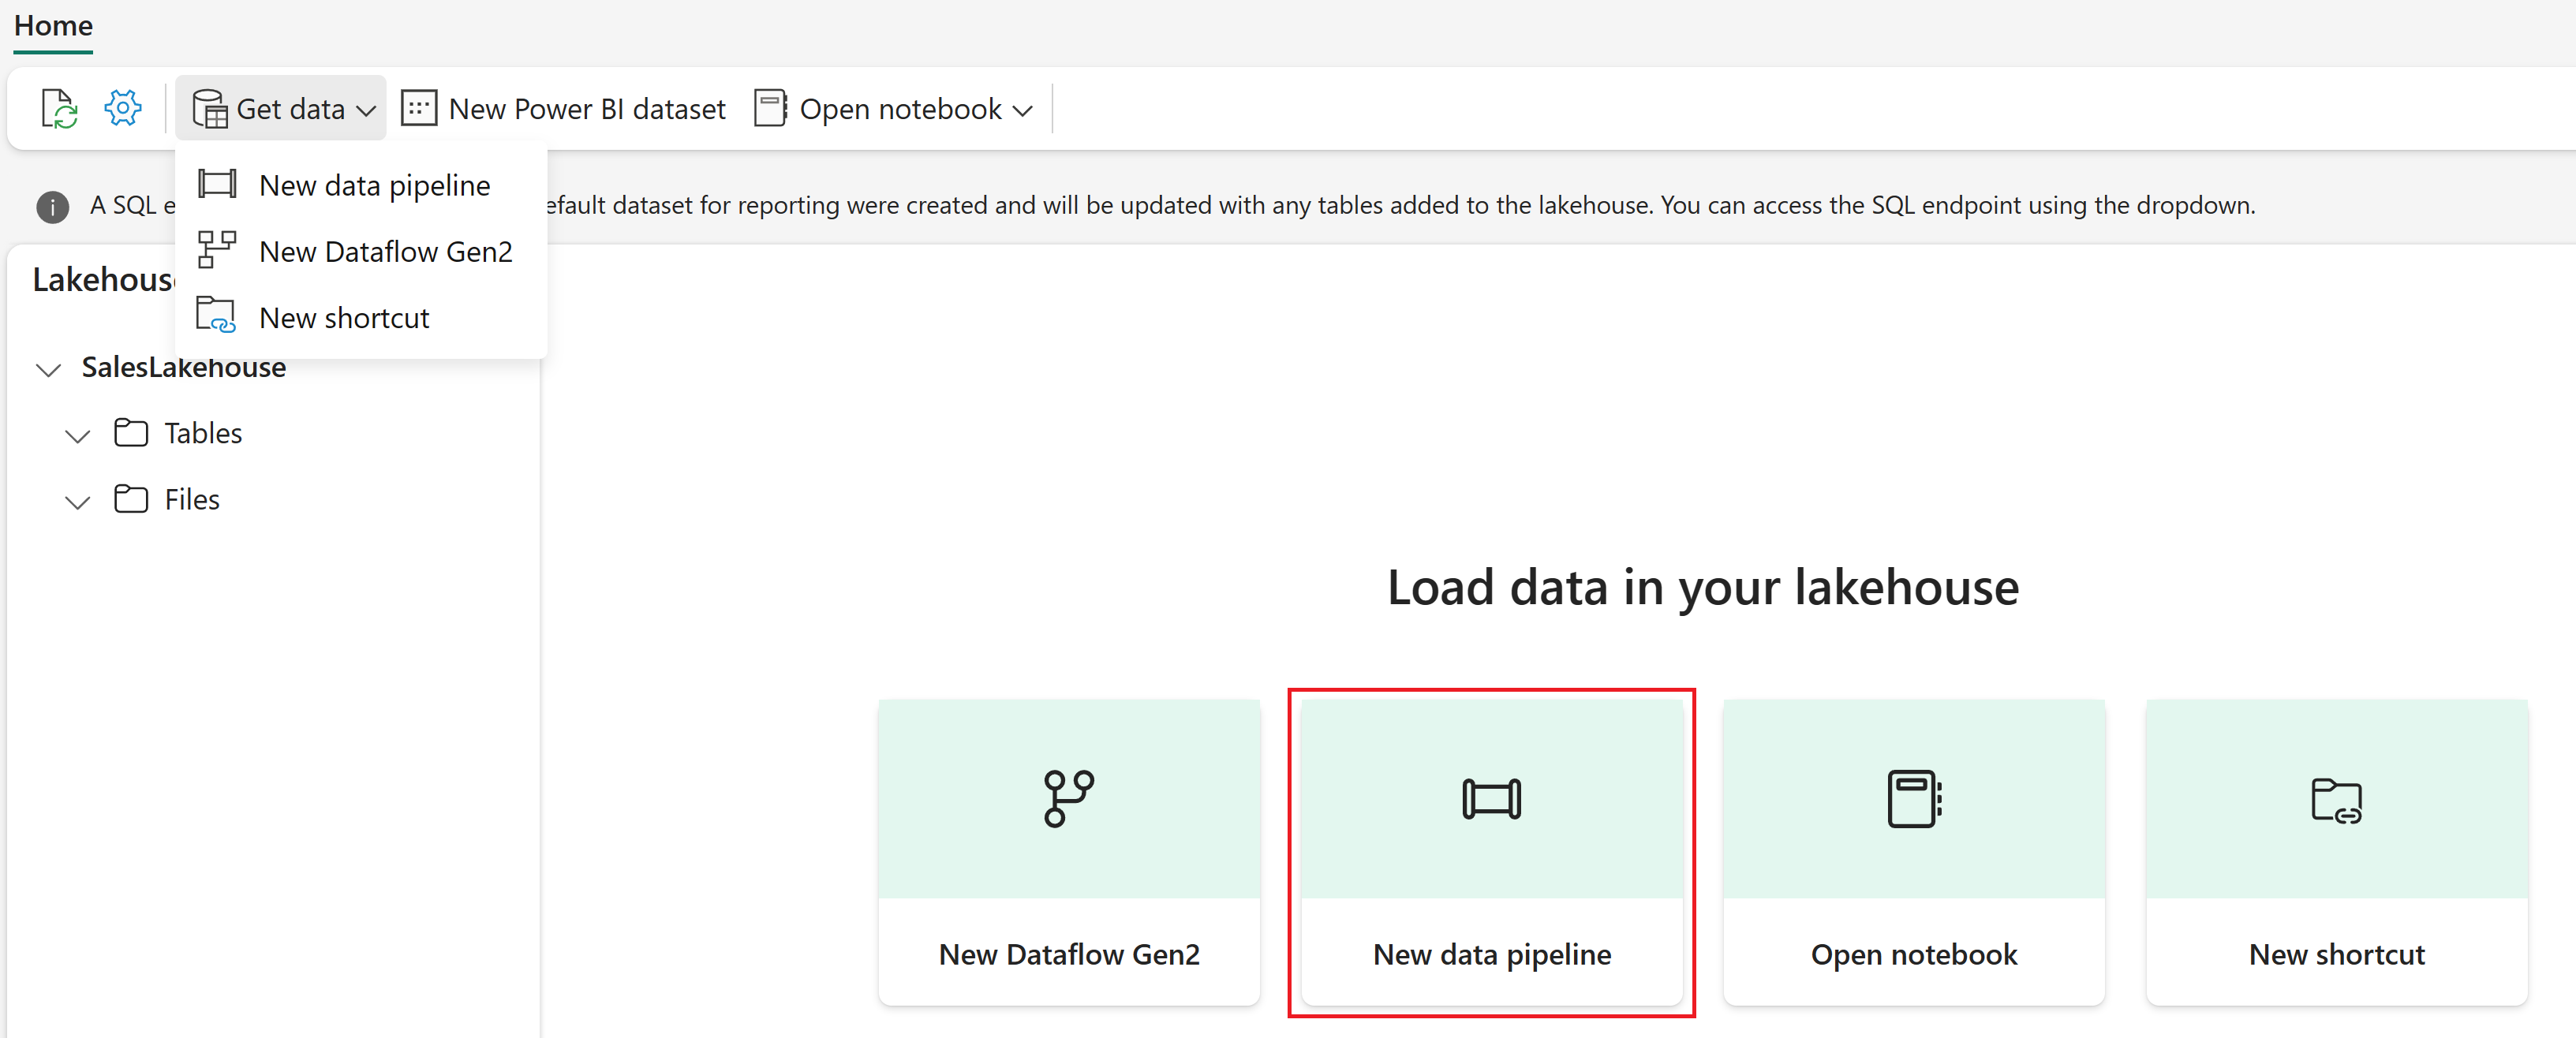
Once you're in the Lakehouse editor, select New Dataflow Gen2.
Note
You can also select Get data from the ribbon and then New Dataflow Gen2.
Prepare and load data into your lakehouse
Take the following steps to load data into your lakehouse:
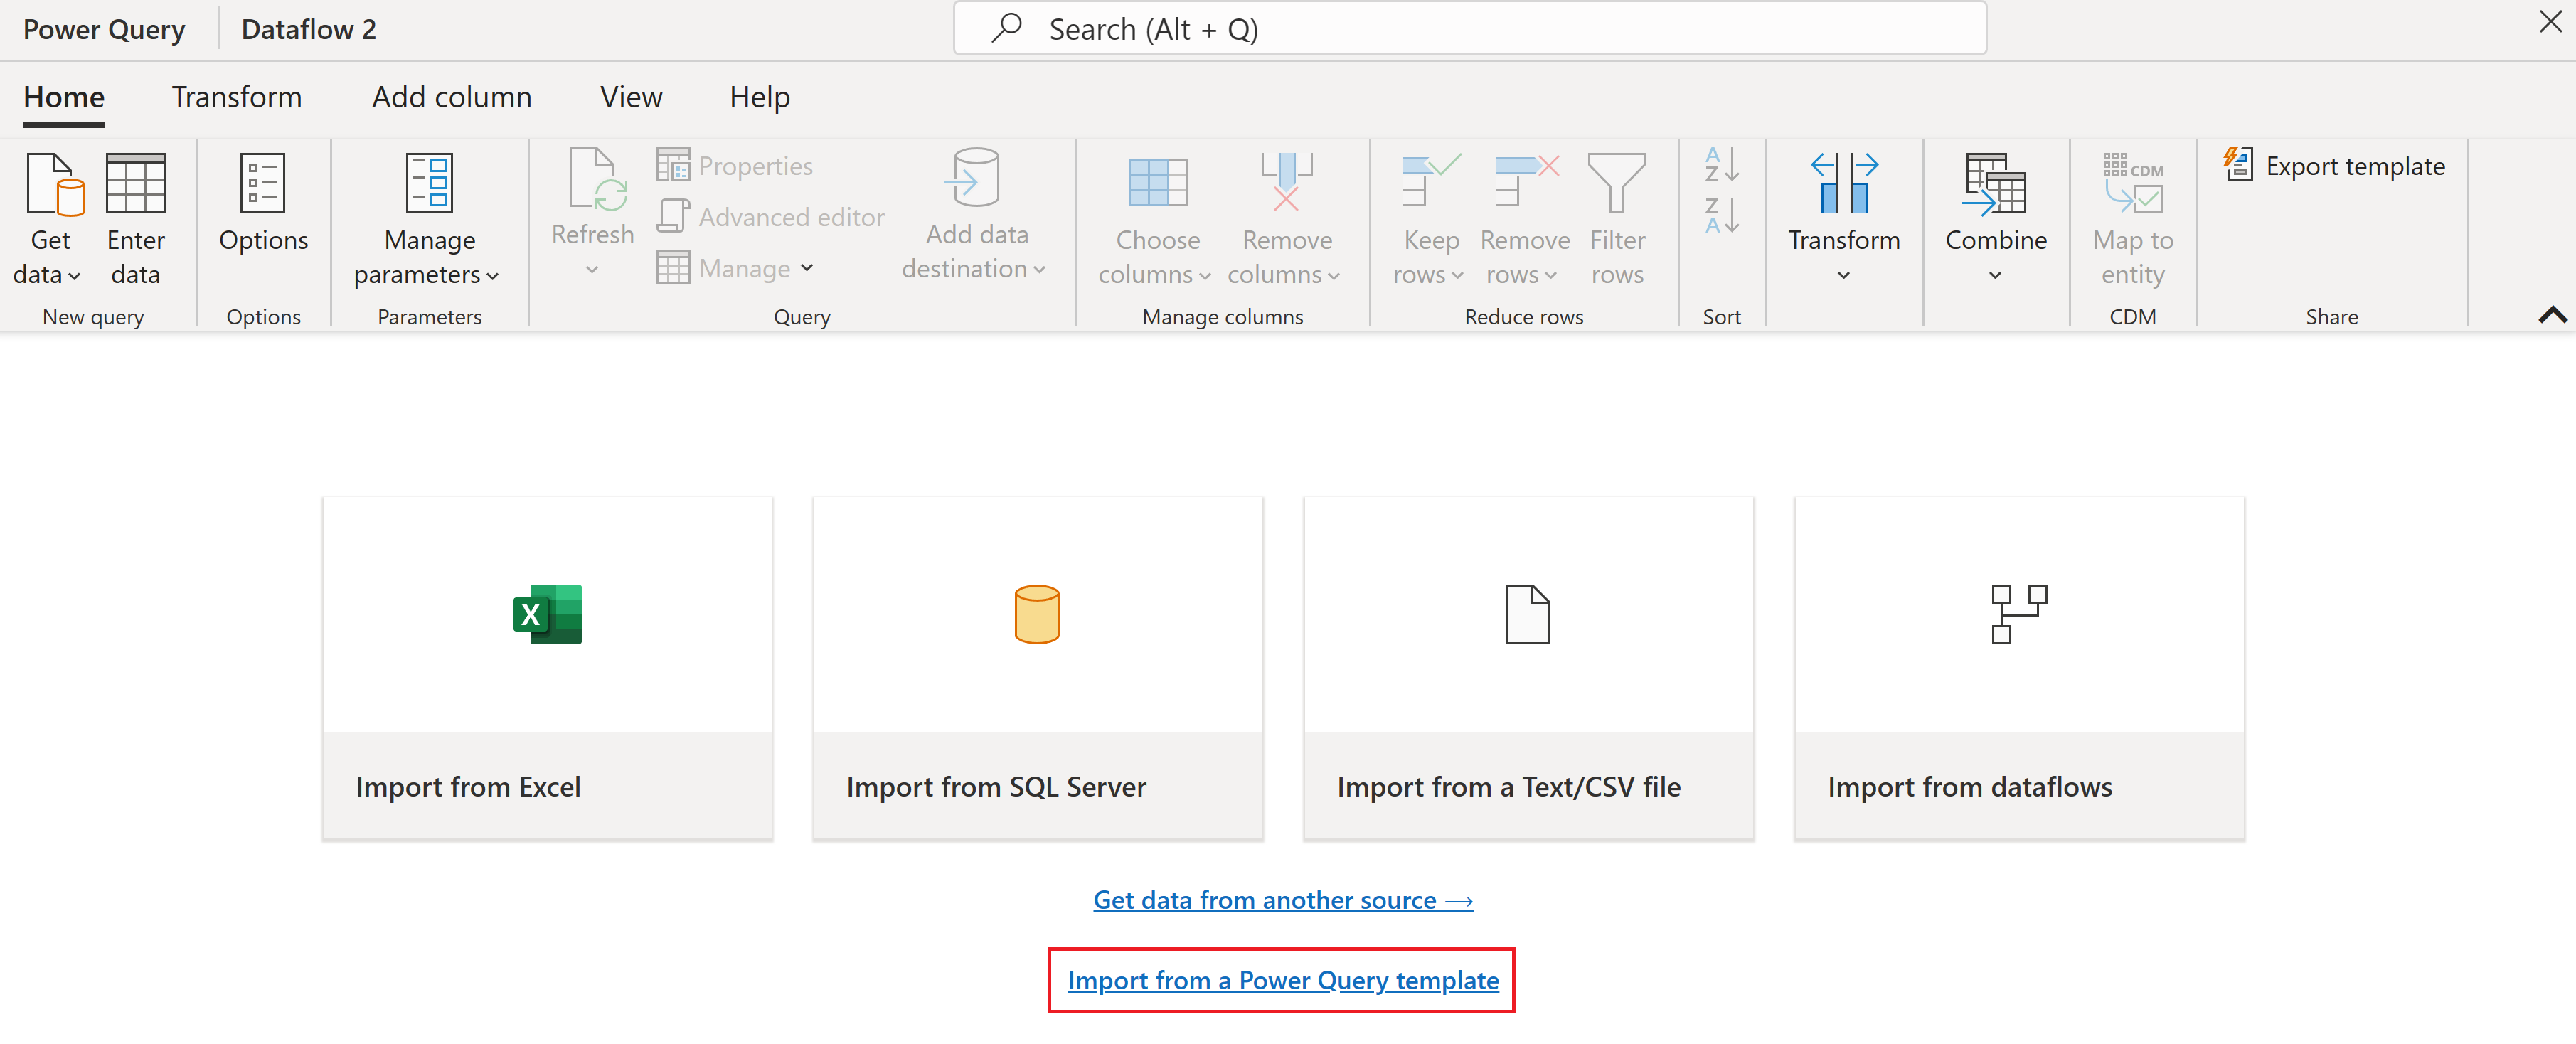
Once you're in the Power Query Online editor for Dataflows Gen2, select Import from a Power Query template and choose the template file downloaded from the prerequisites.
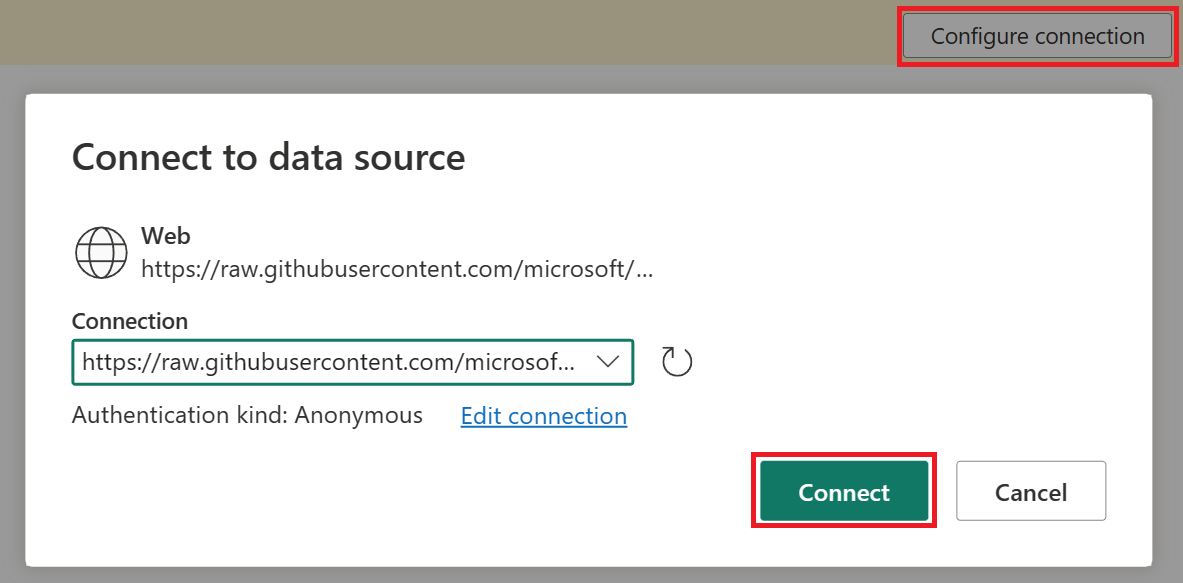
Select the DimDate query under the Data load query group and then select on Configure connection. If necessary, set the authentication type to Anonymous before selecting Connect.
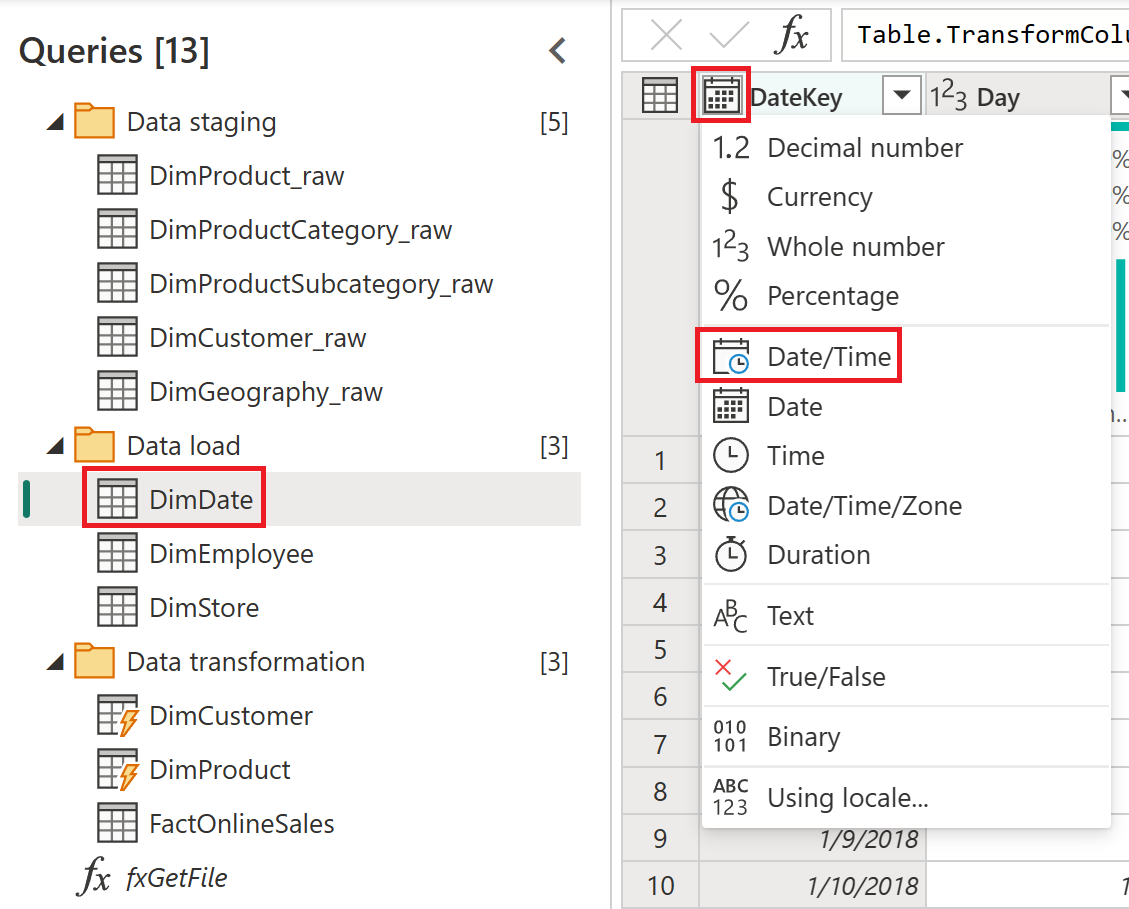
With the DimDate query selected, in the data preview window, change the data type of the DateKey column to Date/Time by selecting the icon in the top left.
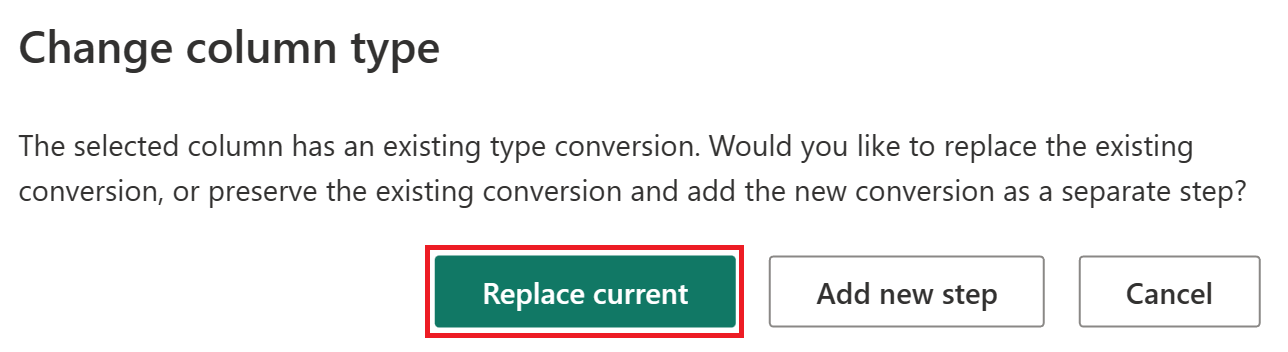
Select Replace current within the Change column type window.
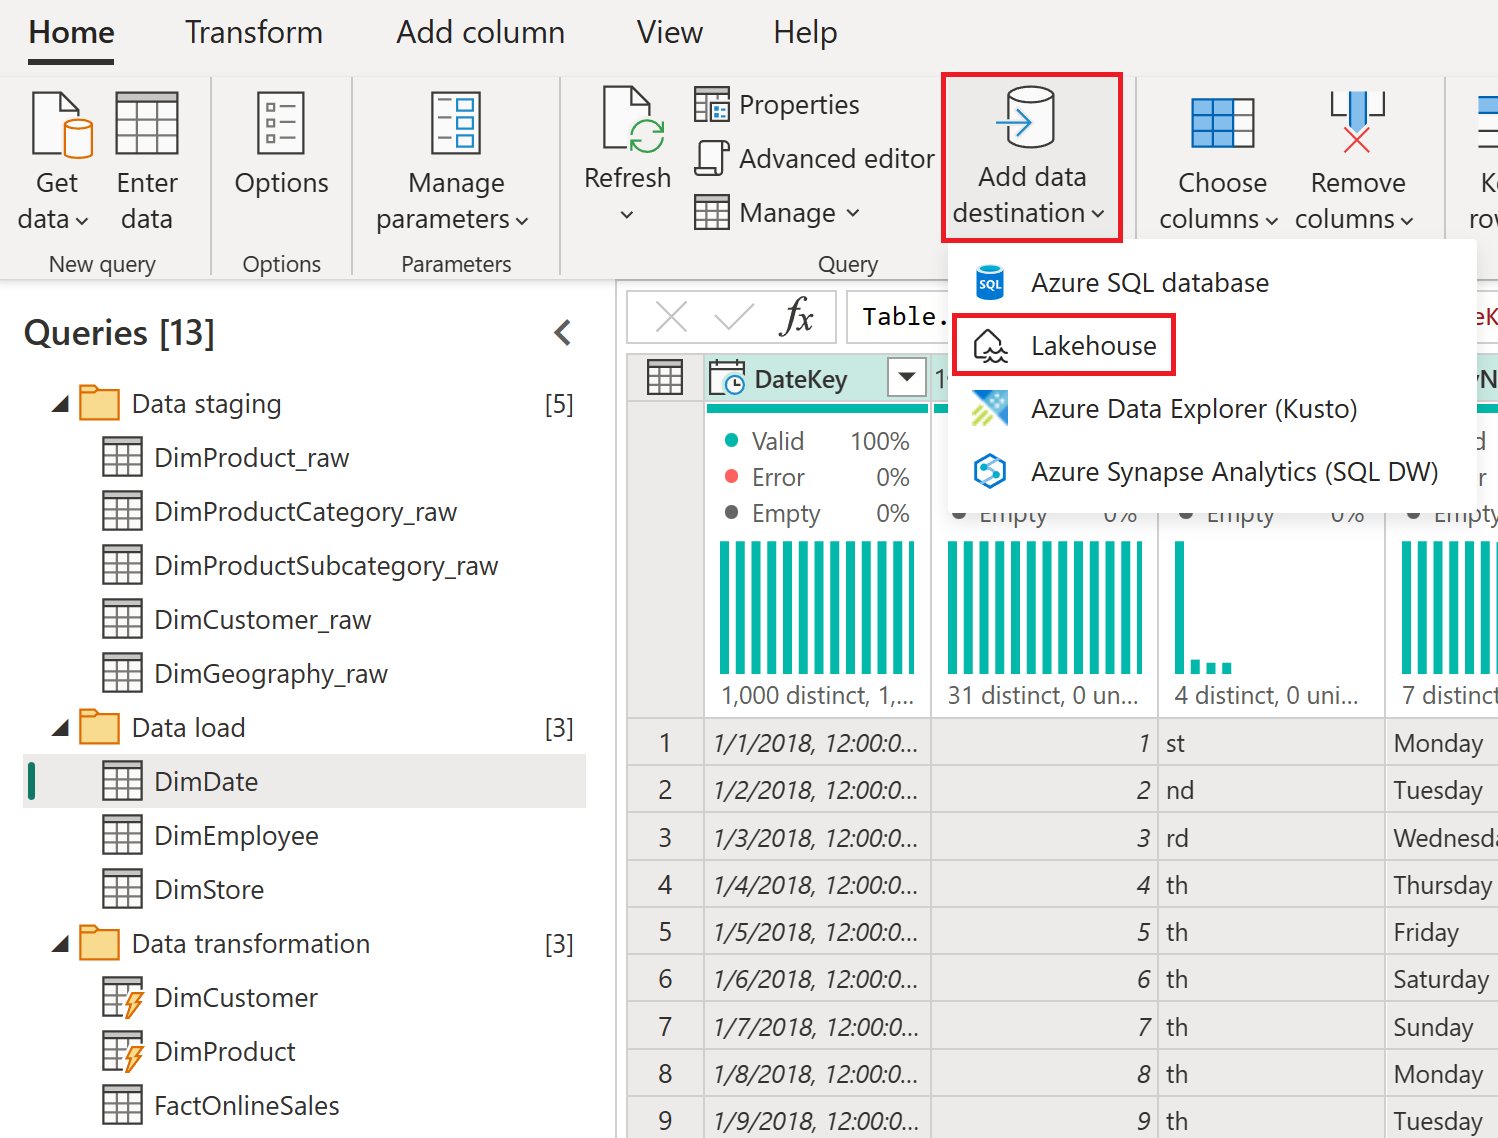
Add a data destination
Take the following steps to add a data destination:
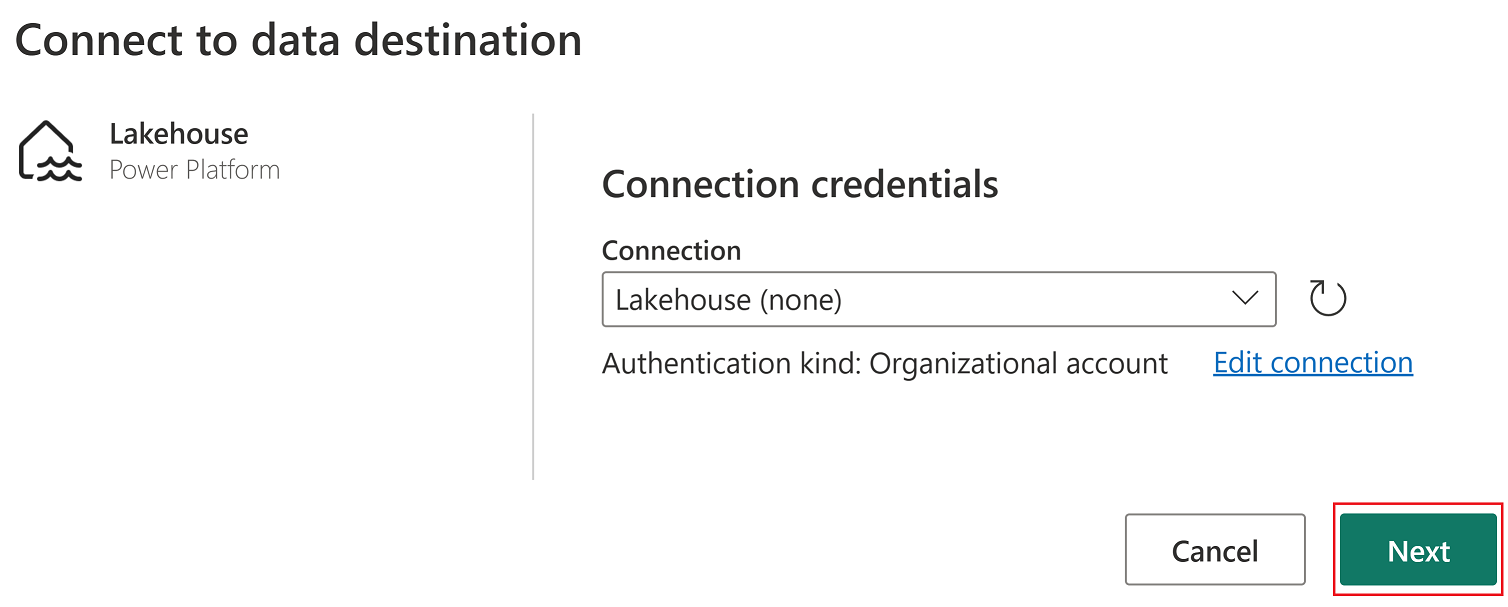
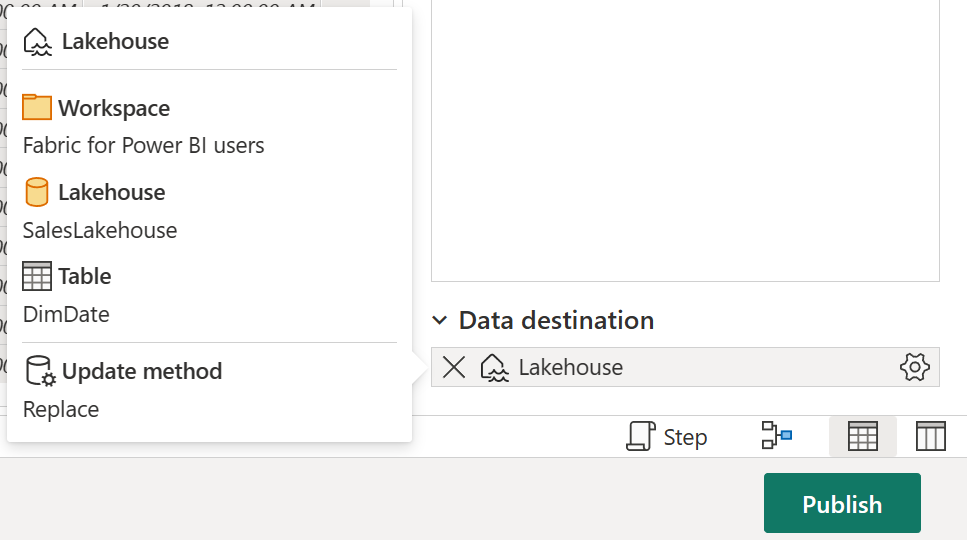
With the DimDate table selected, from the Home tab, select Add data destination and then select the Lakehouse option menu item.
If necessary, set the authentication to Organizational account and then select Next.
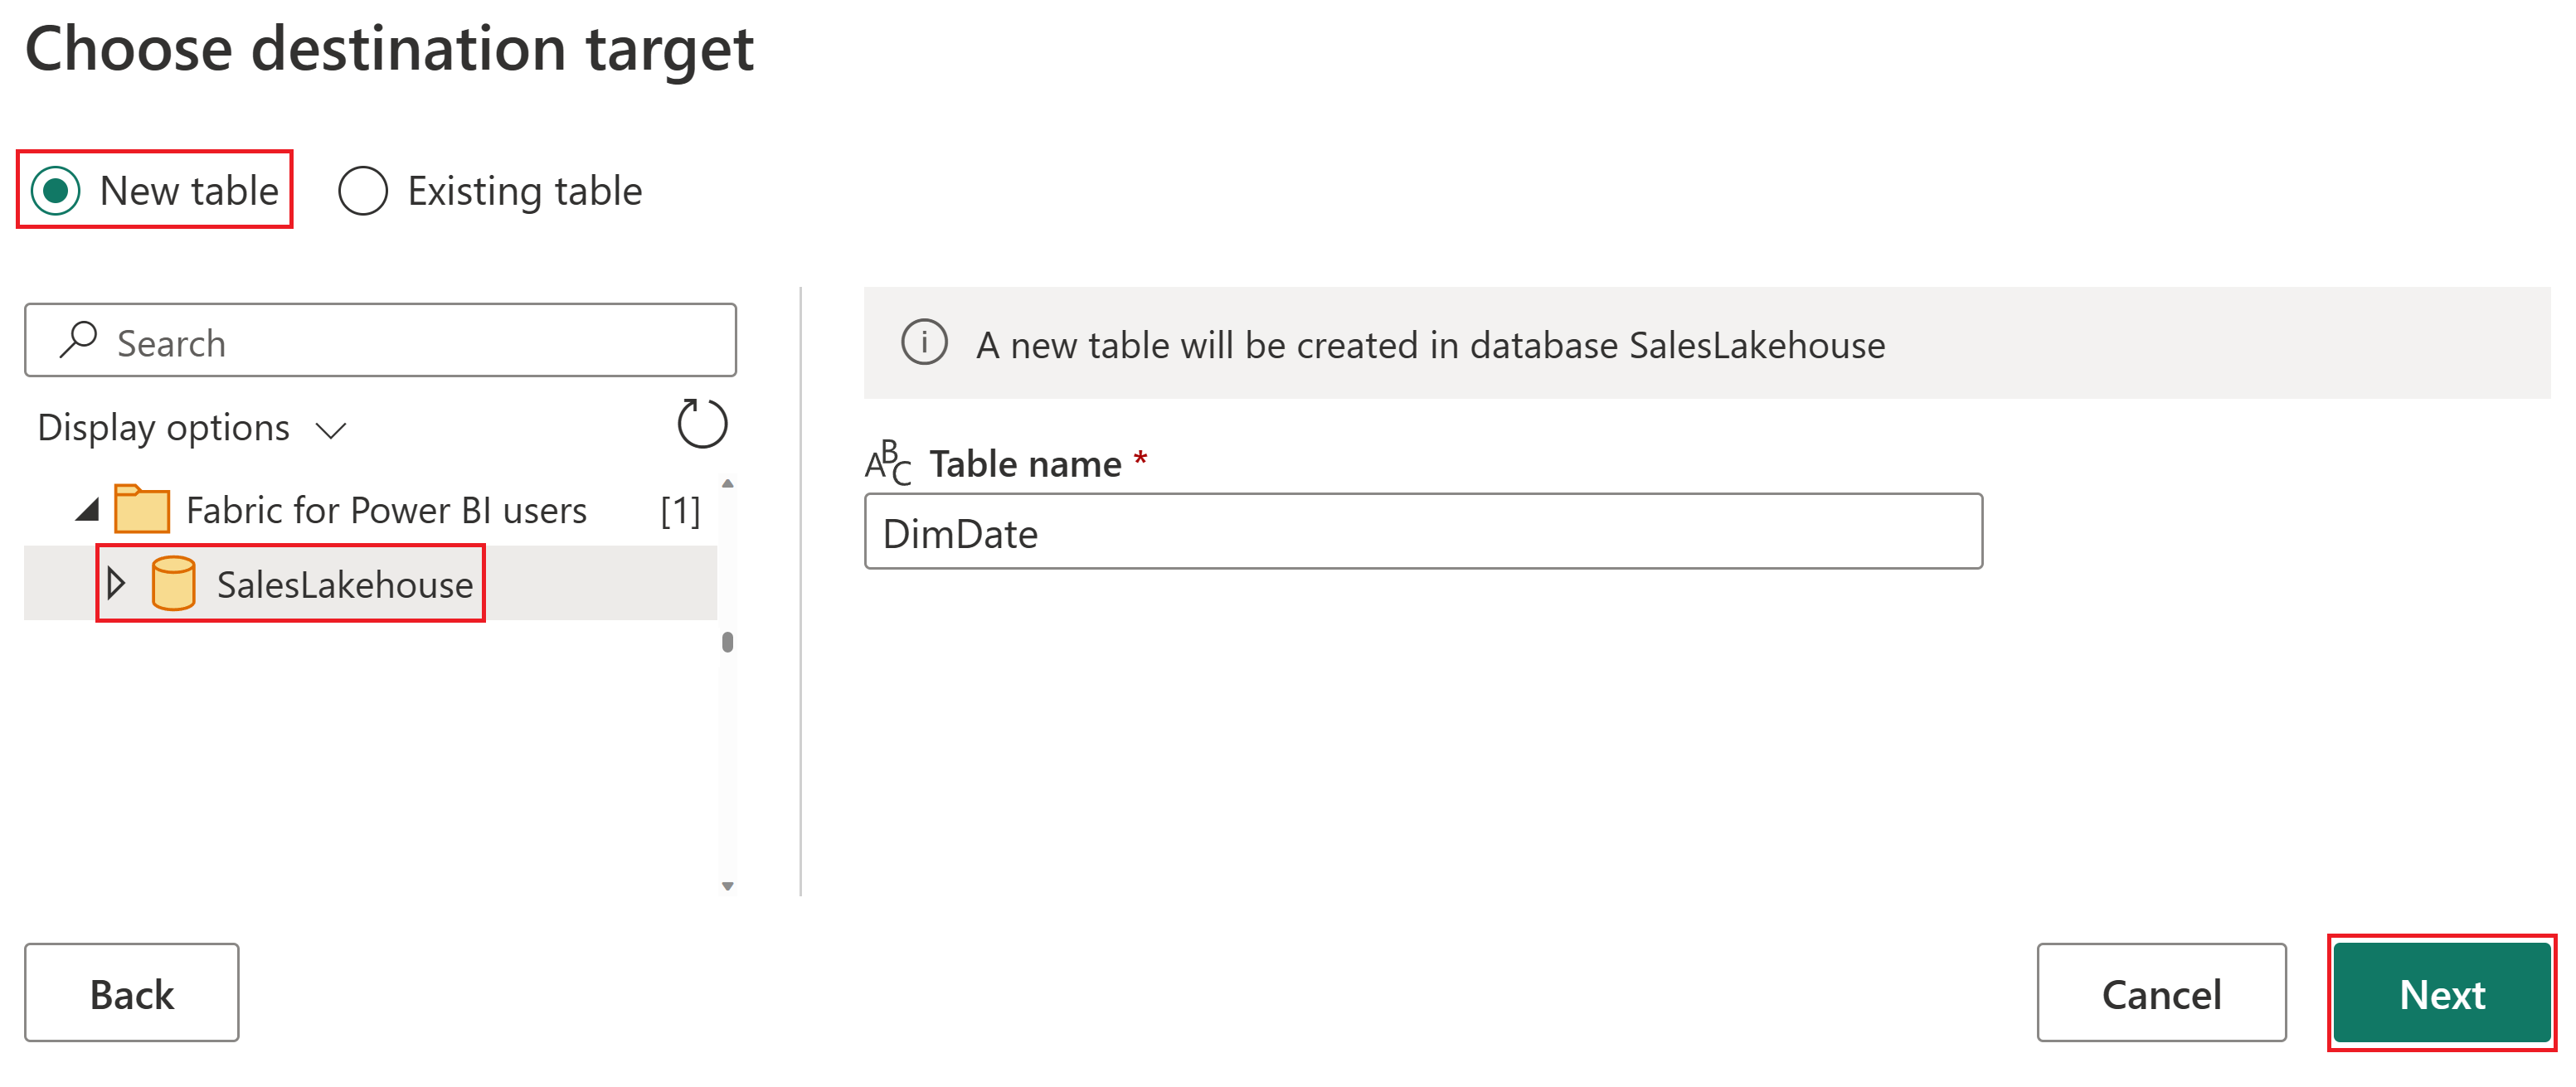
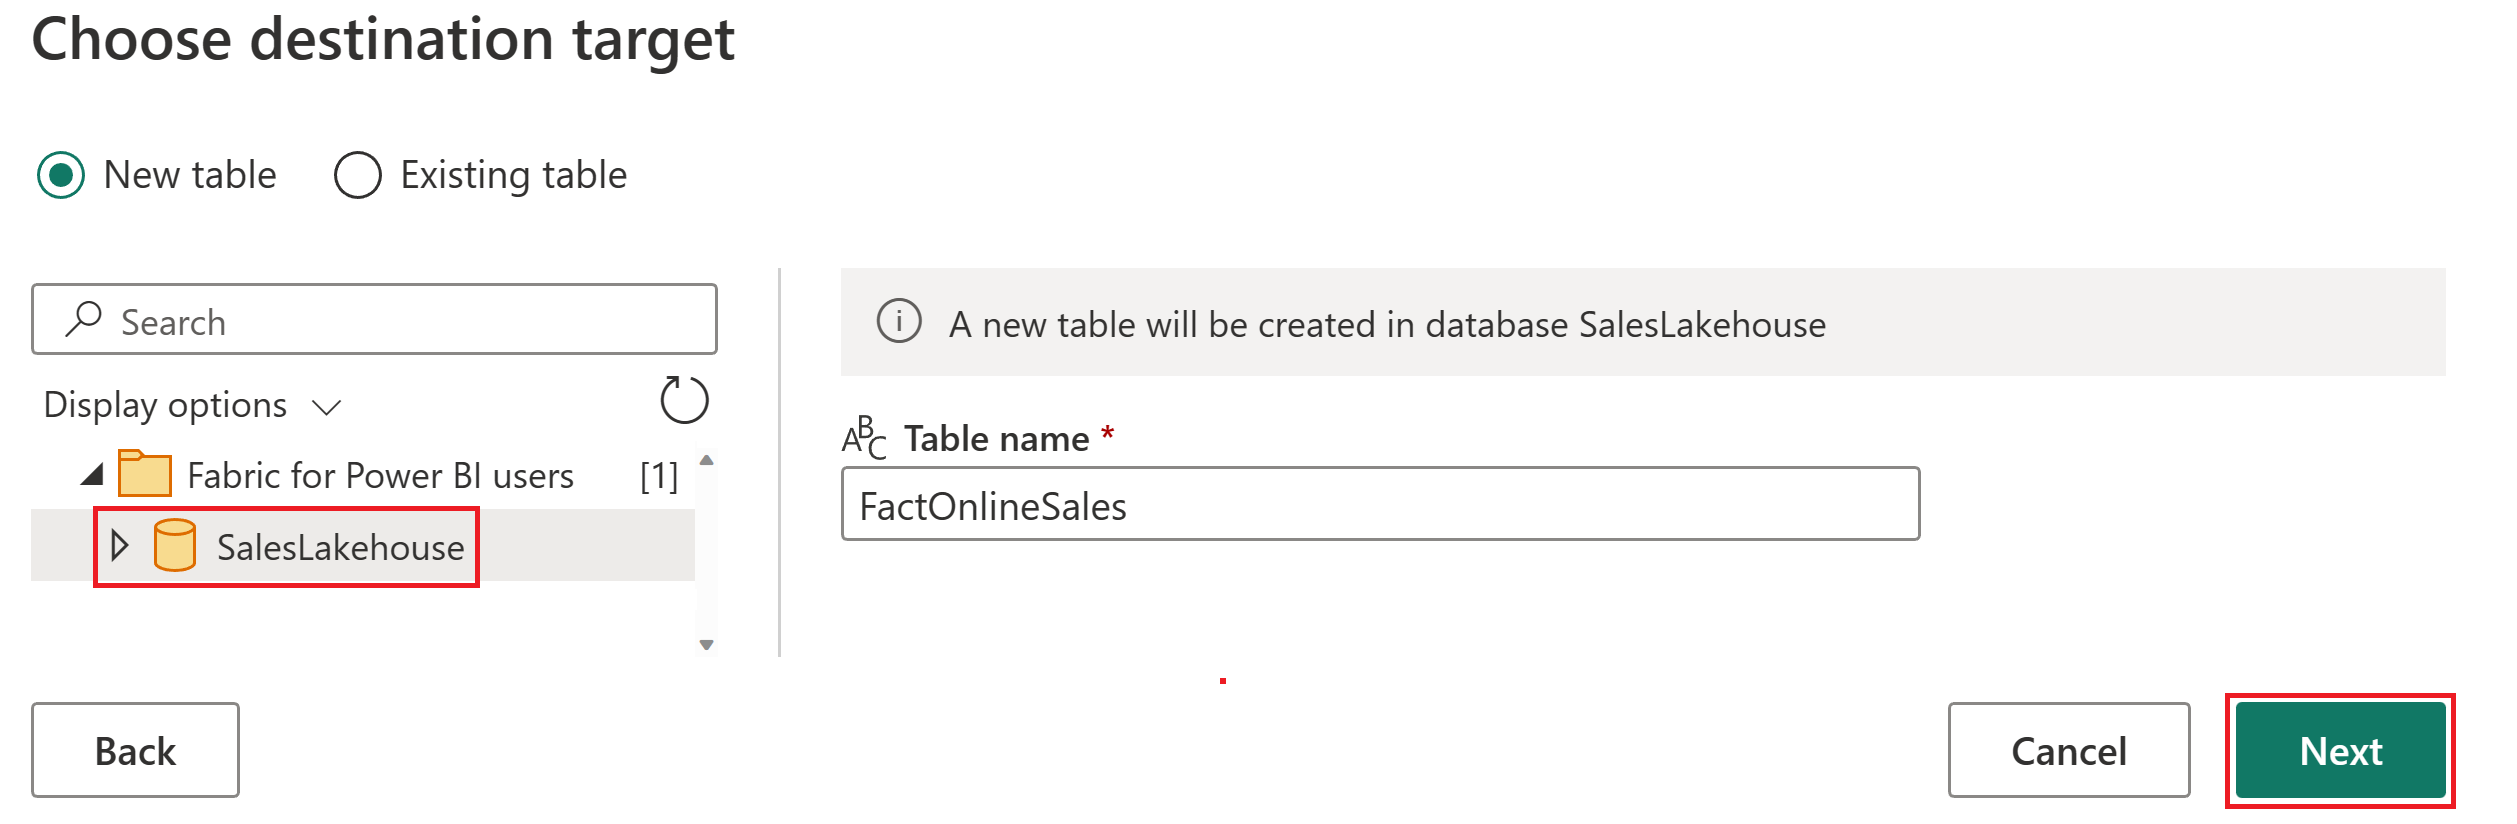
From the navigator, select the workspace used for this tutorial and expand to view all Lakehouse items. Select SalesLakehouse and confirm that the default New table is selected before selecting Next to continue.
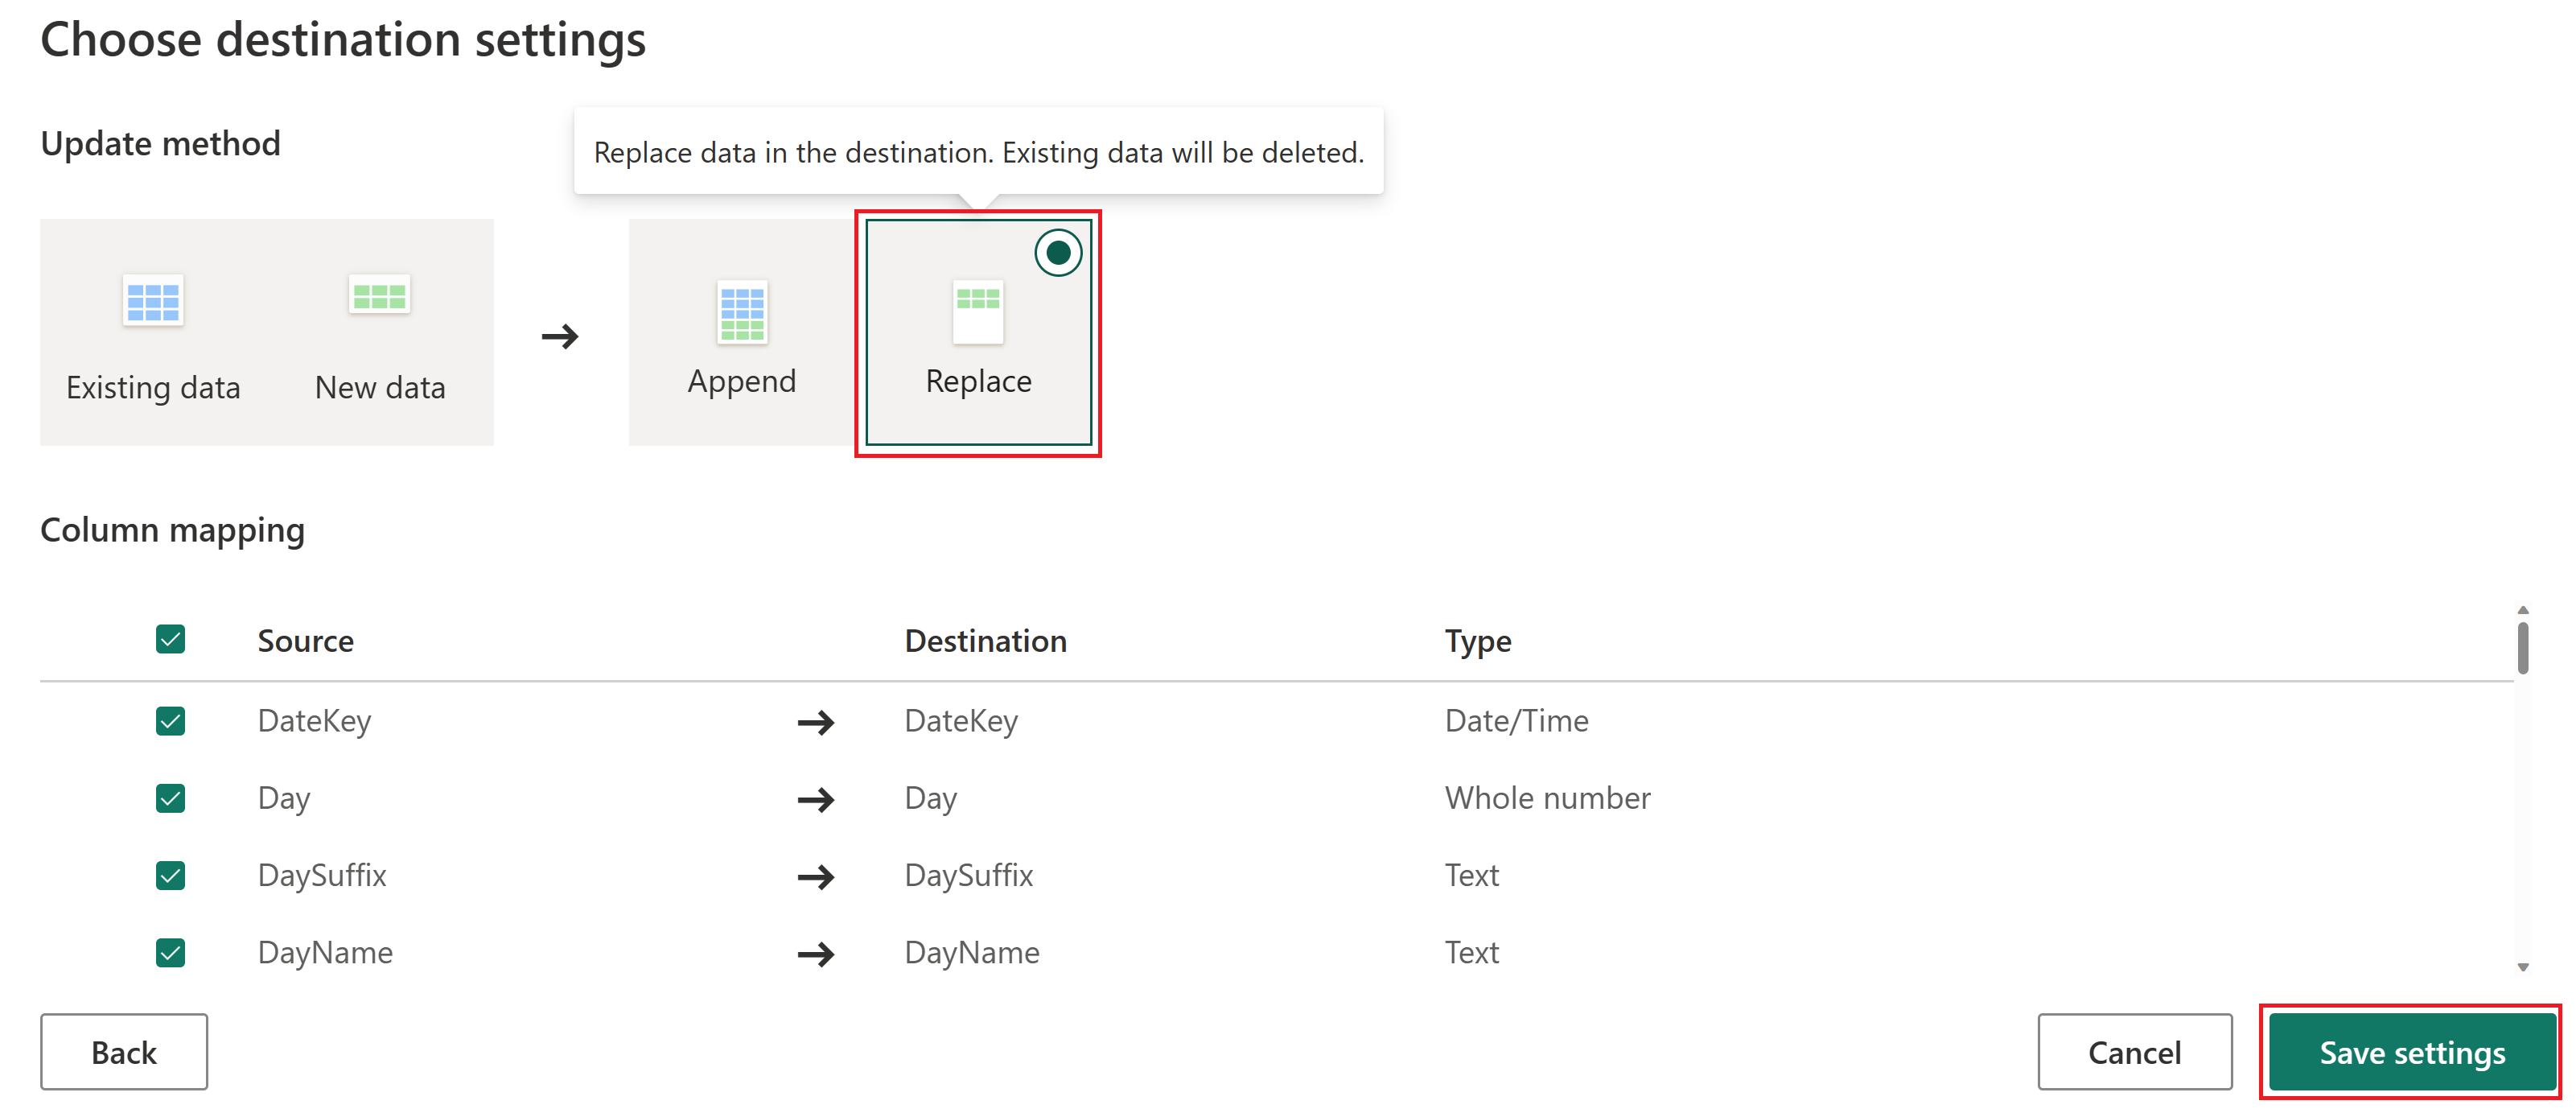
Set the Update method to Replace and then select Save settings.
Caution
Setting the update method to Replace deletes all existing data and replaces it with the new data on each subsequent refresh.
Note
In the bottom right corner of the Power Query Online editor, you can find the configured Data destination settings for your query where you can further customize or remove.
Before moving on to the next section of this tutorial, make sure to perform the same steps as you took earlier in this section to configure the Lakehouse as your data destination for each of the following queries.
Query DimCustomer DimEmployee DimProduct DimStore Select the FactOnlineSales query under the Data transformation query group and from the Home tab, select Add data destination and then select the Lakehouse option.
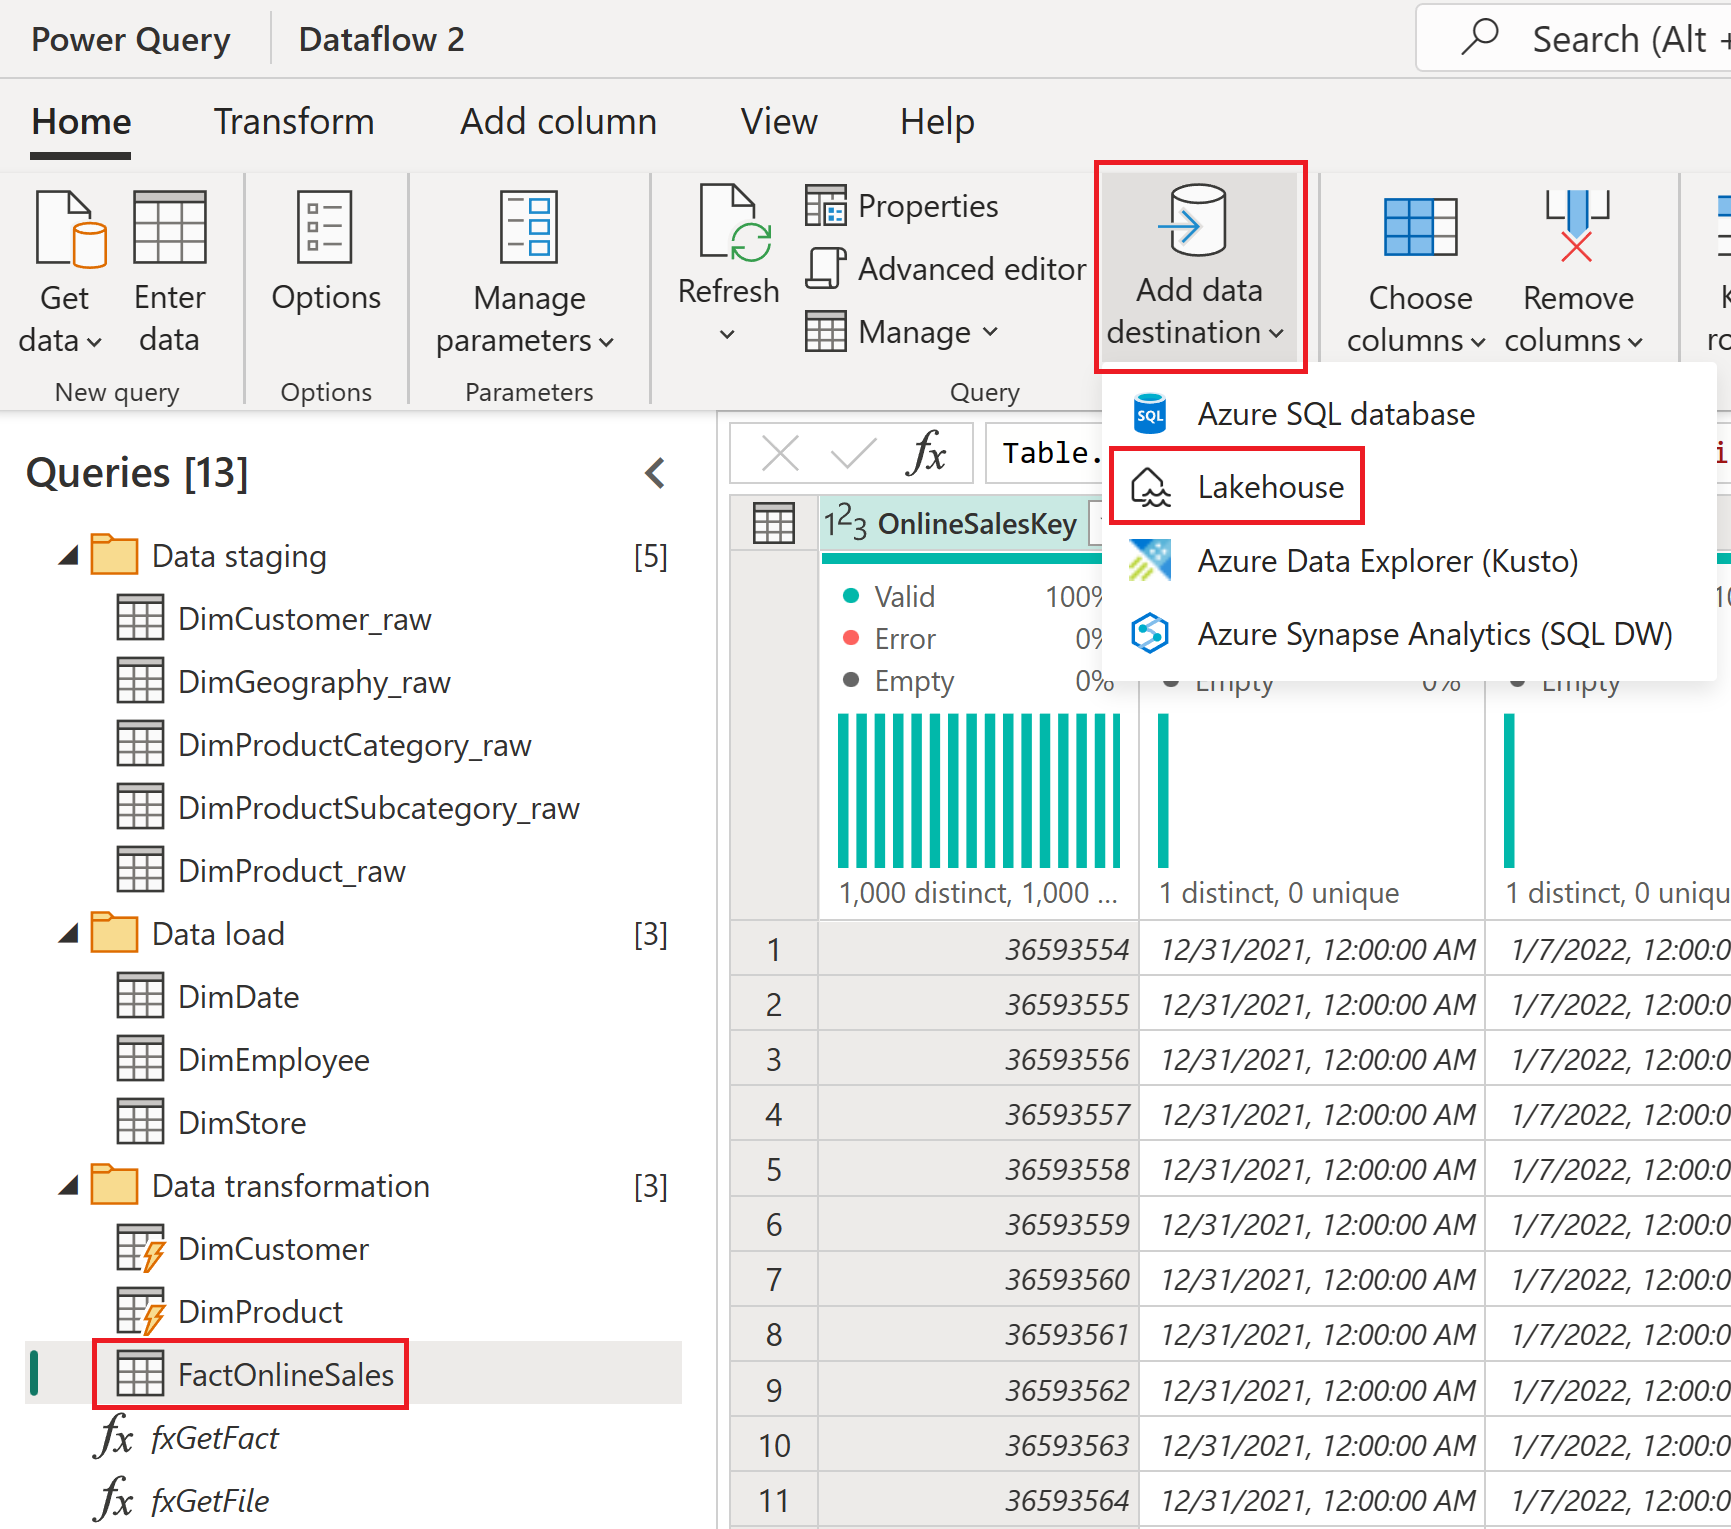
If necessary, set the authentication to Organizational account and then select Next.
From the navigator, select the workspace used for this tutorial and expand to view all Lakehouse items. Select SalesLakehouse and confirm that the default New table is selected before selecting Next to continue.
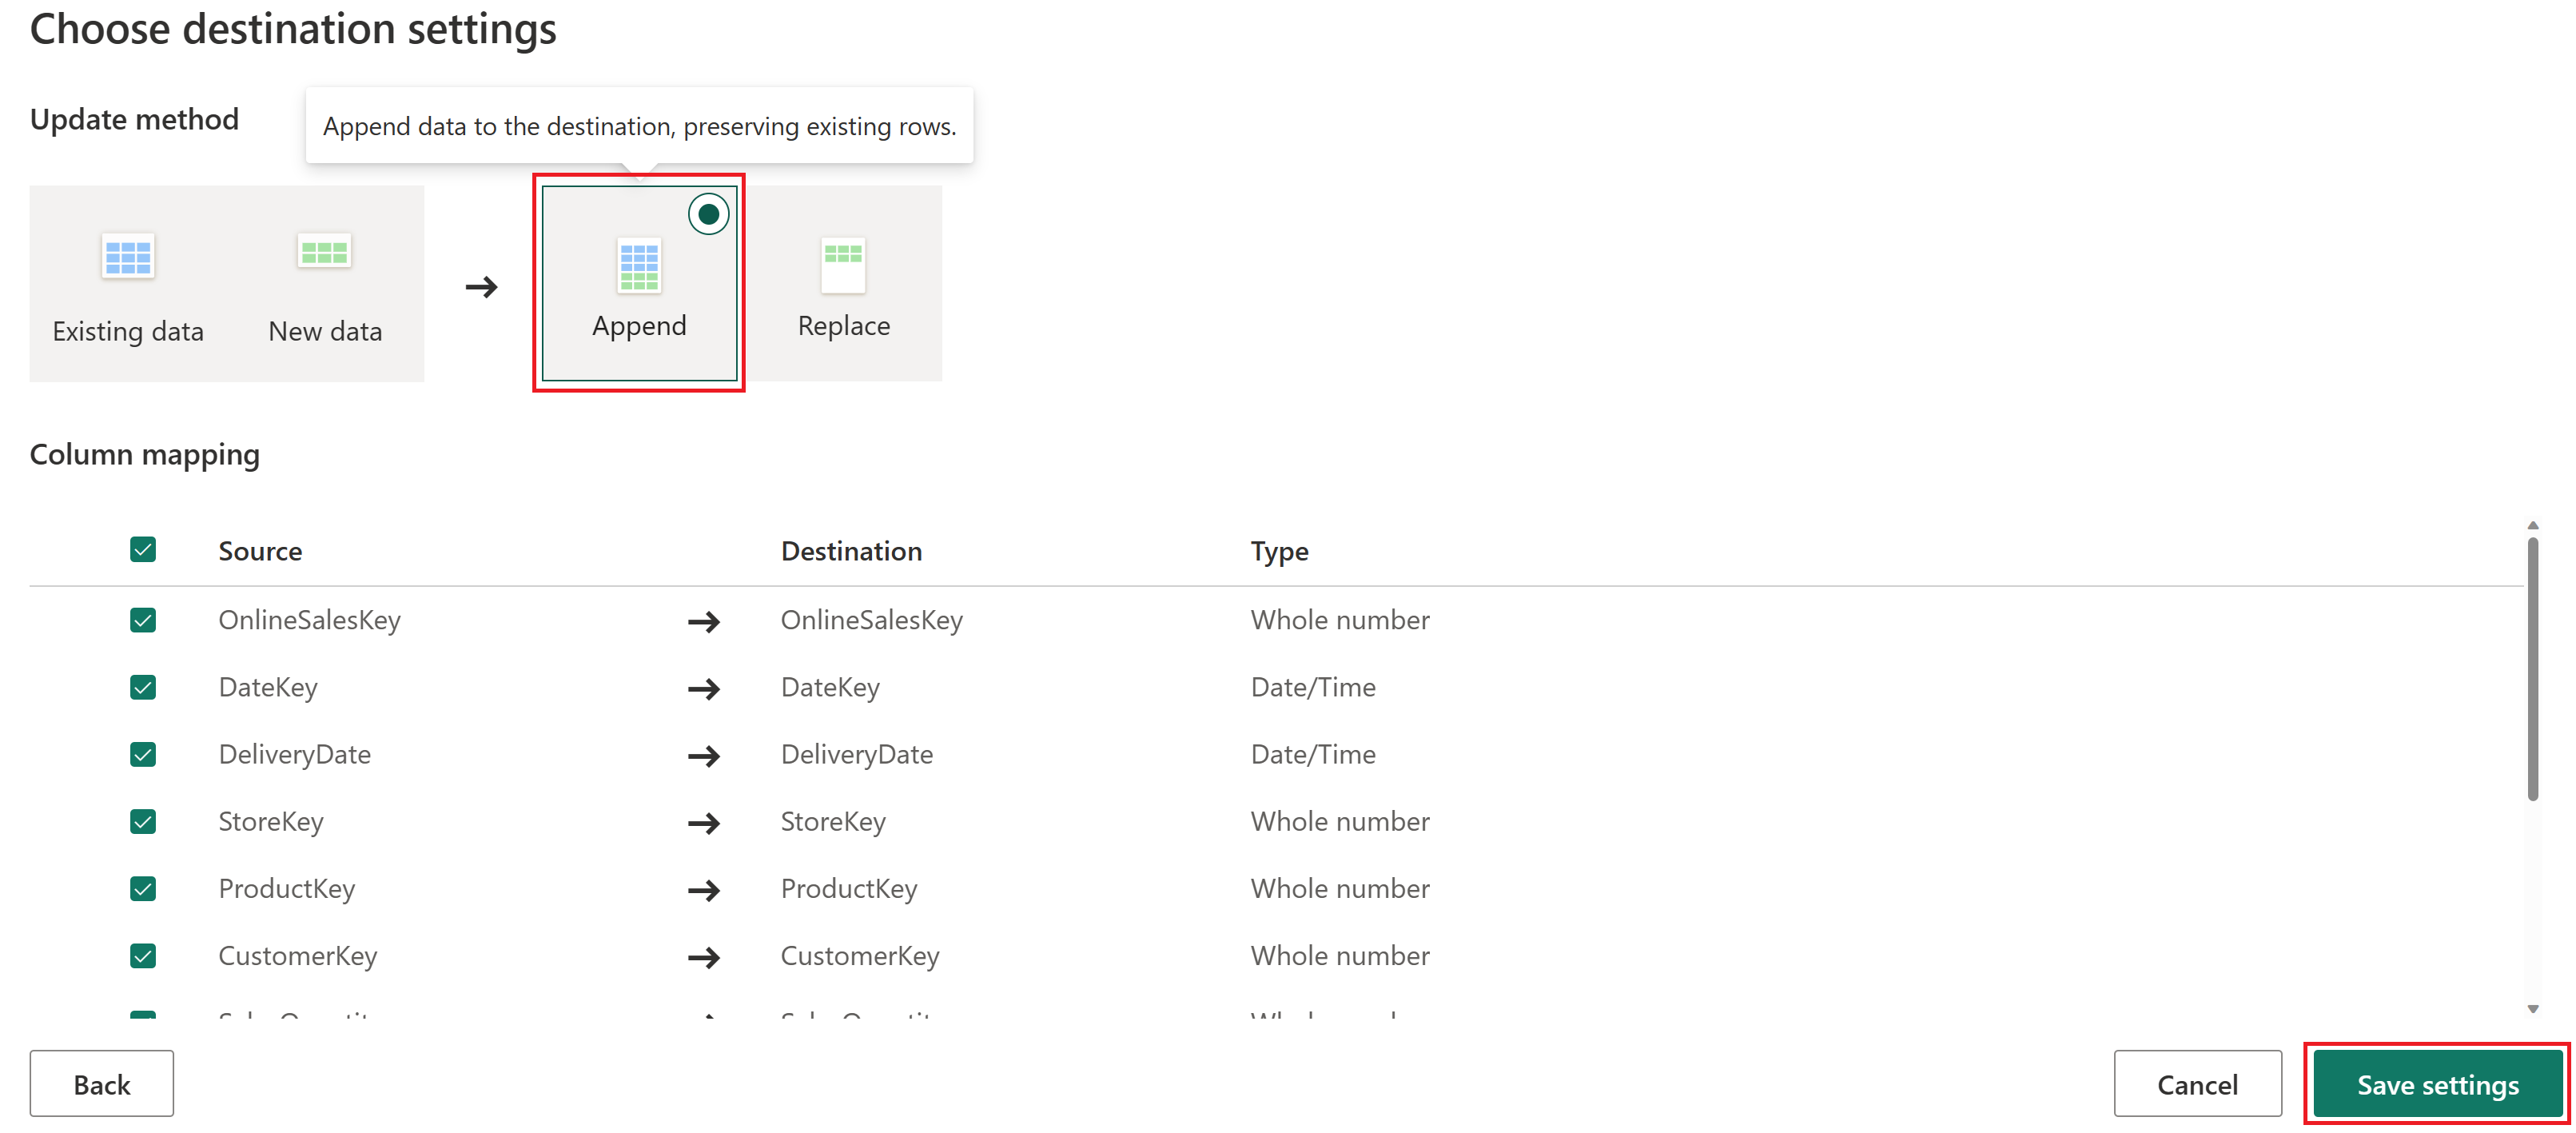
Set the Update method to Append and then select Save settings.
Note
This process inserts data, preserving the existing rows within the table on each subsequent refresh.
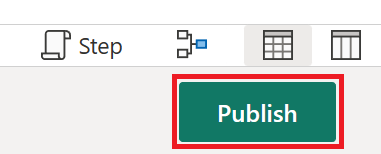
Select Publish to save your dataflow and exit the Power Query Online editor.
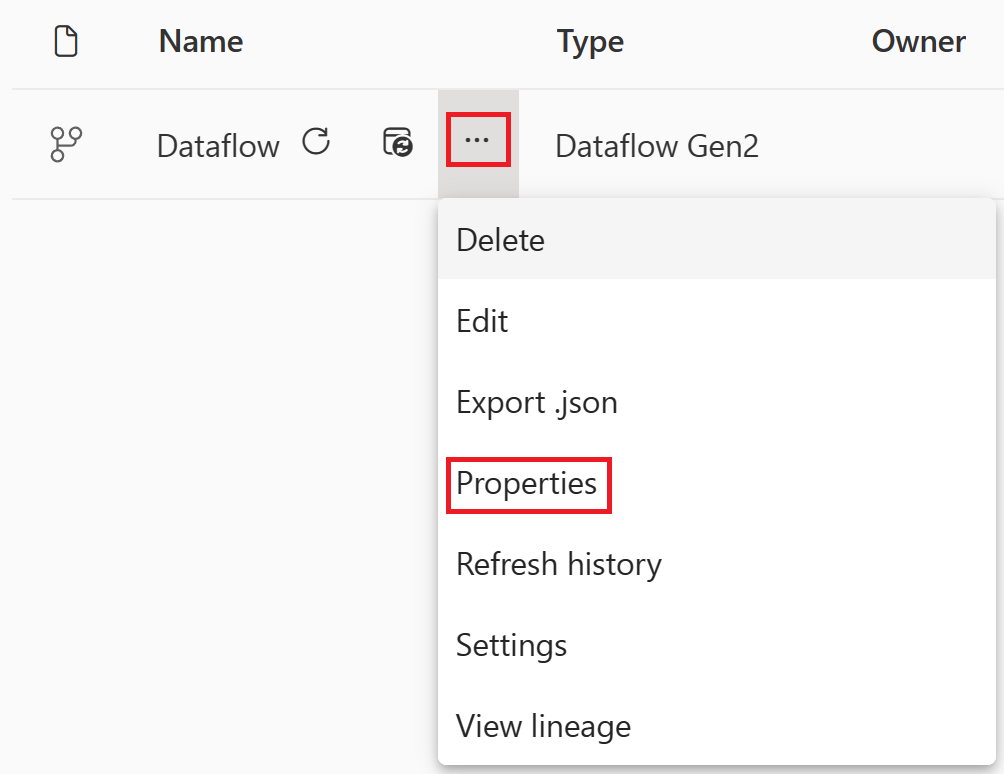
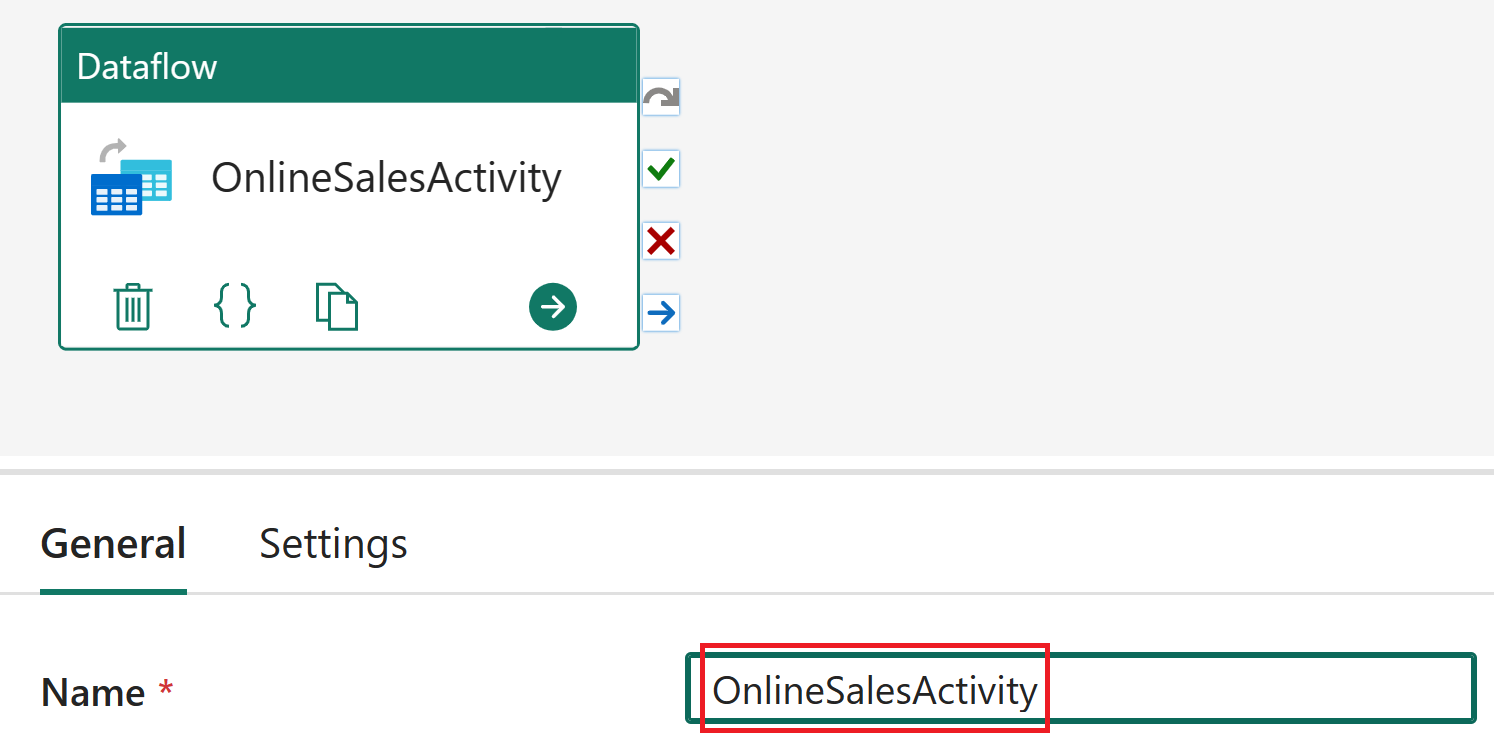
Hover above the created dataflow in your workspace, select the ellipses (...) and the Properties option.
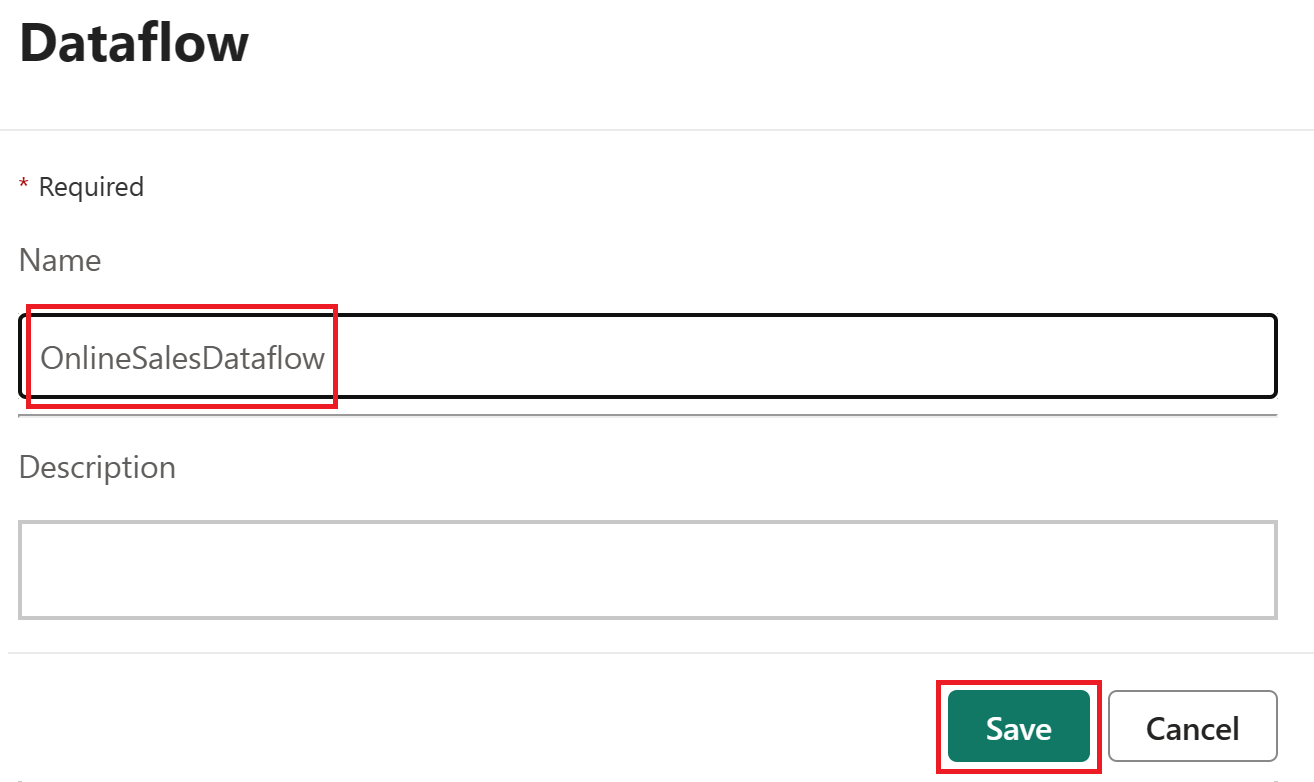
Change the name of the dataflow to OnlineSalesDataflow and select Save.
Orchestrate a data pipeline
Using pipelines, we first orchestrate the refresh of our data flow. If an error occurs, we send a customized Outlook email that includes important details.
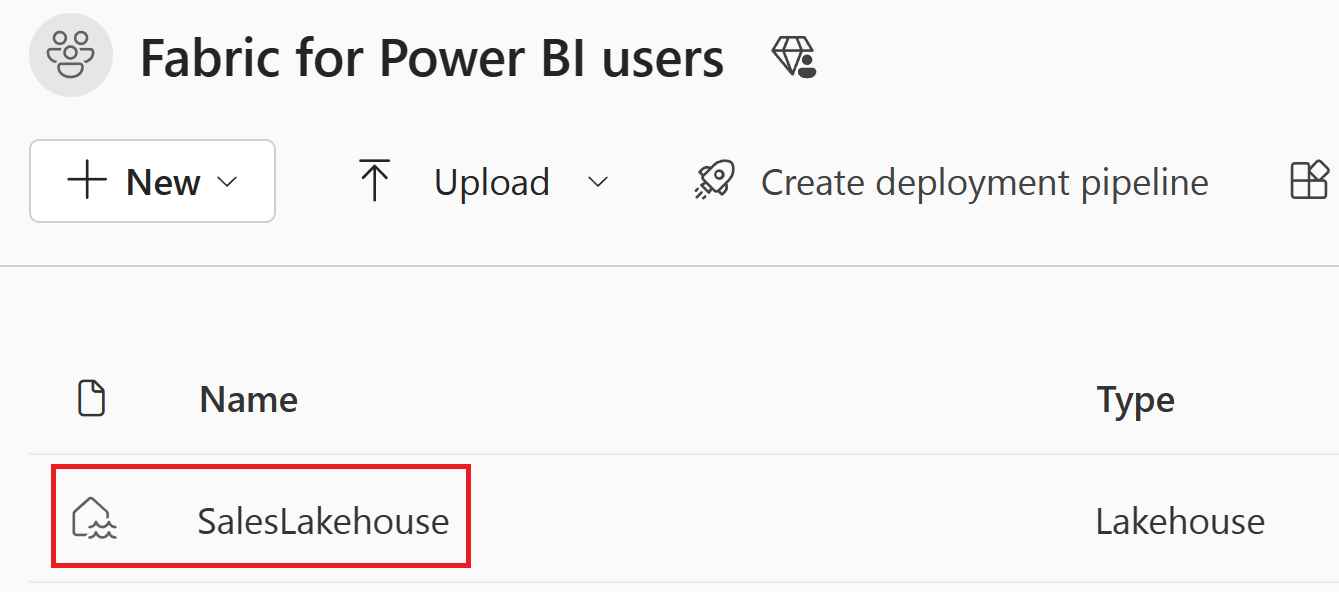
Select the Lakehouse item named SalesLakehouse within your workspace.
Once you're in the Lakehouse editor, select New data pipeline.
Note
You can also select Get data from the ribbon and then New data pipeline.
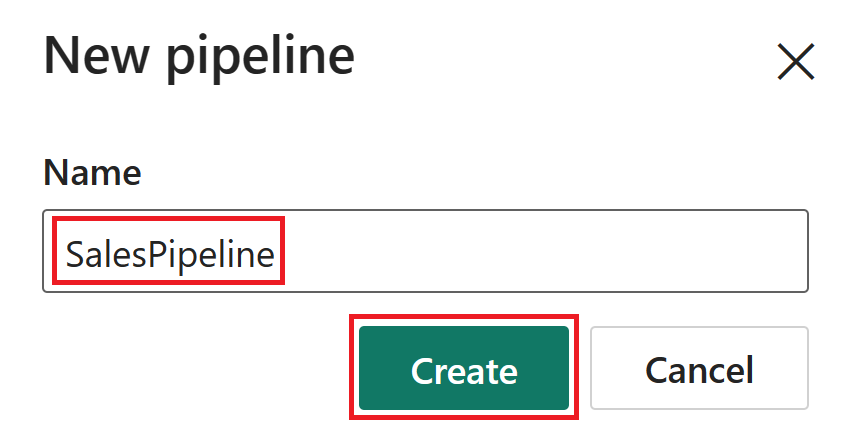
Set the pipeline name to SalesPipeline. Then select Create.
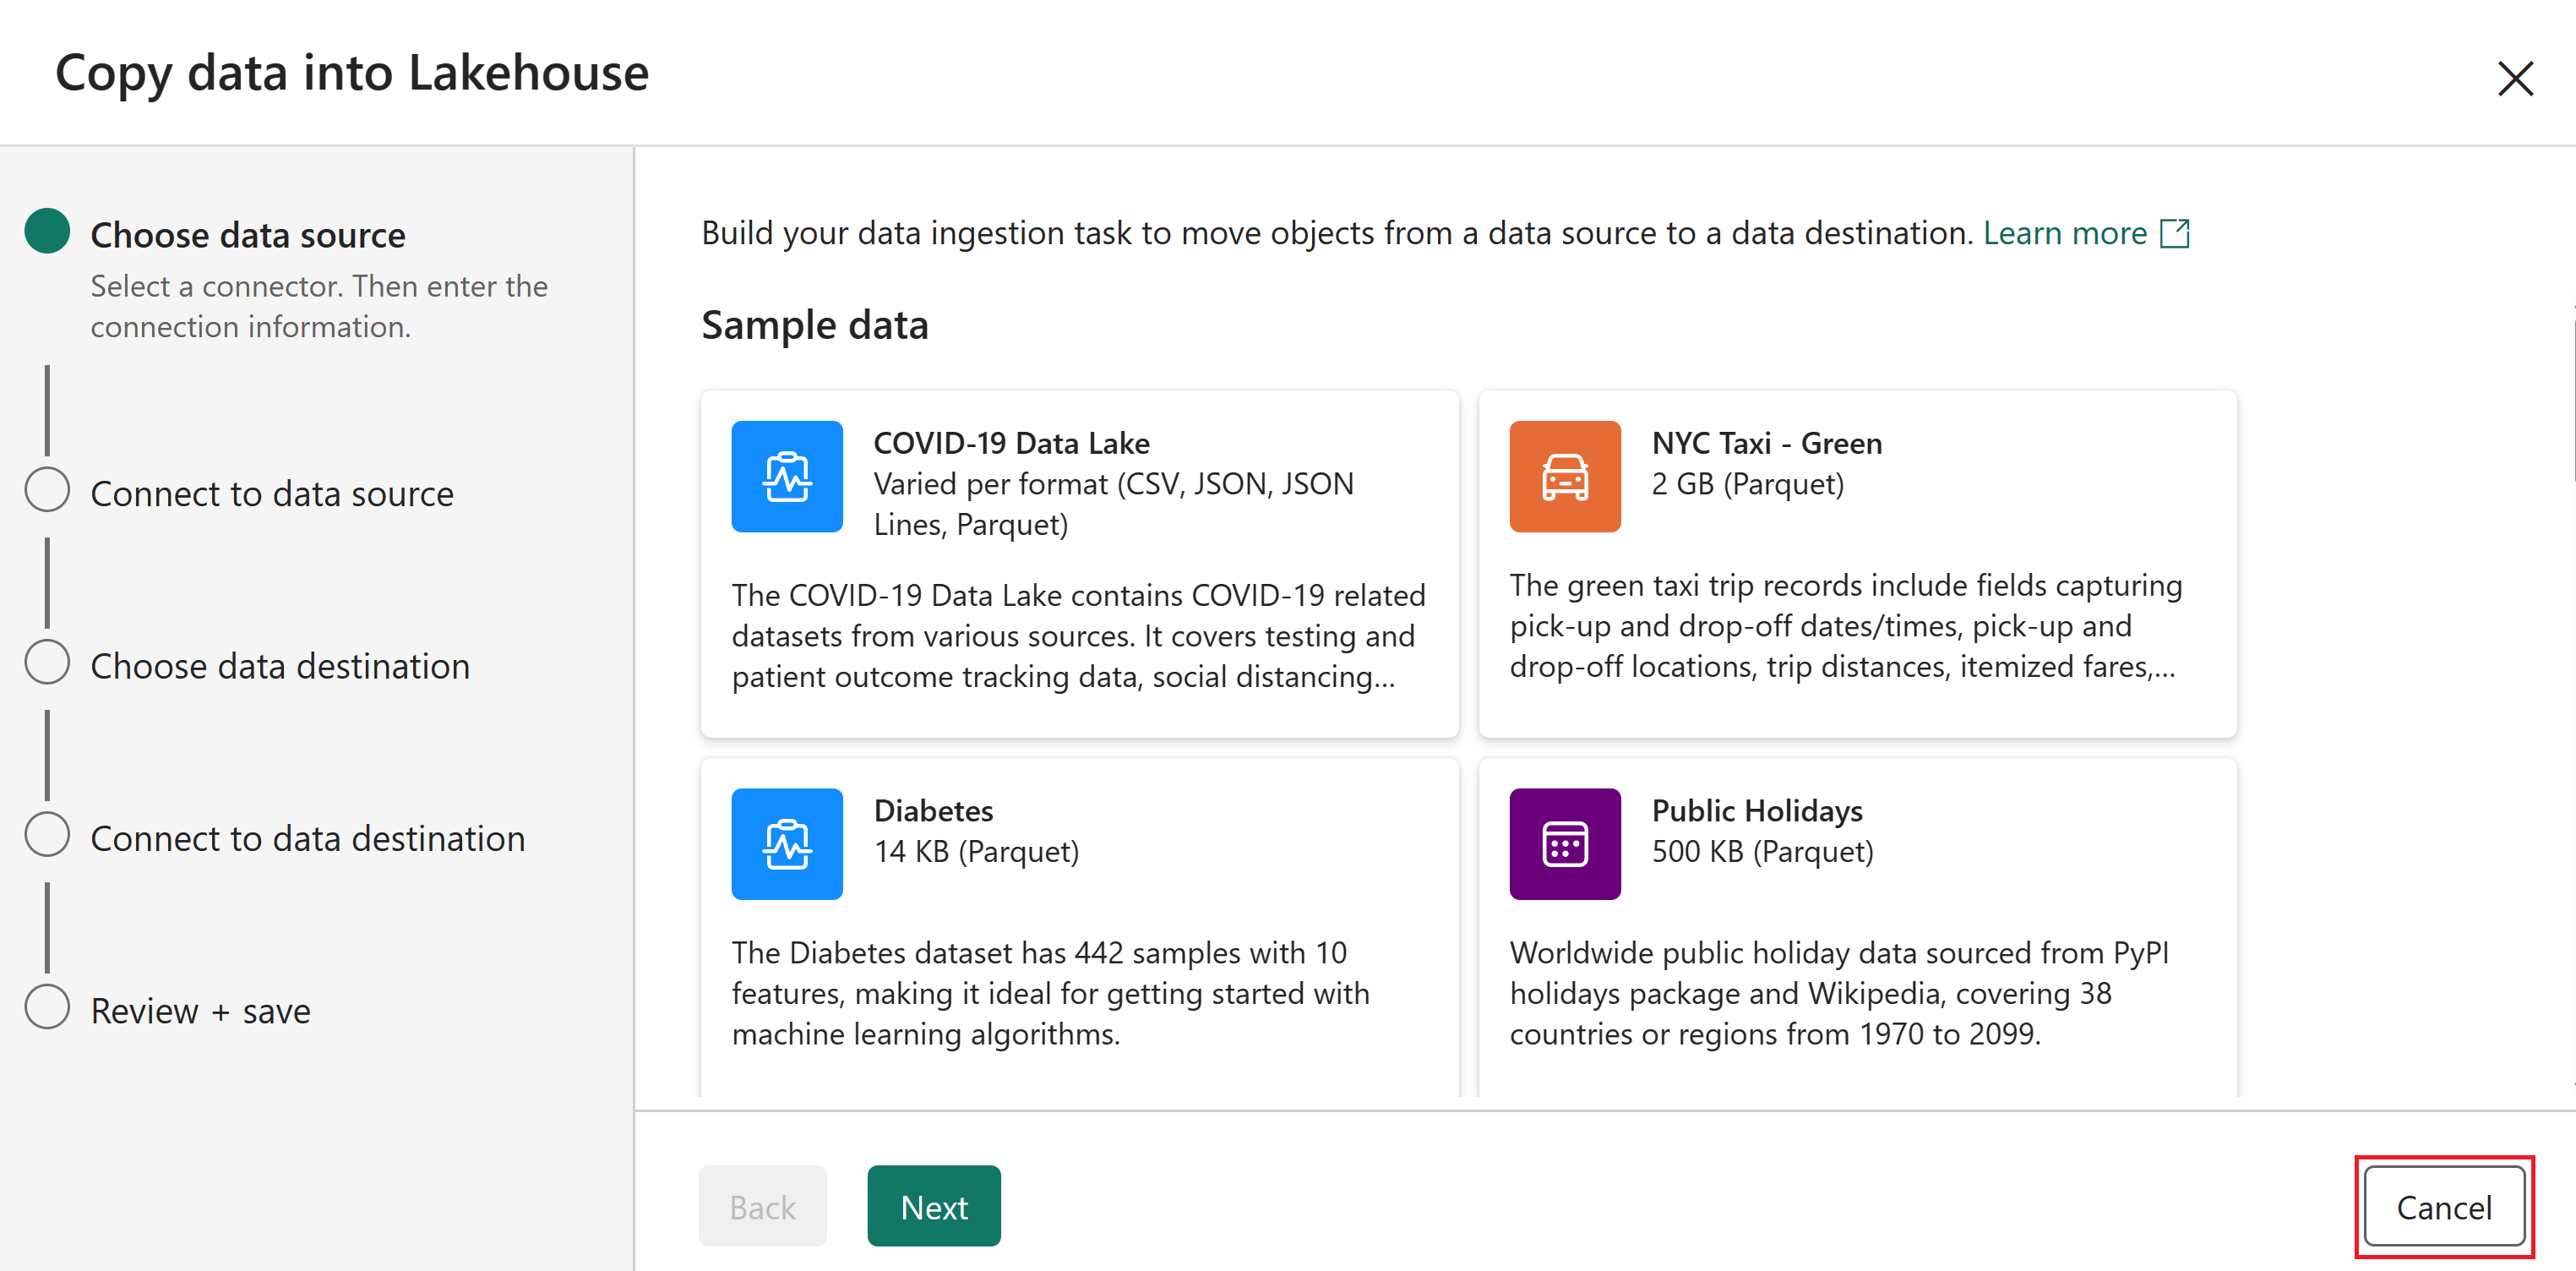
Close the Copy data assistant by selecting Cancel. If you’re prompted to confirm exiting the copy data window, select Yes, cancel.
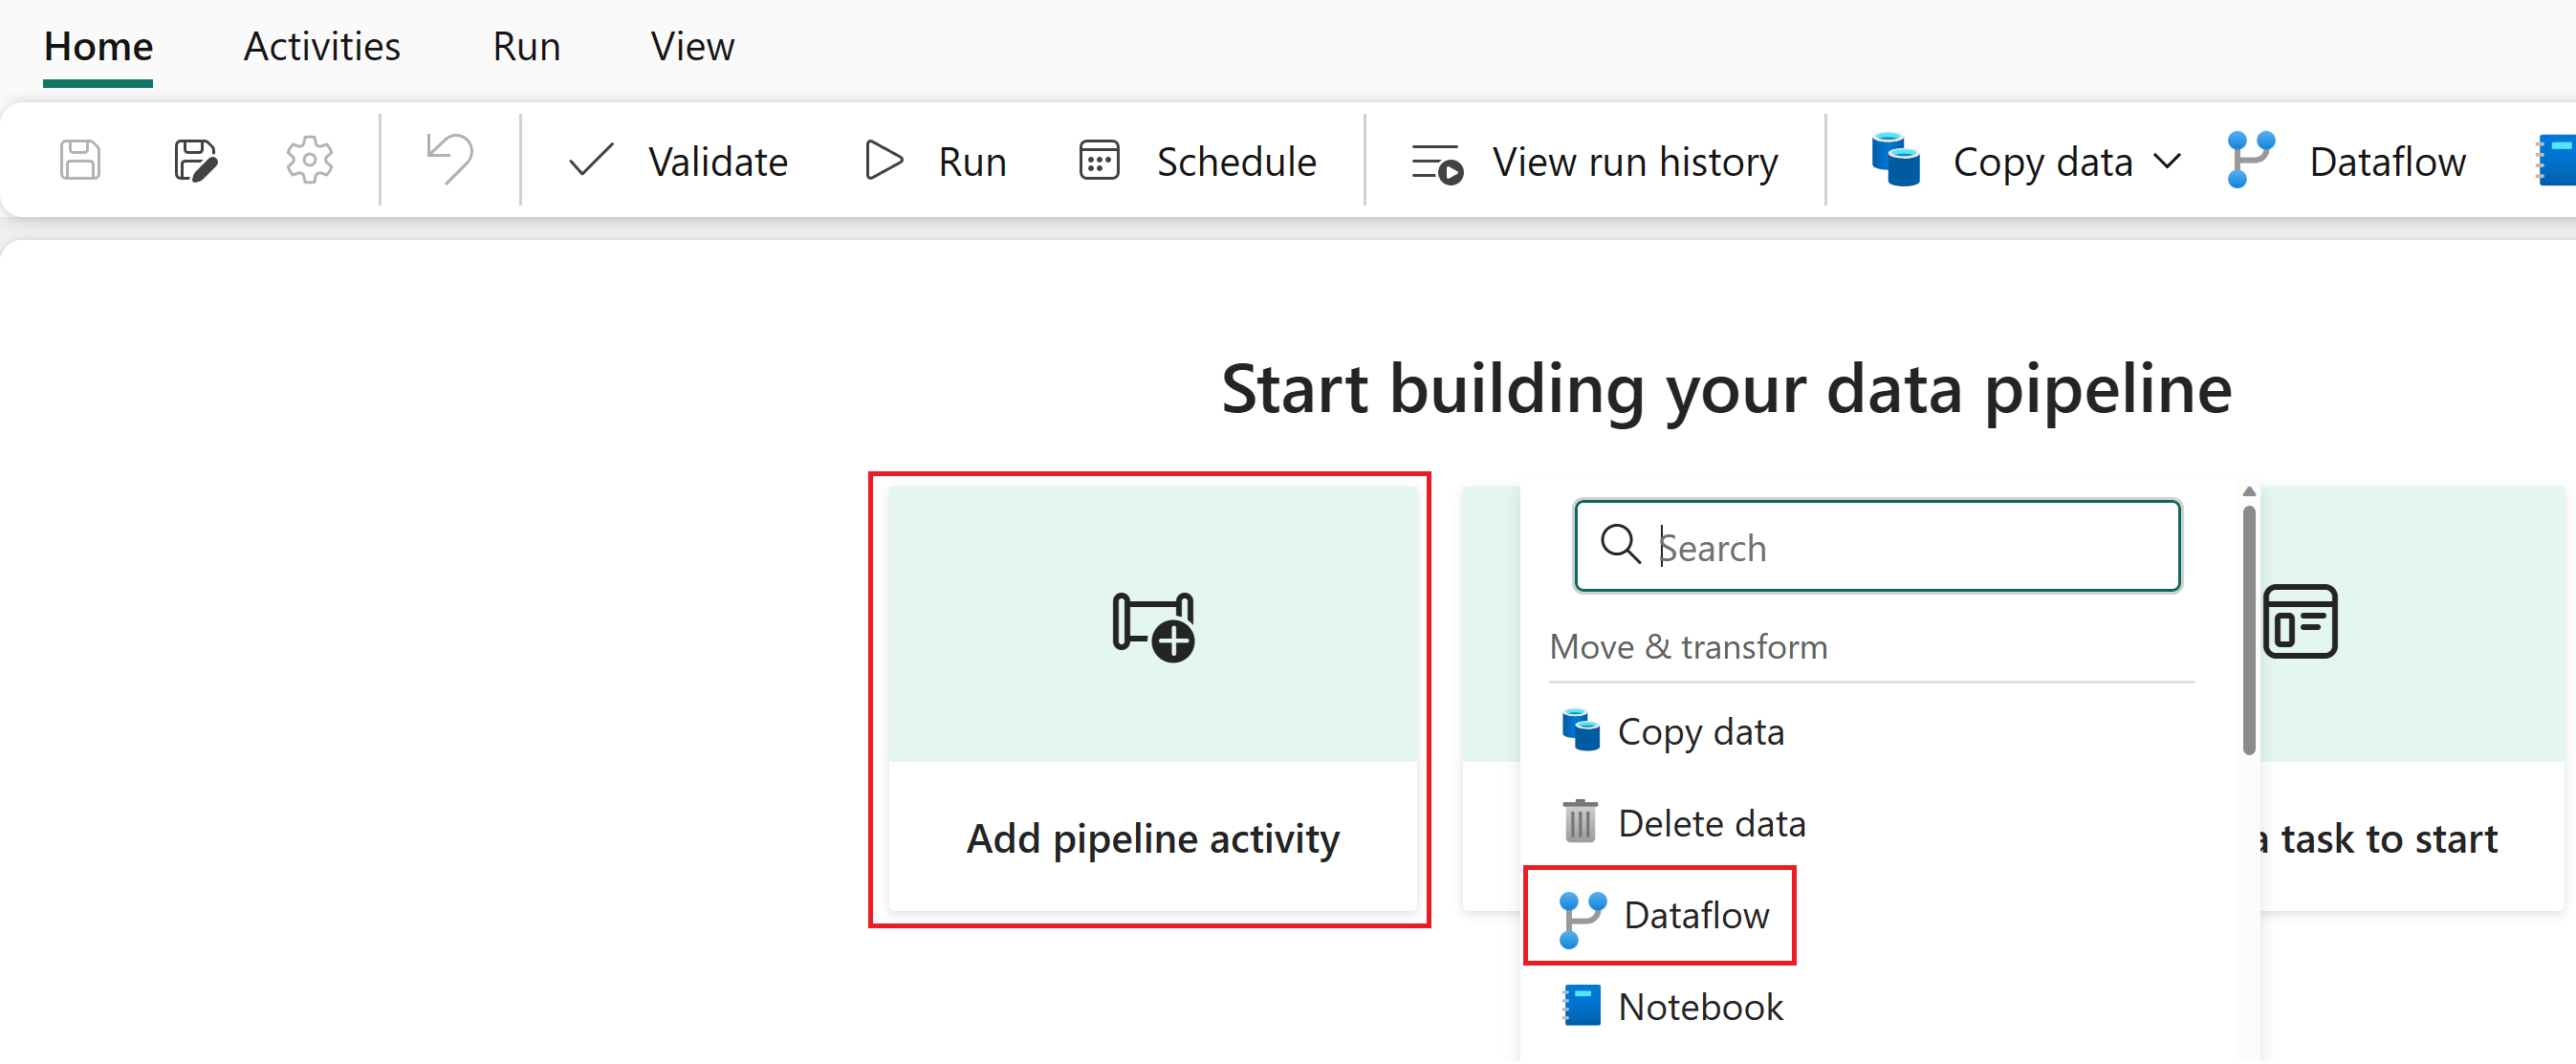
Once you’re in the pipeline editor, select Add pipeline activity, and then select Dataflow.
Note
You can also select Dataflow from the ribbon.
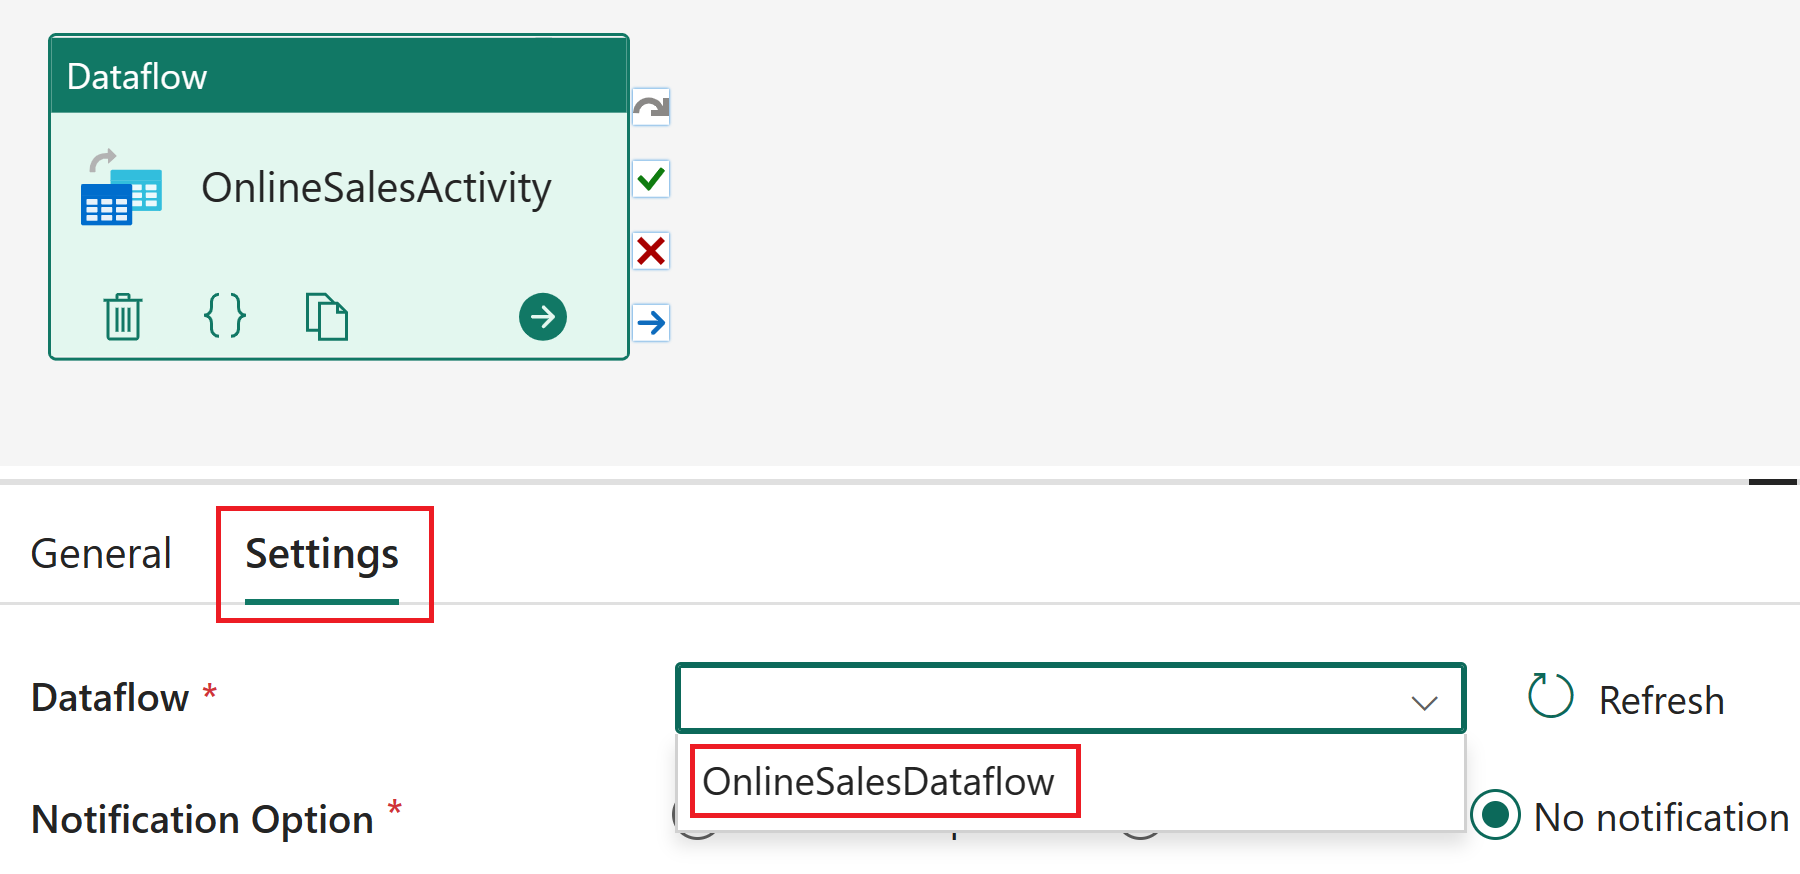
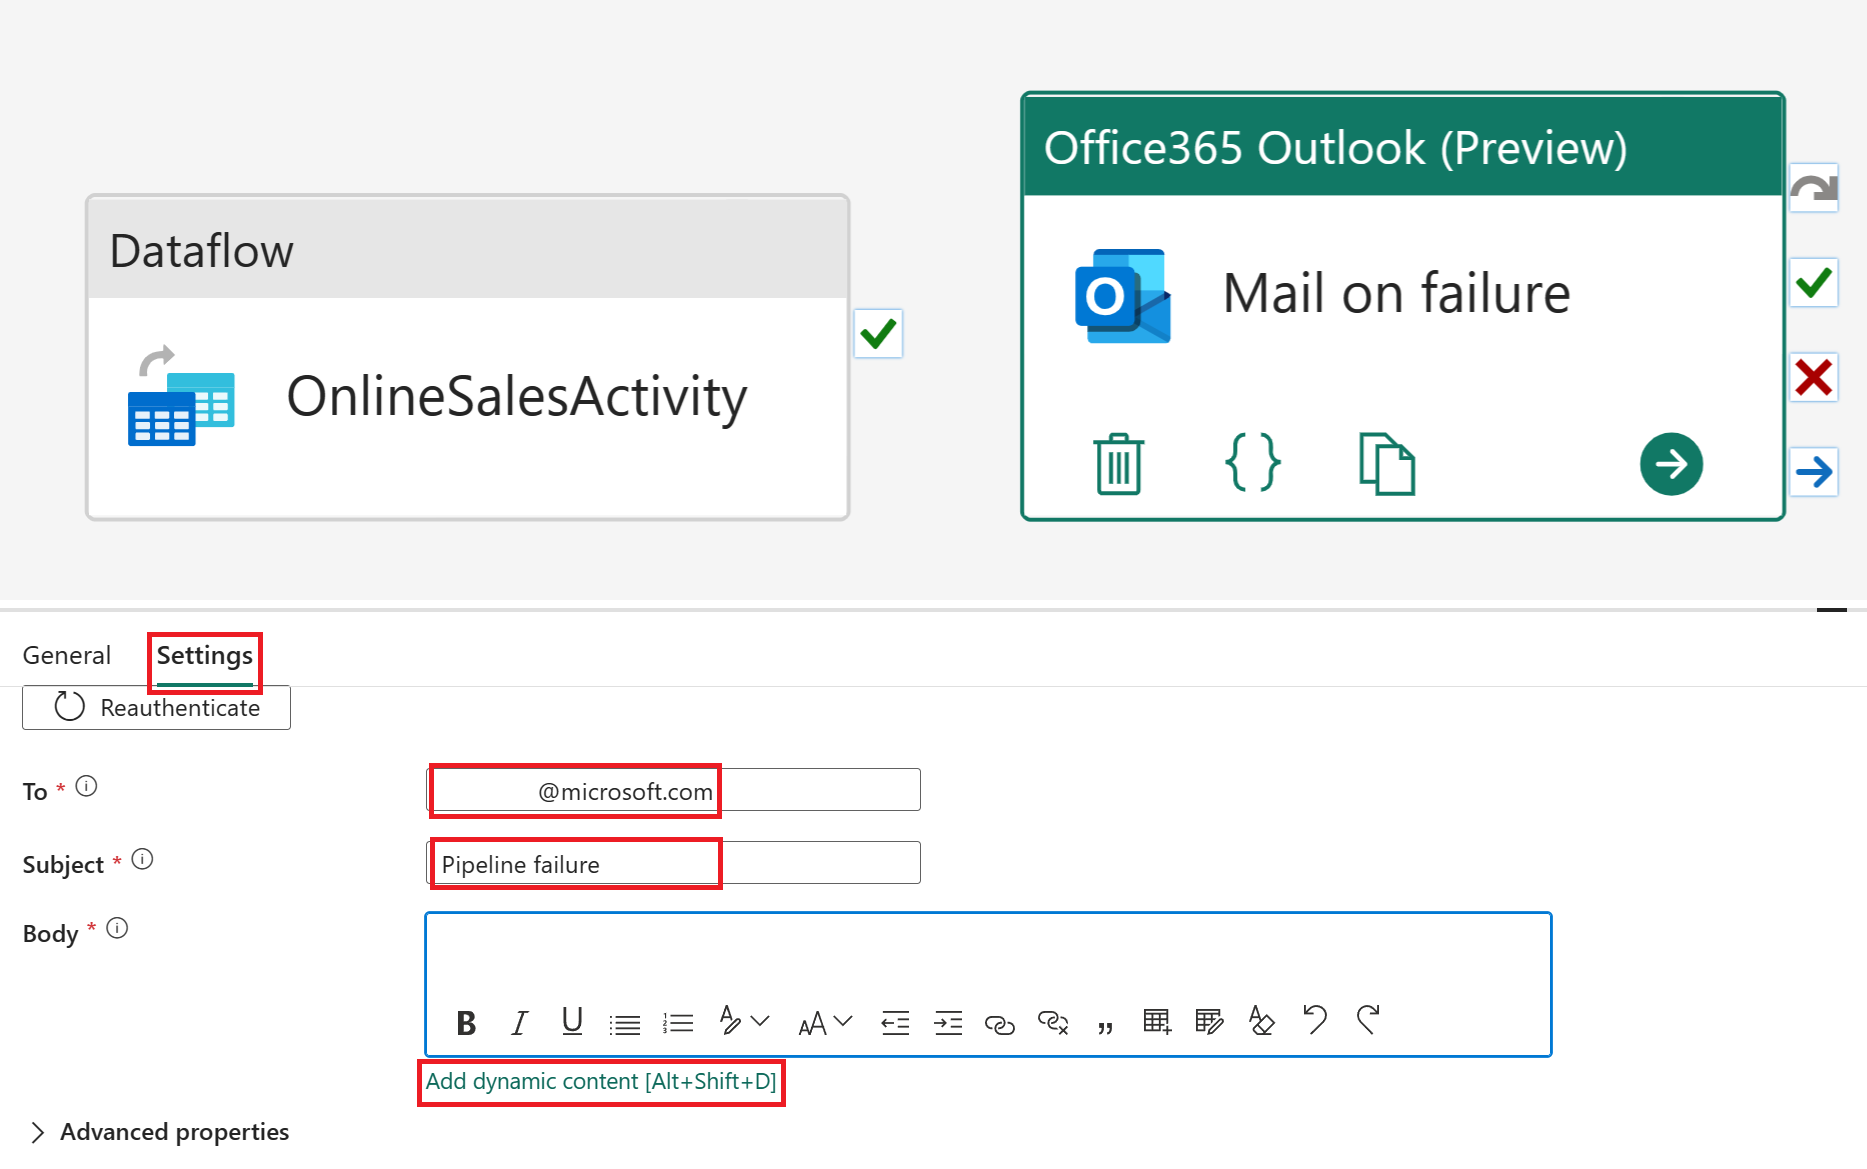
Select the dataflow activity within the pipeline editor and change its Name value to OnlineSalesActivity within the General section.
With the dataflow activity still selected, select Settings and choose OnlineSalesDataflow from the Dataflow list. If necessary to update the list, select the Refresh icon.
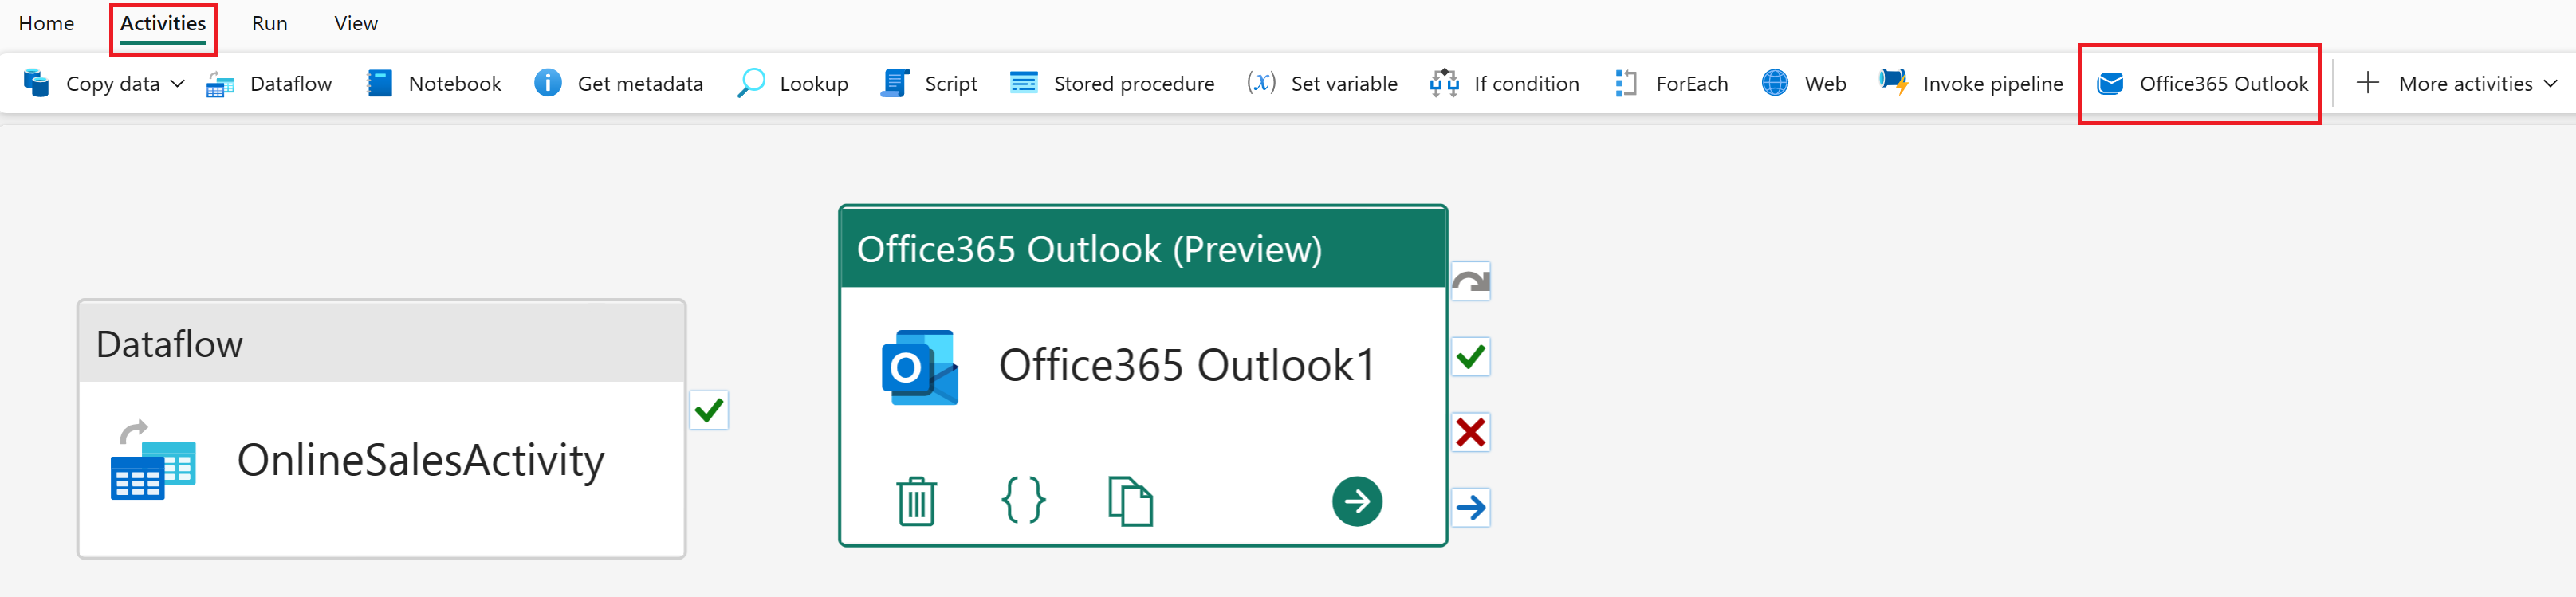
Select the Activities tab and then the Office365 Outlook activity.
Note
If a Grant consent window appears, select Ok, sign in with your organizational account and then select Allow access.
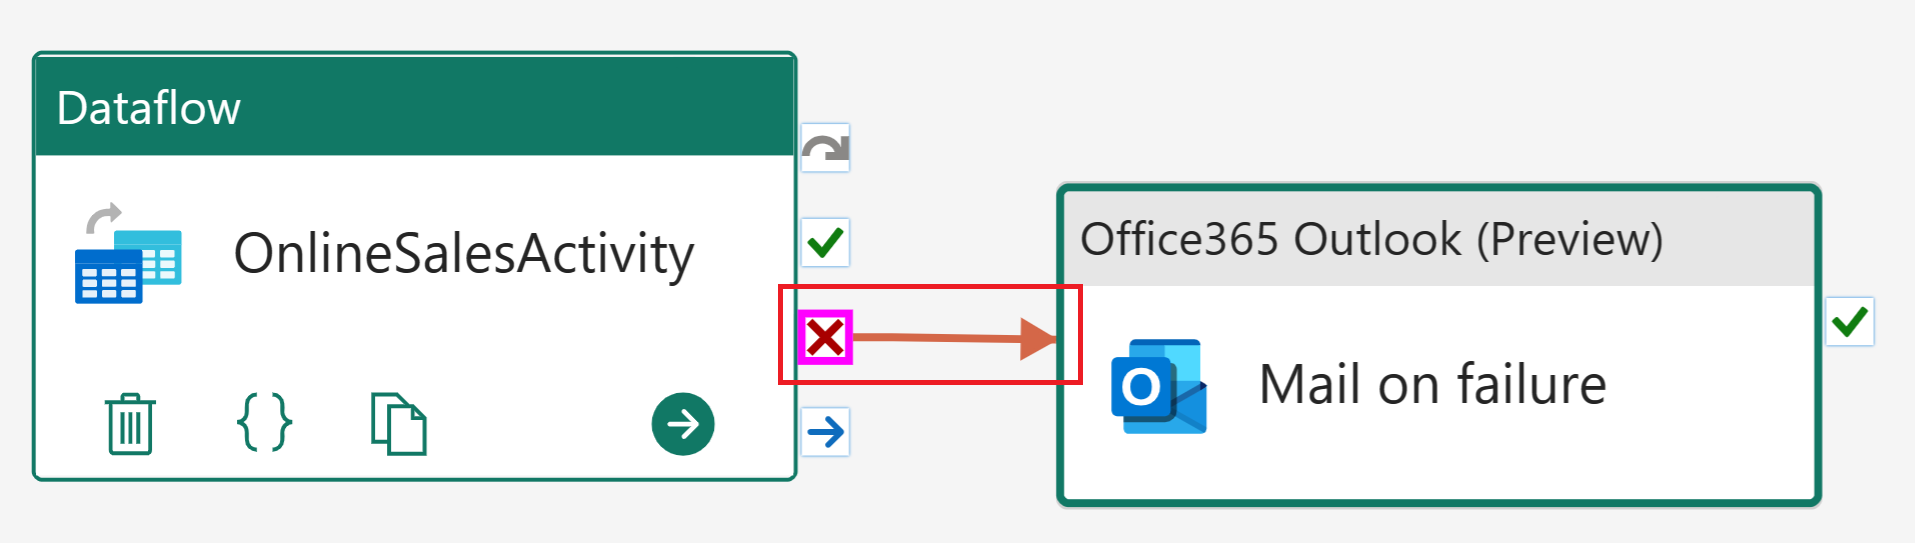
Select the Office365 Outlook activity within the pipeline editor and change its Name value to Mail on failure within the General section.
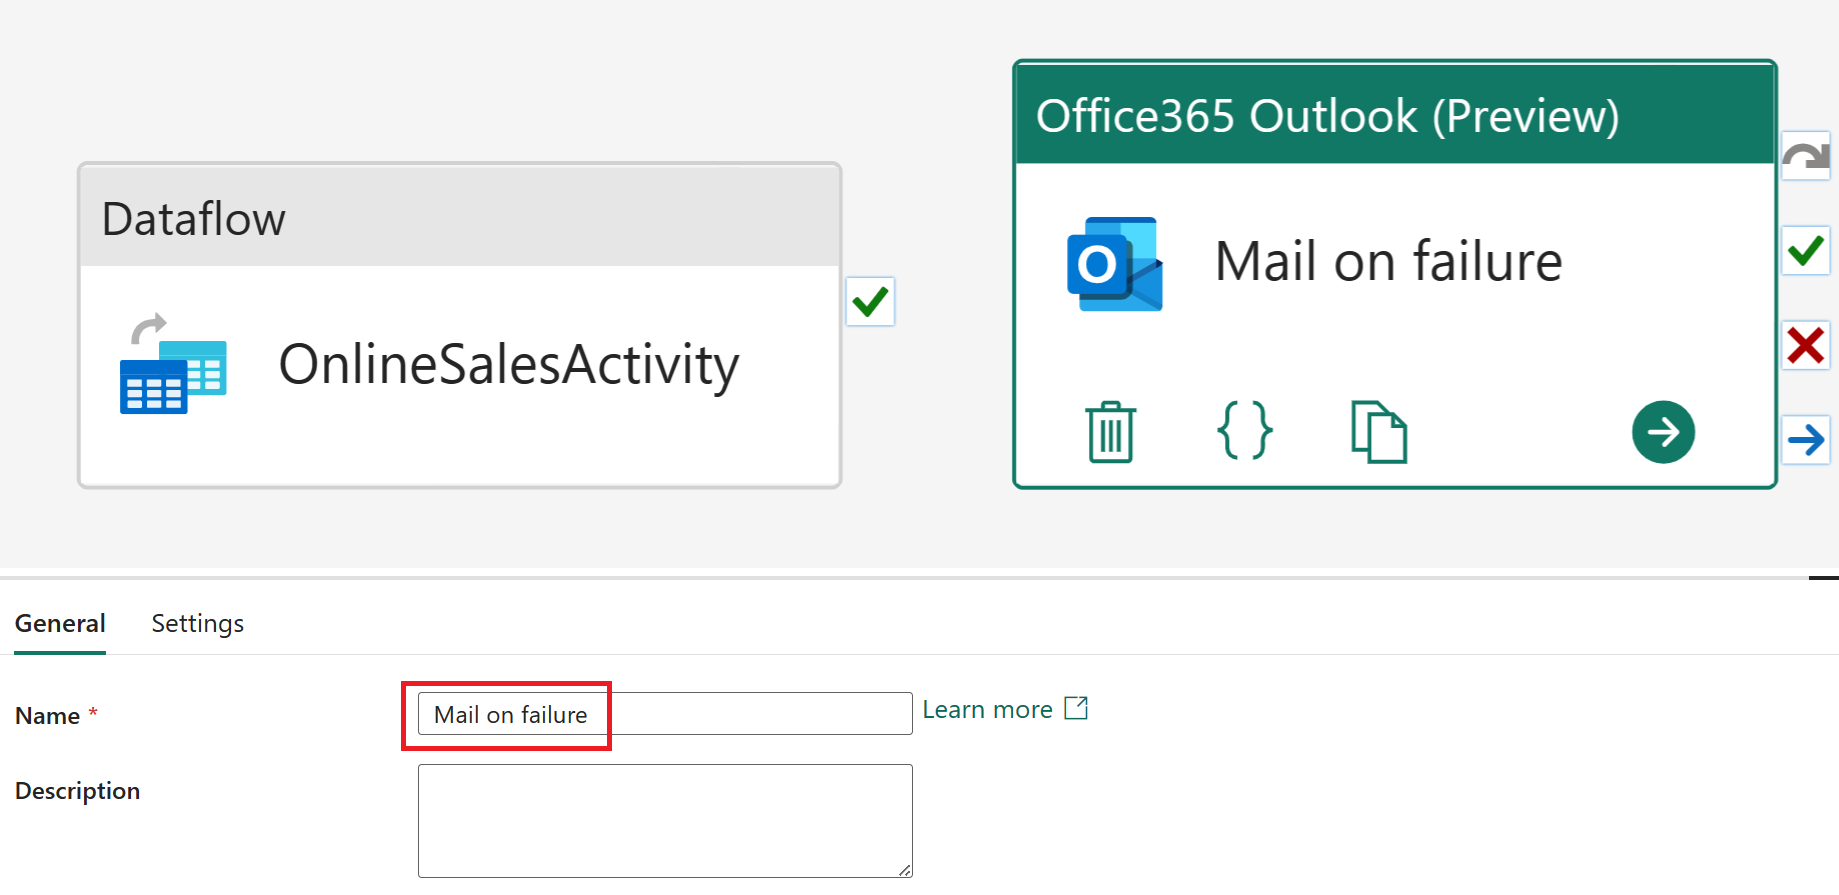
With the Office365 Outlook activity still selected, select Settings. Update the To field to your e-mail address and the Subject to Pipeline failure. Select the Add dynamic content [Alt+Shift+D] for the mail Body.
Note
More e-mail configuration options such as From (Send as), Cc, Bcc, Sensitivity label and more are available from Advanced properties.
In the Pipeline expression builder, paste the following expression code block:
@concat(
    'Pipeline: '
    ,
    , '<br>'
    , 'Workspace: '
    ,
    , '<br>'
    , 'Time: '
    ,
)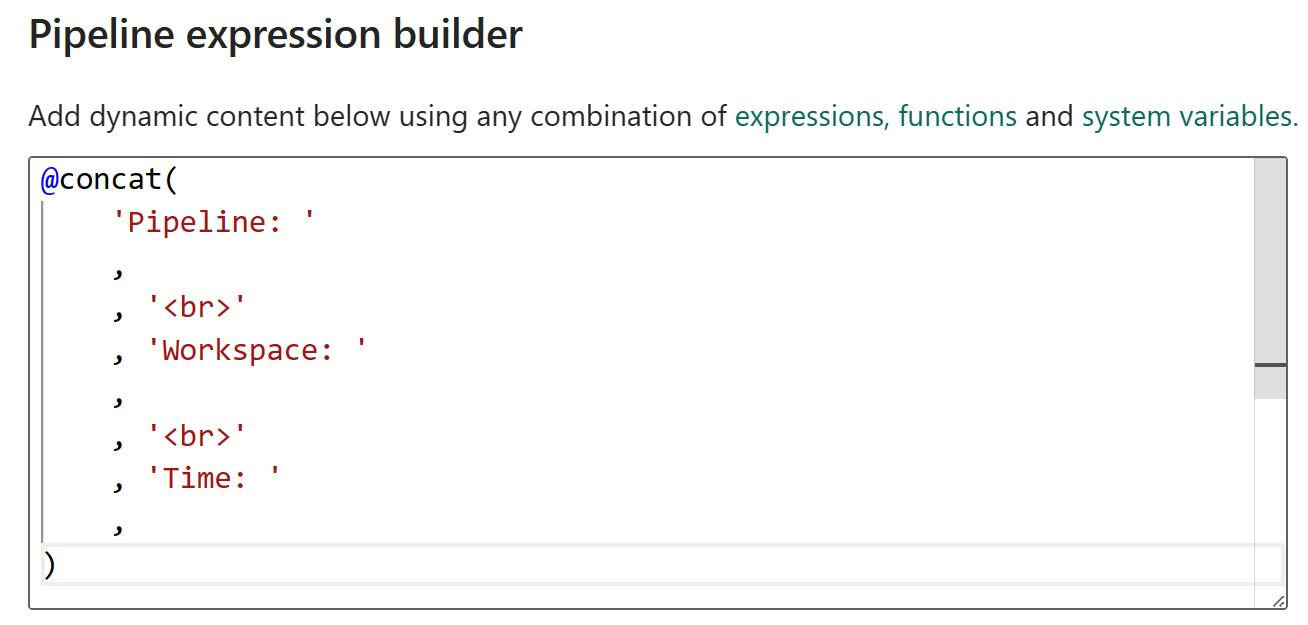
Select System variables and insert the following variables by selecting the corresponding name from the following table.
Value name Line System variable Pipeline: 3 Pipeline ID Workspace: 6 Workspace ID 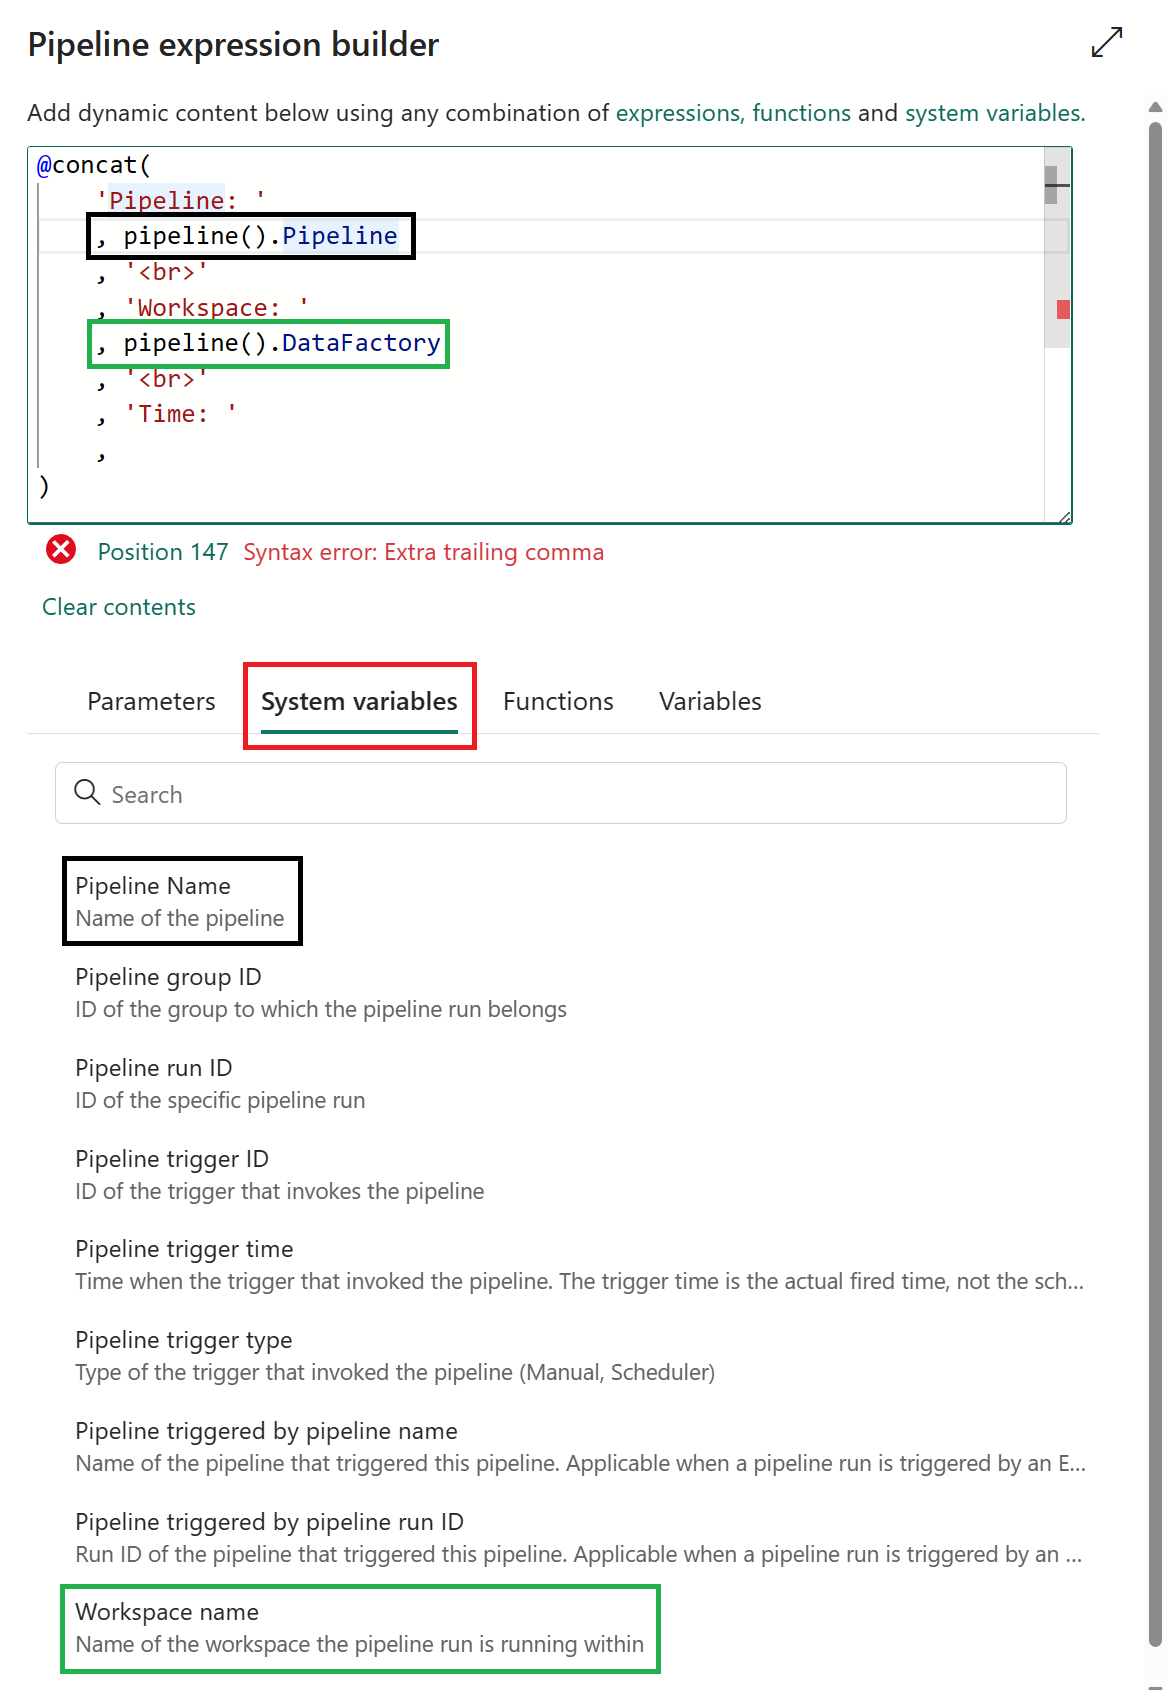
Select Functions and insert the following function by selecting the corresponding name from the following table. Once complete select OK.
Value name Line System variable Time: 9 utcnow 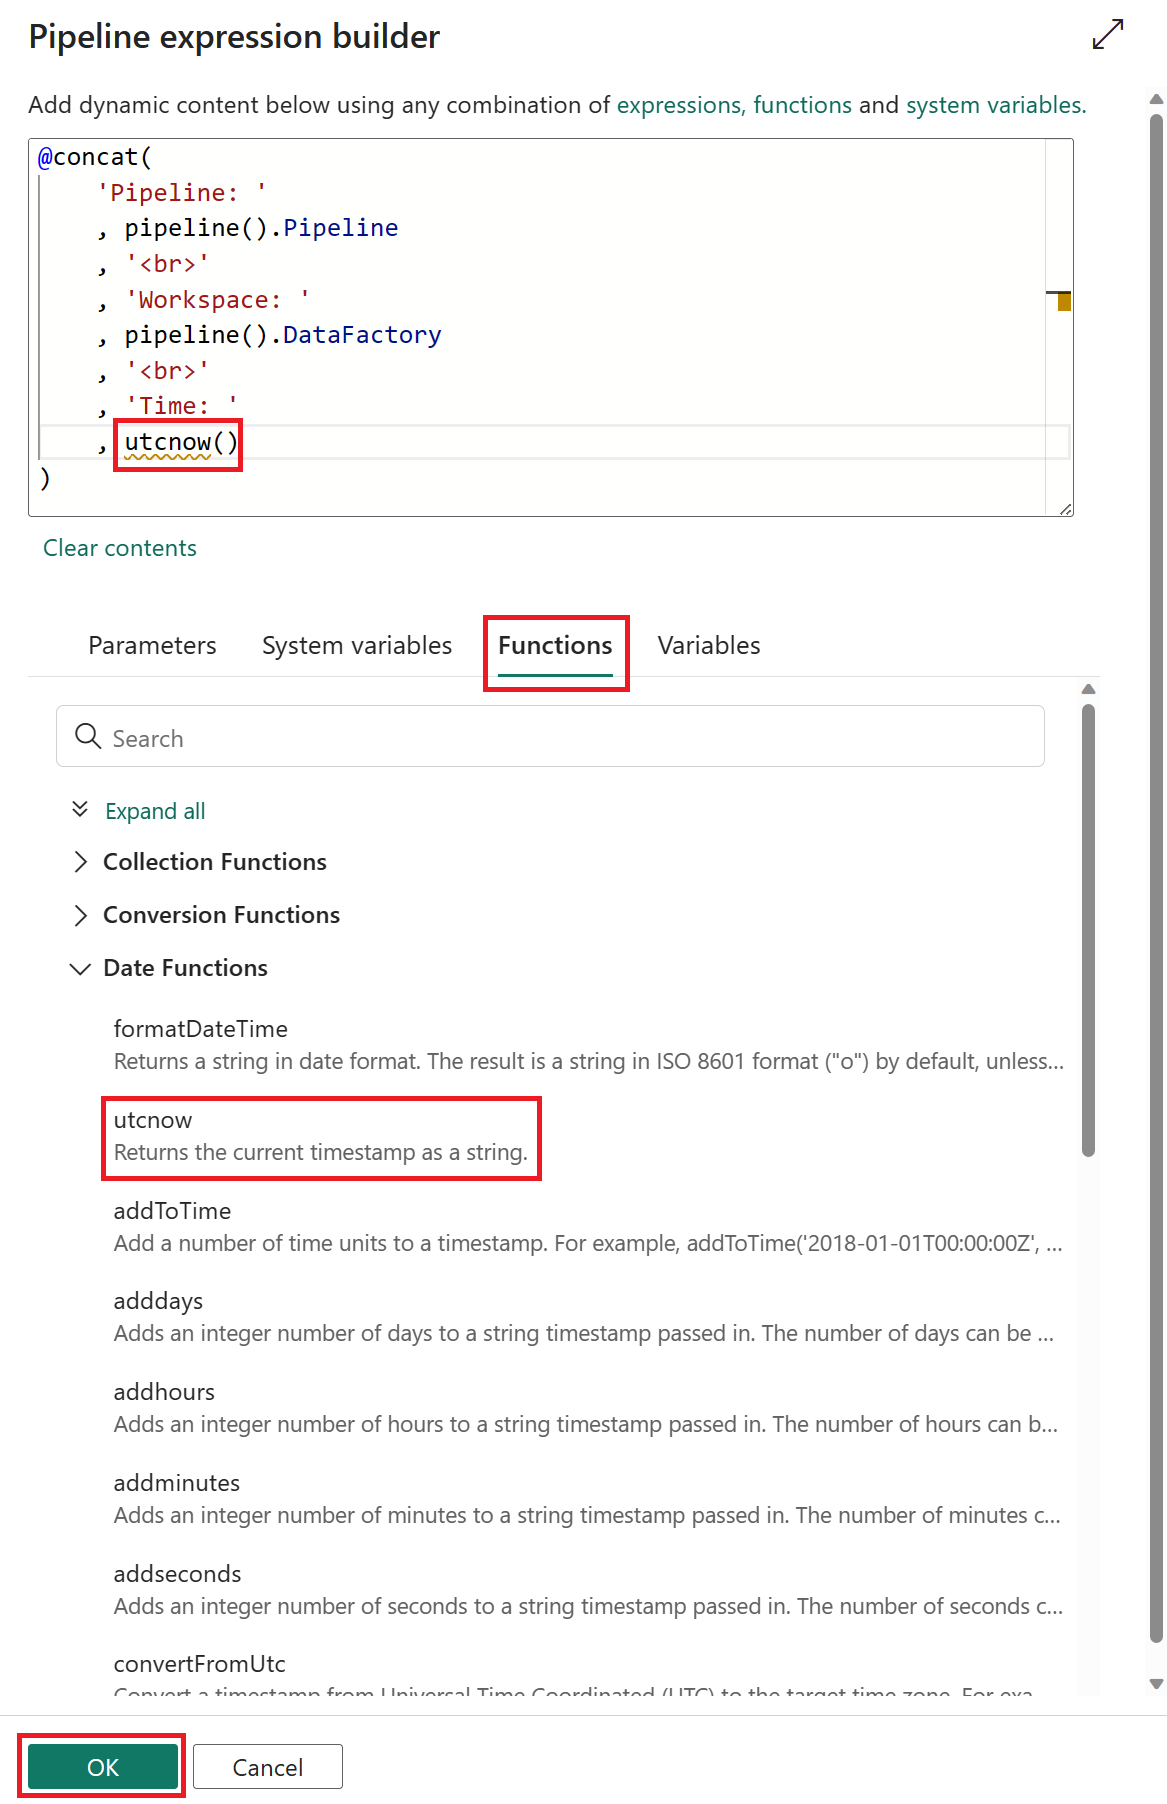
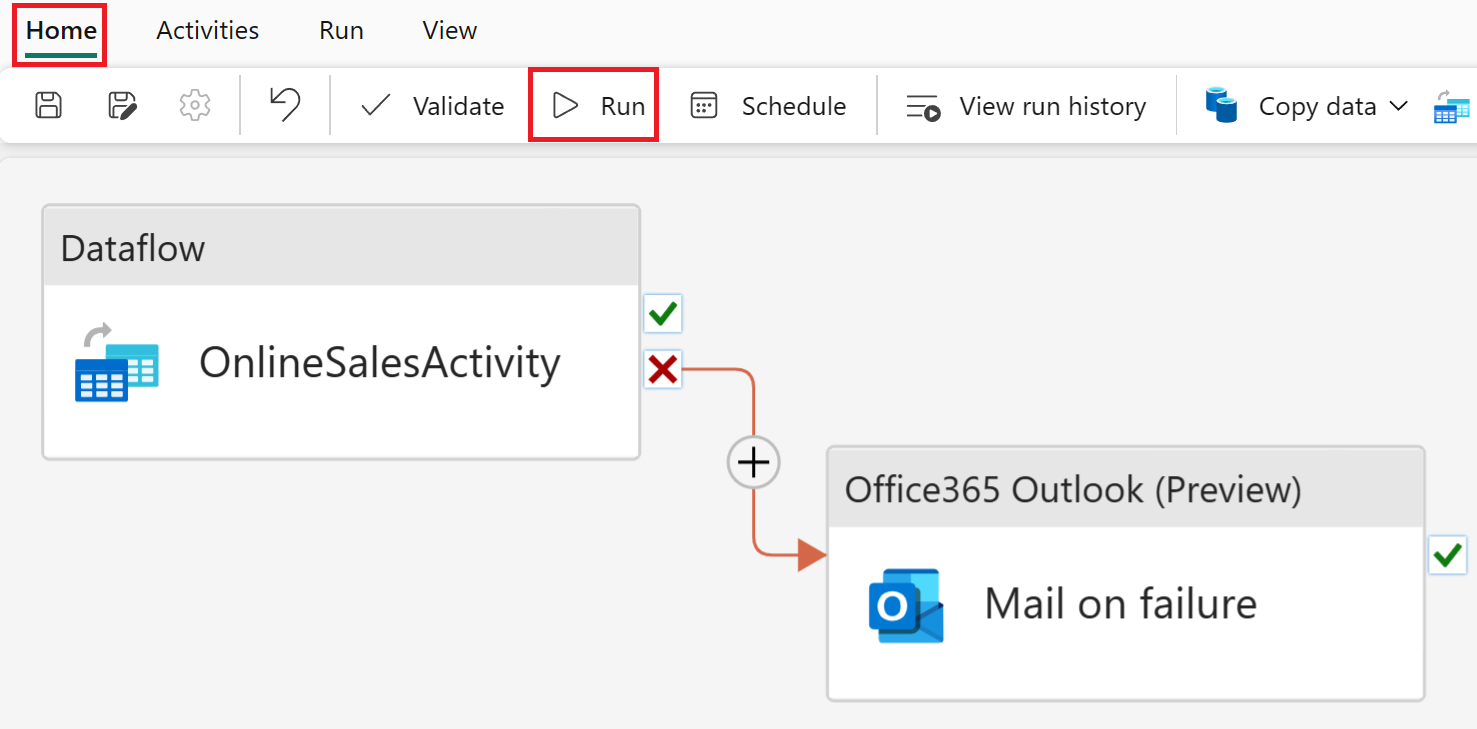
Select OnlineSalesActivity and from the available path options, select and hold the "X" (On fail) to create an arrow that will be dropped on the Mail on failure activity. This activity will now be invoked if the OnlineSalesActivity fails.
From the Home tab, select Schedule. Once you have updated the following configurations, select Apply to save your changes.
Name Value Scheduled run On Repeat Daily Time 12:00:00 AM 
From the Home tab, select Run. If a dialog window is displayed select the Save and run option to continue.
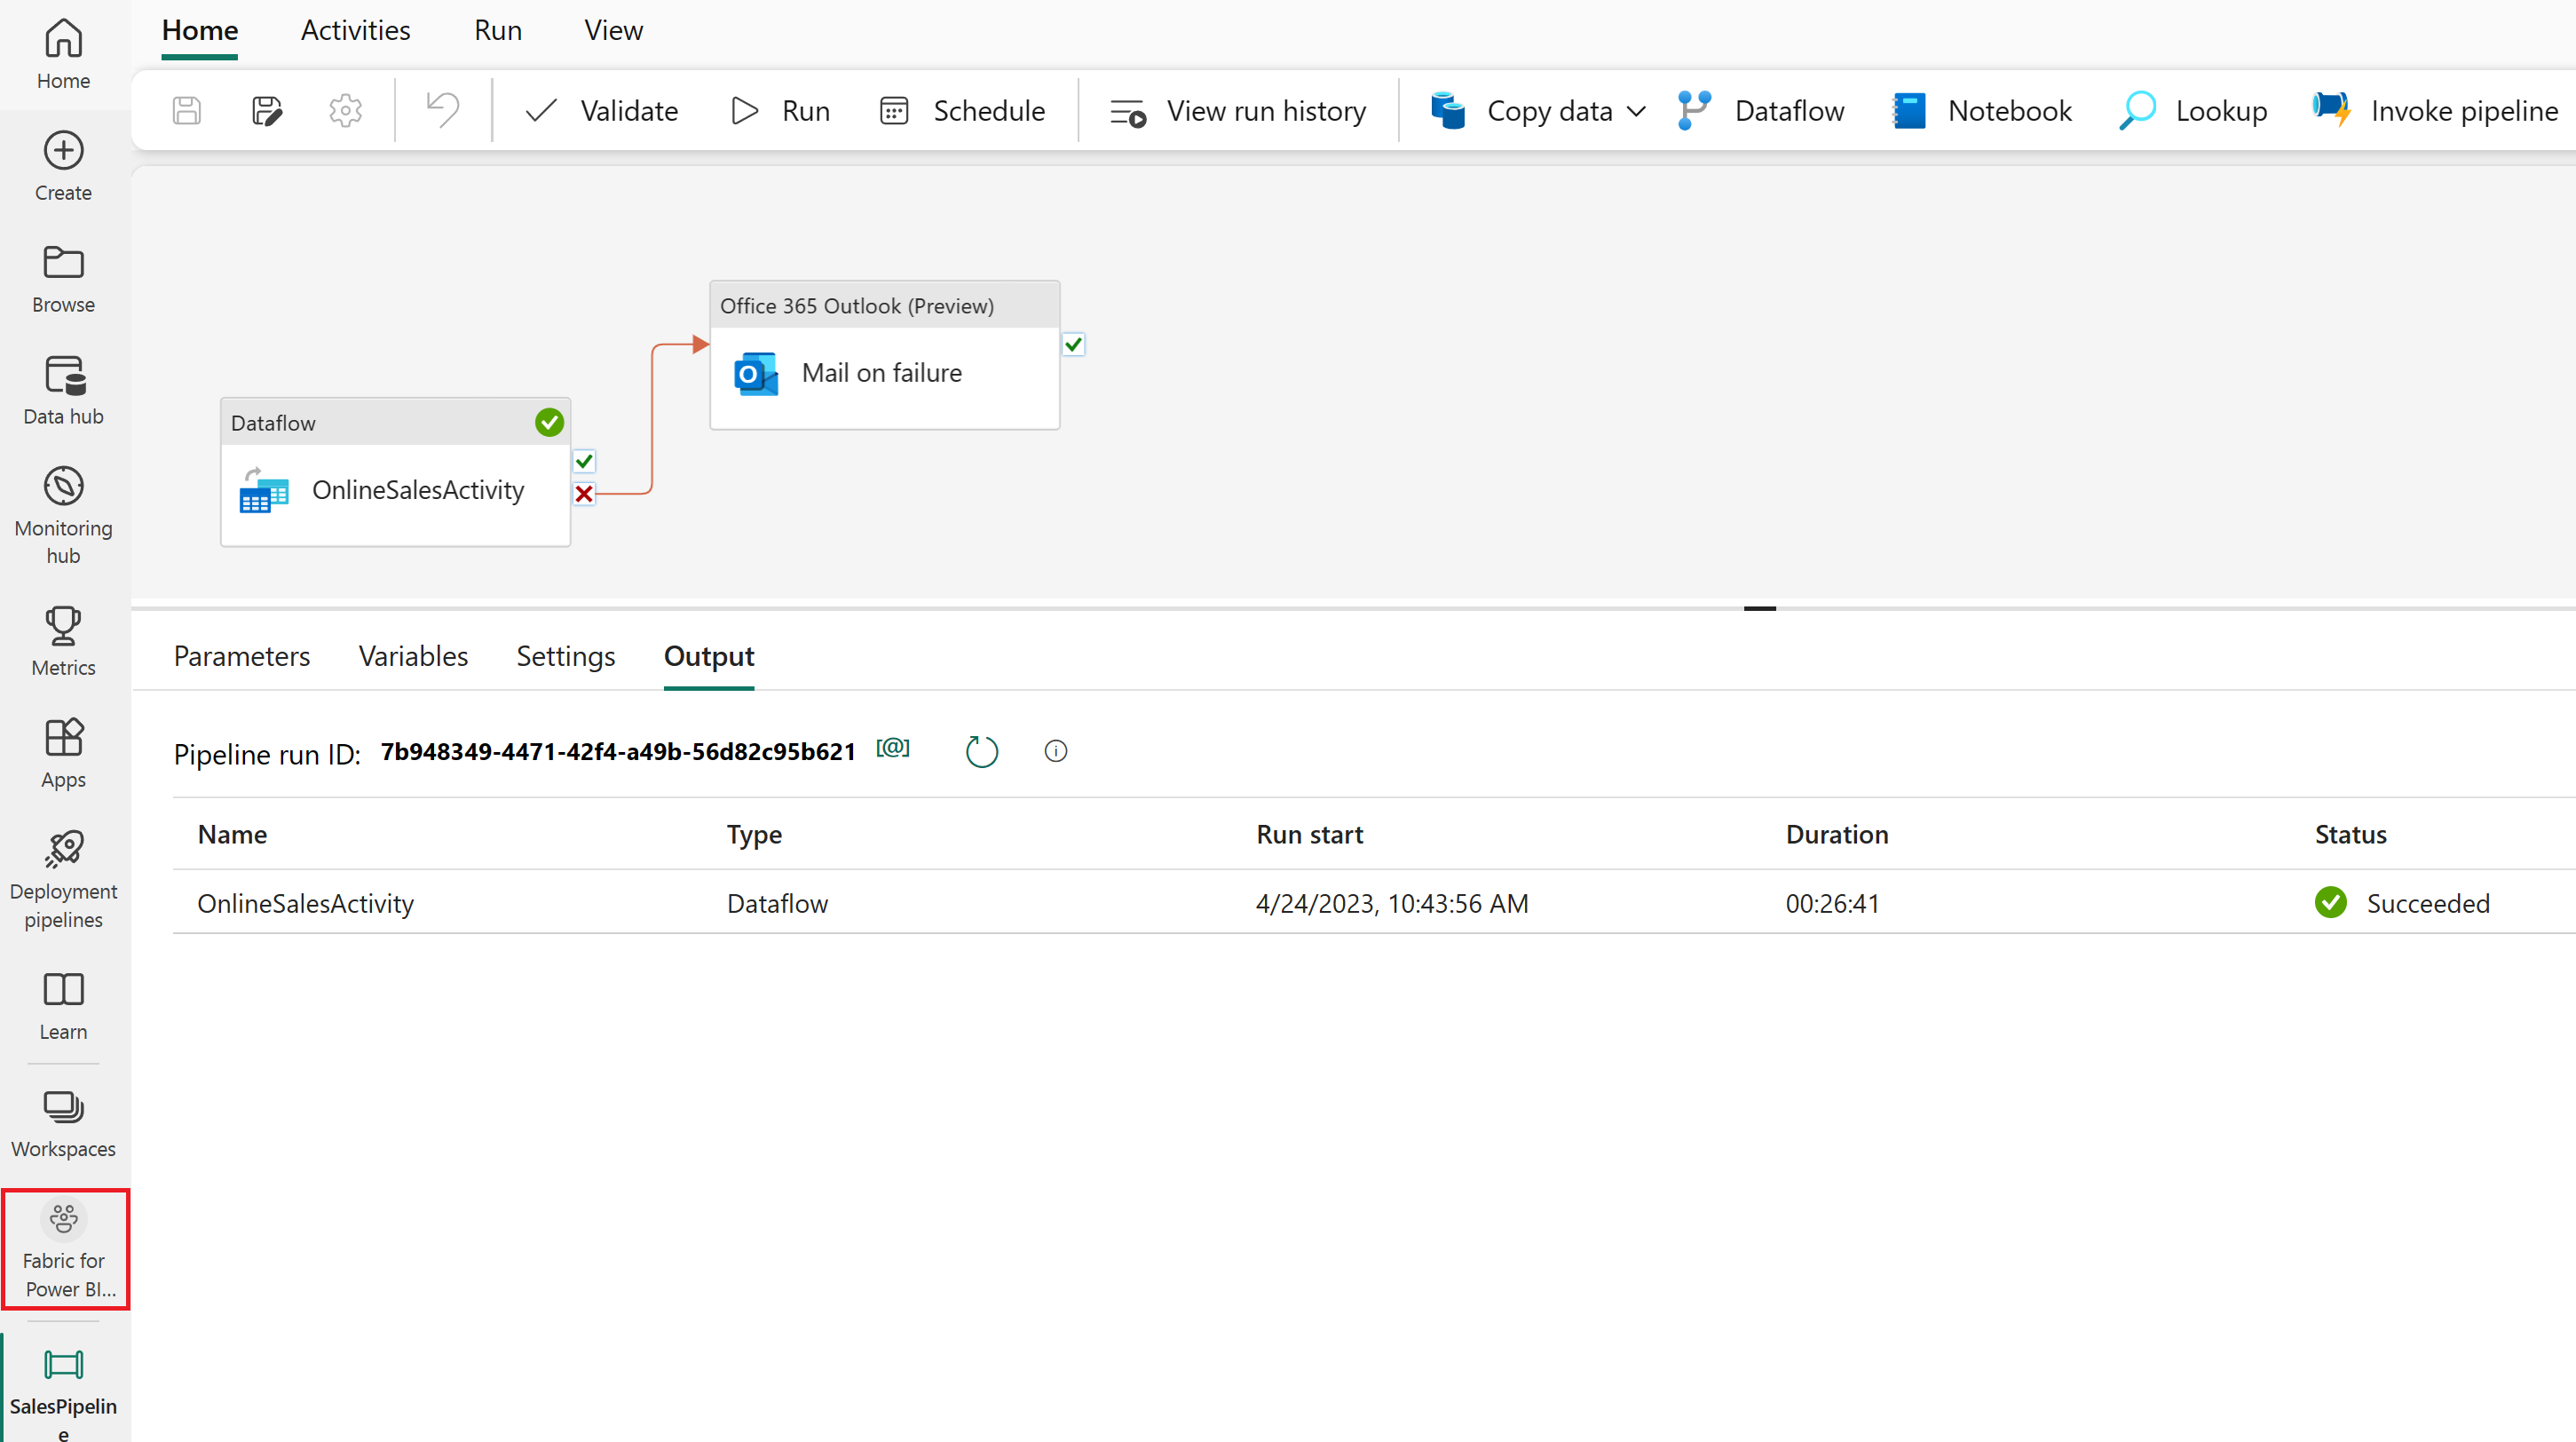
To monitor the pipeline’s current status, you can view the Output table, which displays the current activity progress. The table will periodically refresh on its own, or you can manually select the refresh icon to update it.
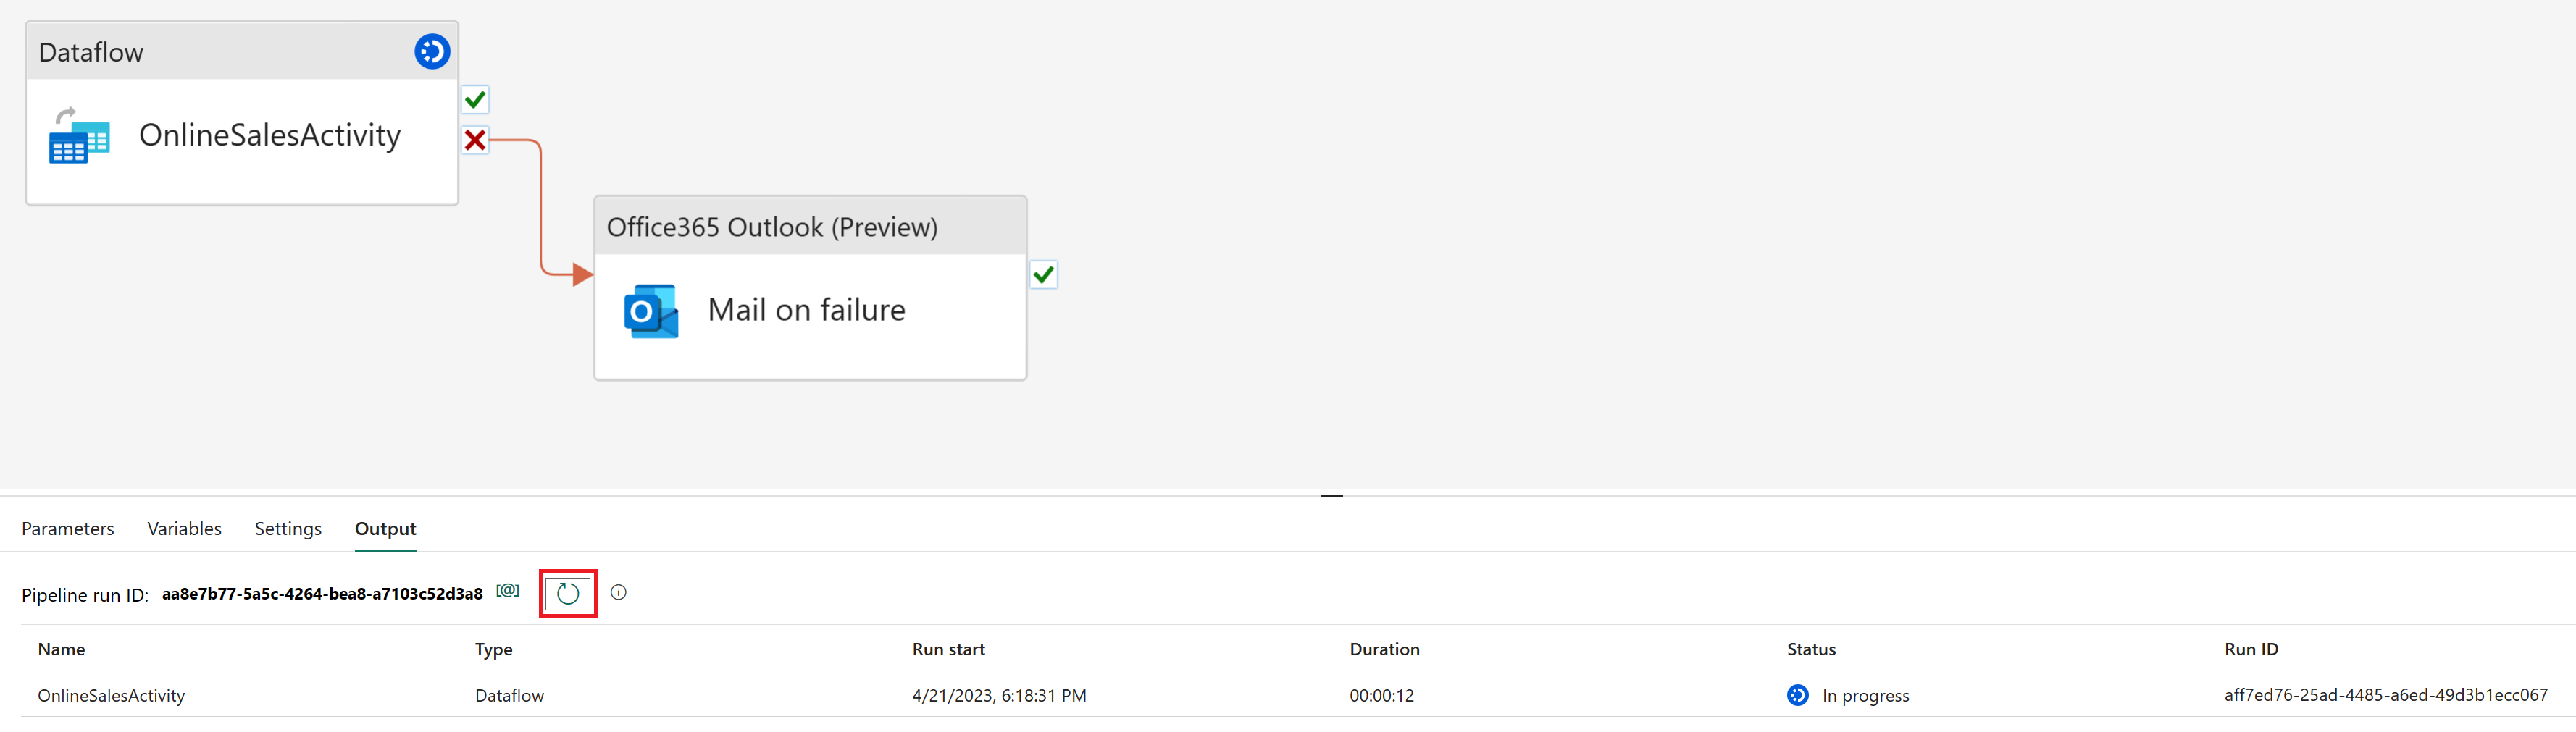
When the status returns Succeeded, you can proceed to the next section of the tutorial by returning to your workspace.


Create a semantic model in the Lakehouse
The data you loaded is almost ready for reporting. Let’s first use the SQL endpoint to create relationships and SQL views in our lakehouse. This allows us to easily access our data within a semantic model, which is a metadata model that contains physical database objects that are abstracted and modified into logical dimensions. It's designed to present data for analysis according to the structure of the business.
Create relationships
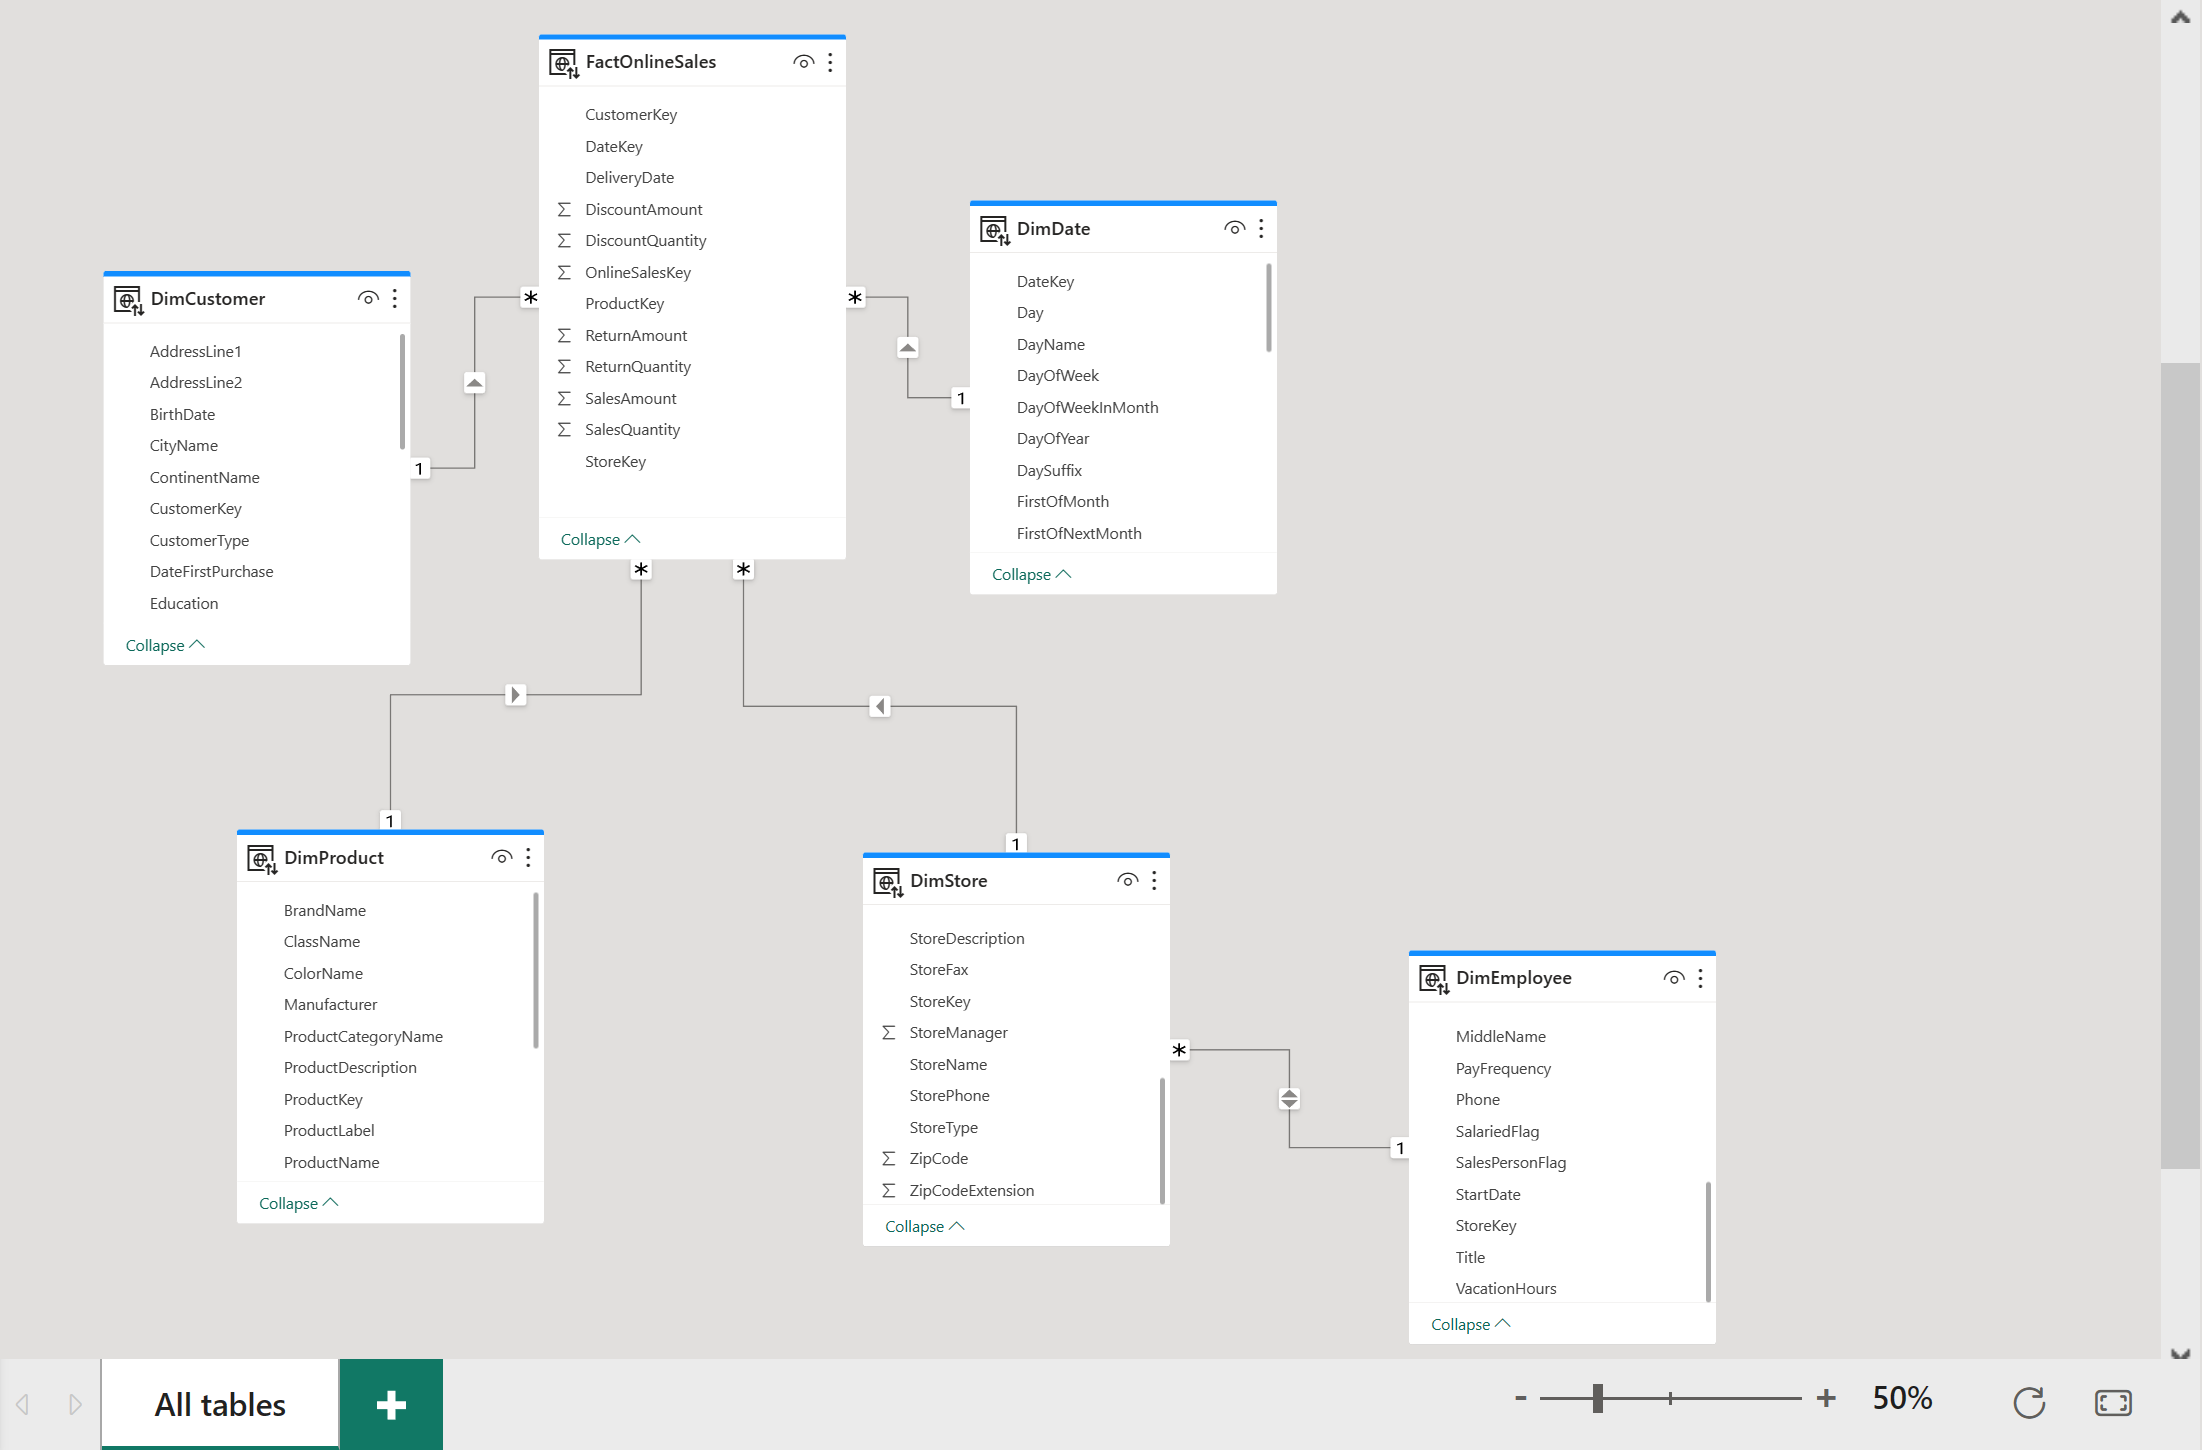
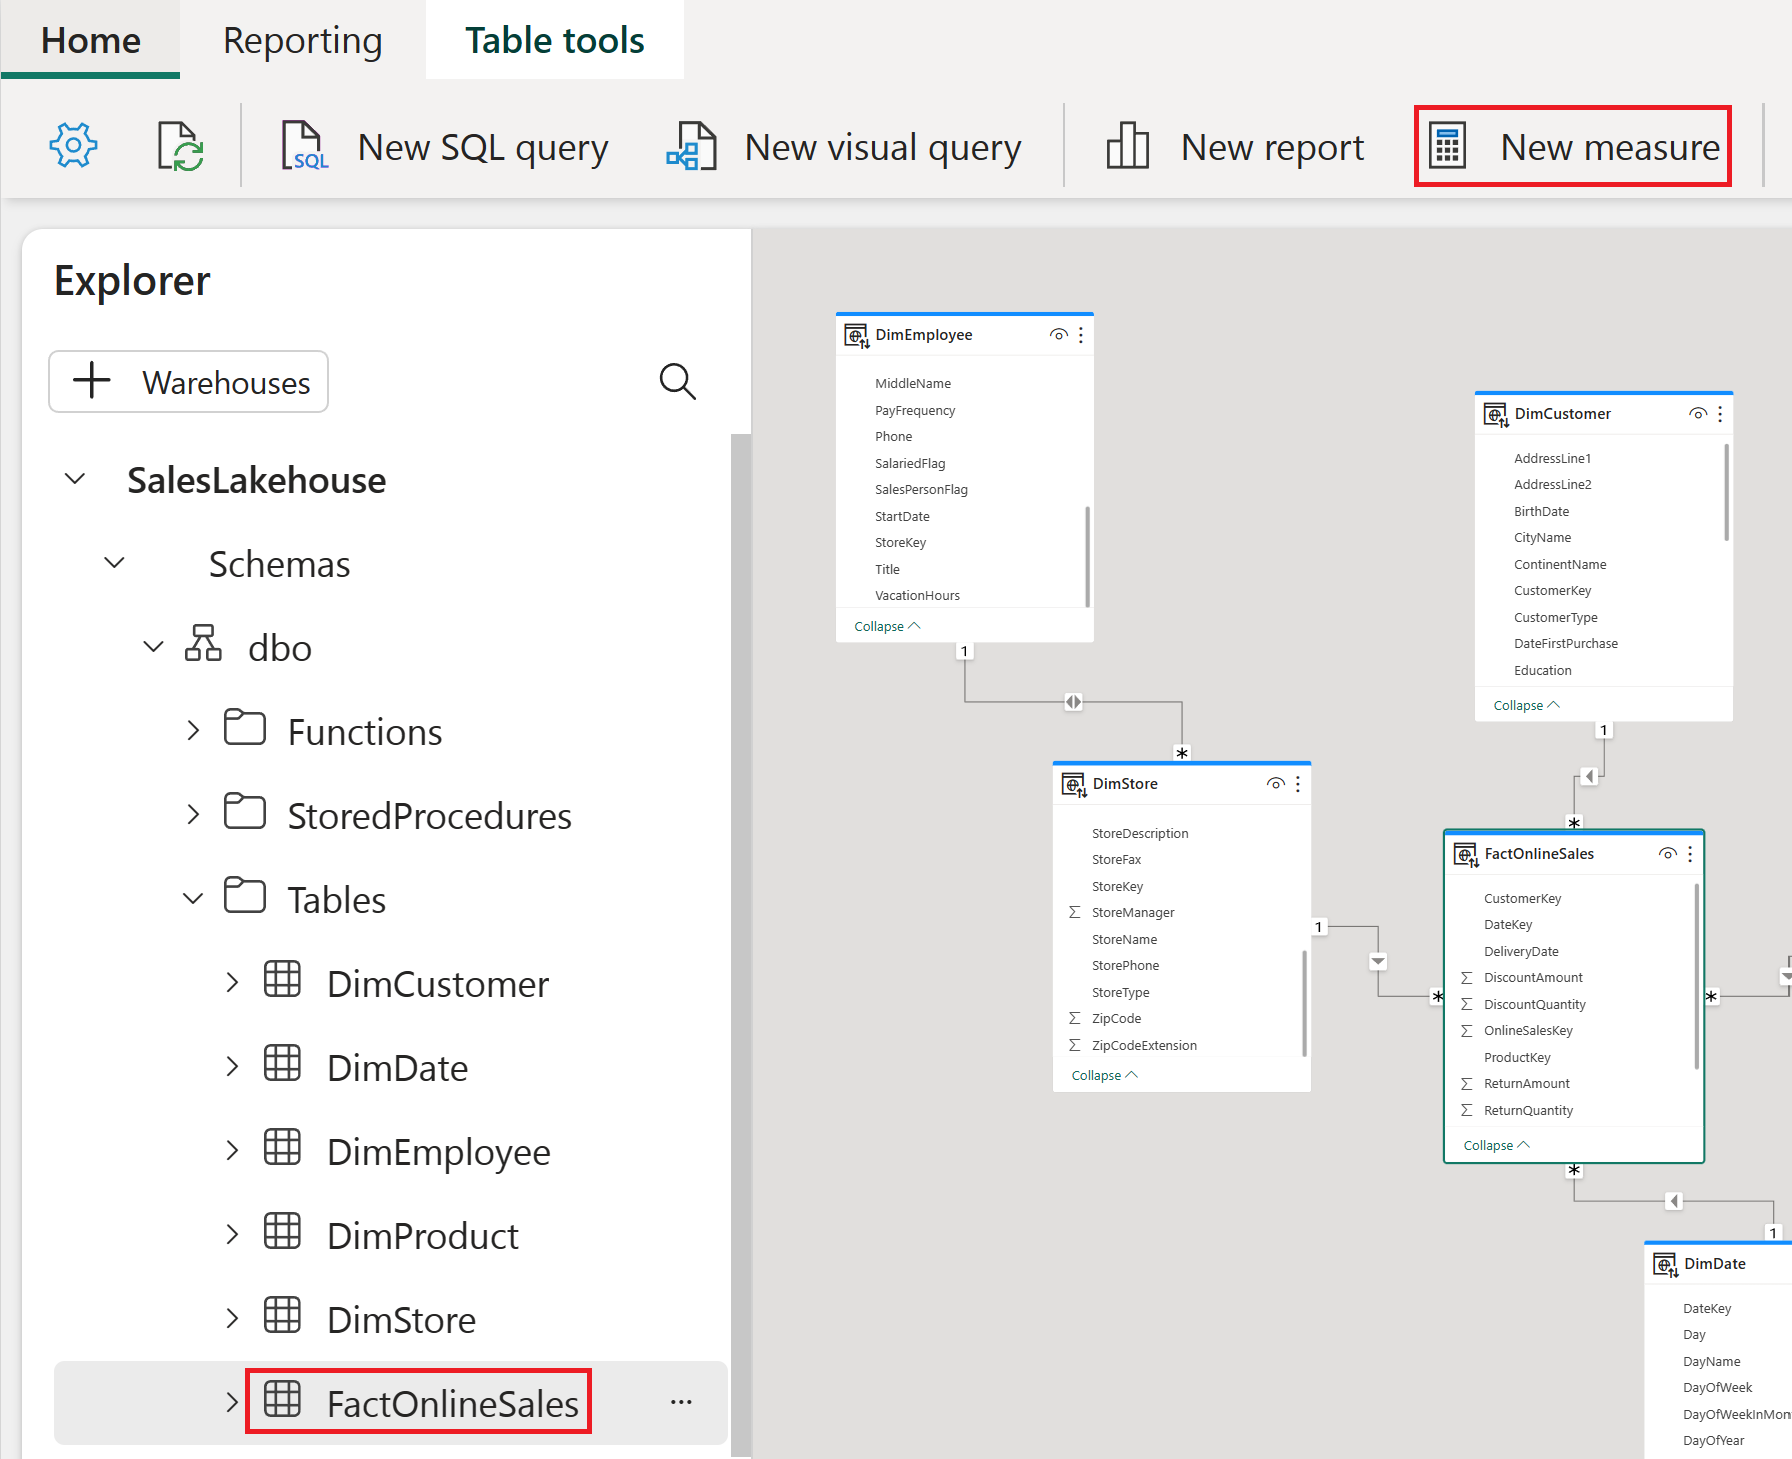
This model is a star schema that you might see from data warehouses: It resembles a star. The center of the star is a Fact table. The surrounding tables are called Dimension tables, which are related to the Fact table with relationships.
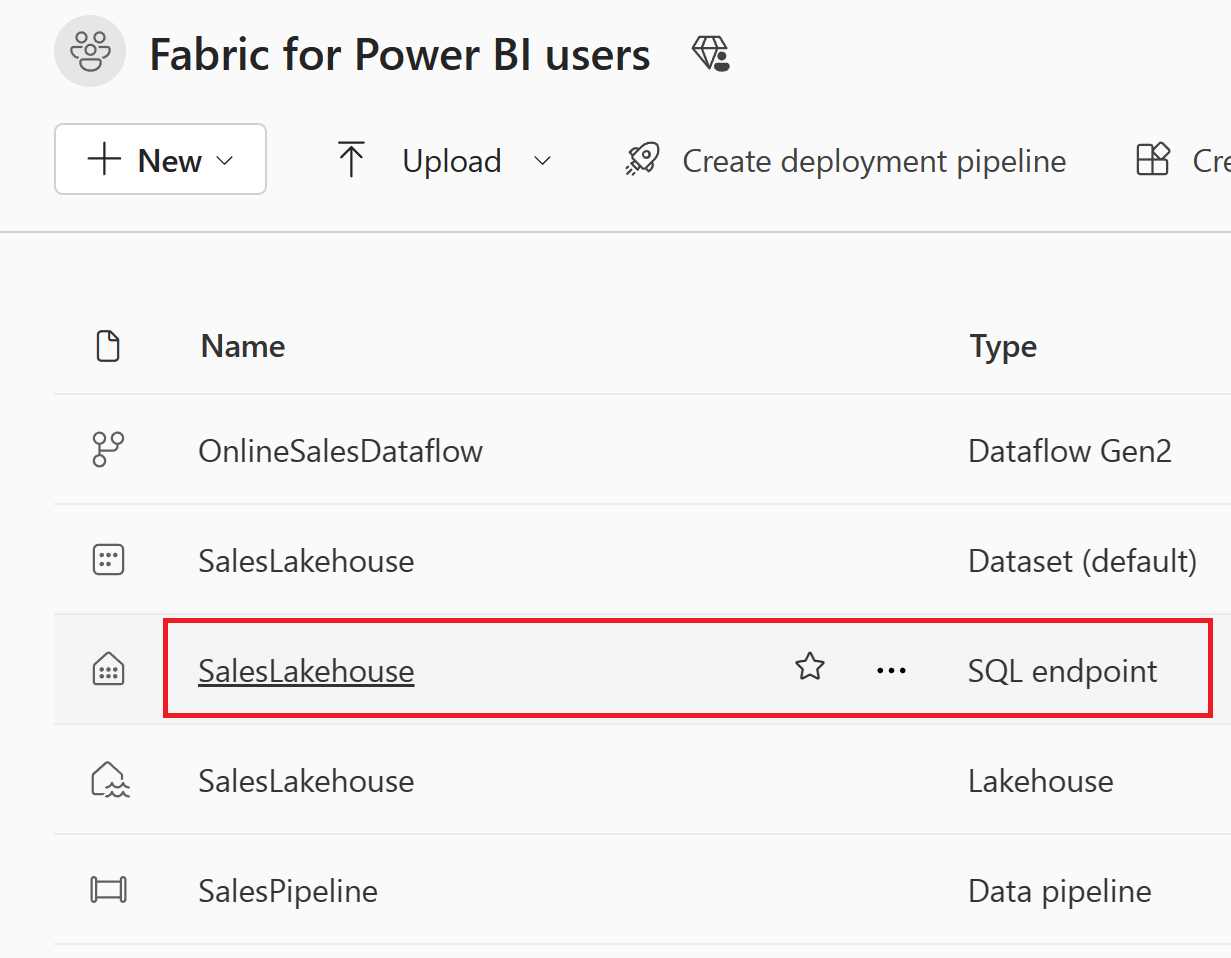
In the workspace view, select the SQL Endpoint item named SalesLakehouse.
Once in the Explorer, select the Model view at the bottom of the screen to begin creating relationships.
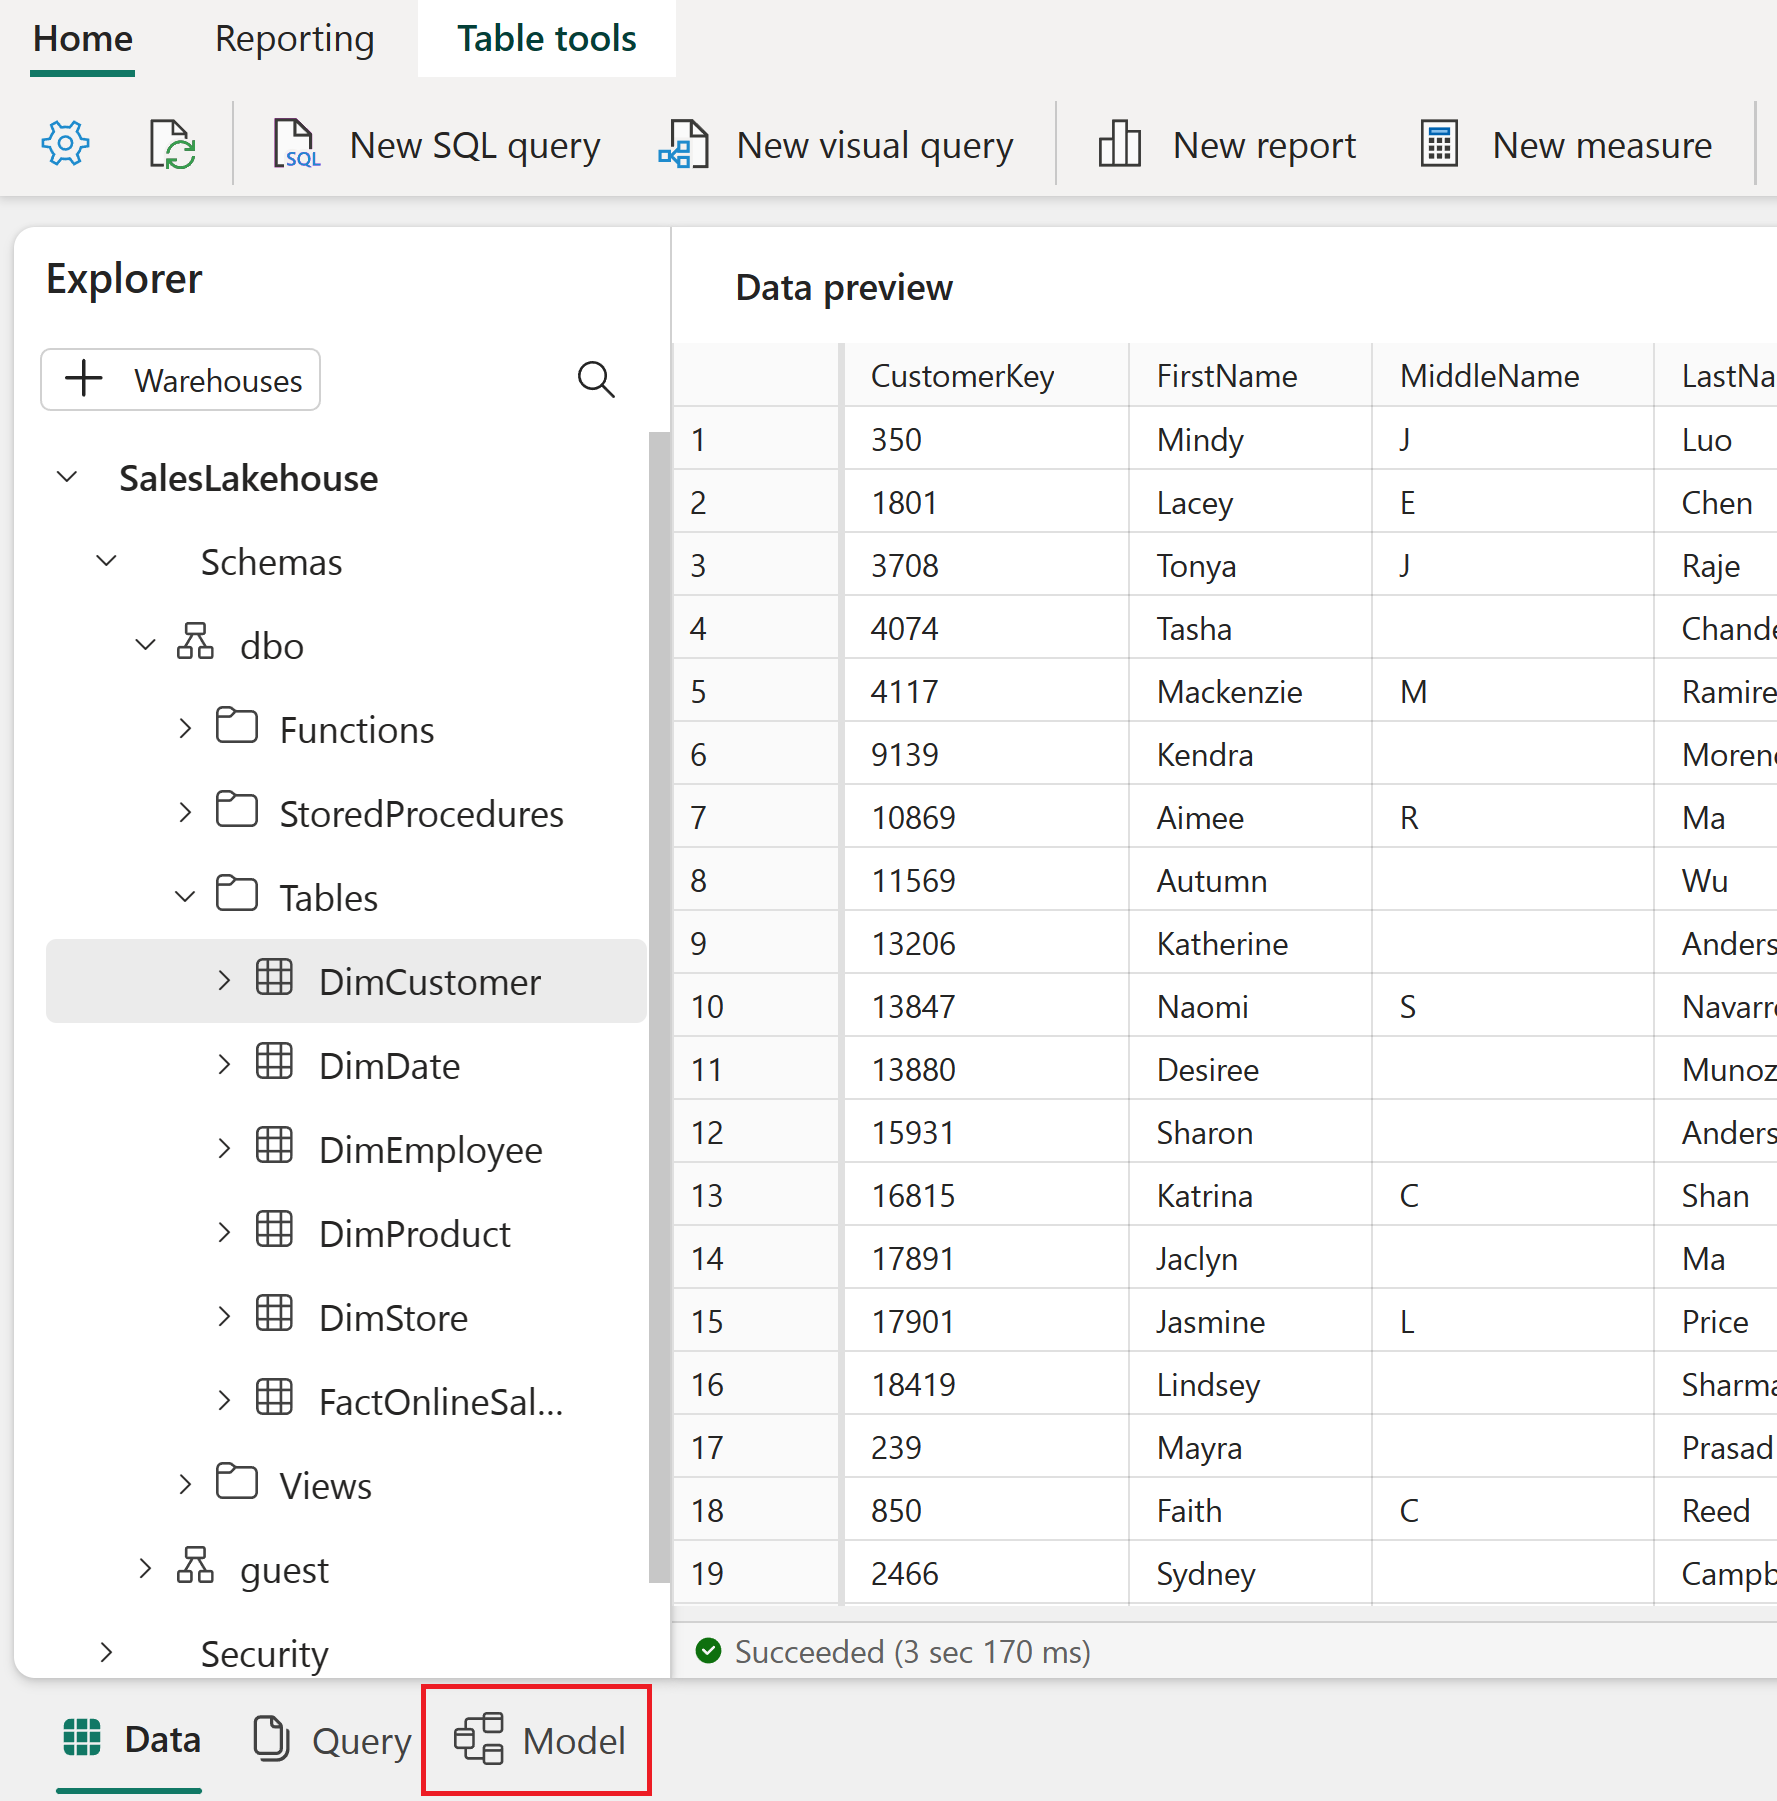
Create a relationship by dragging and dropping the column CustomerKey from the FactOnlineSales table, to the CustomerKey on the DimCustomer table.
Once in the Create Relationship window ensure that you have selected the correct tables, columns and settings as showing in the following table. Select Confirm to continue.
Make this relationship active From: Table 1 (column) To: Table 2 (column) Cardinality Cross filter direction ☑ FactOnlineSales (CustomerKey) DimCustomer (CustomerKey) Many to one (*:1) Single 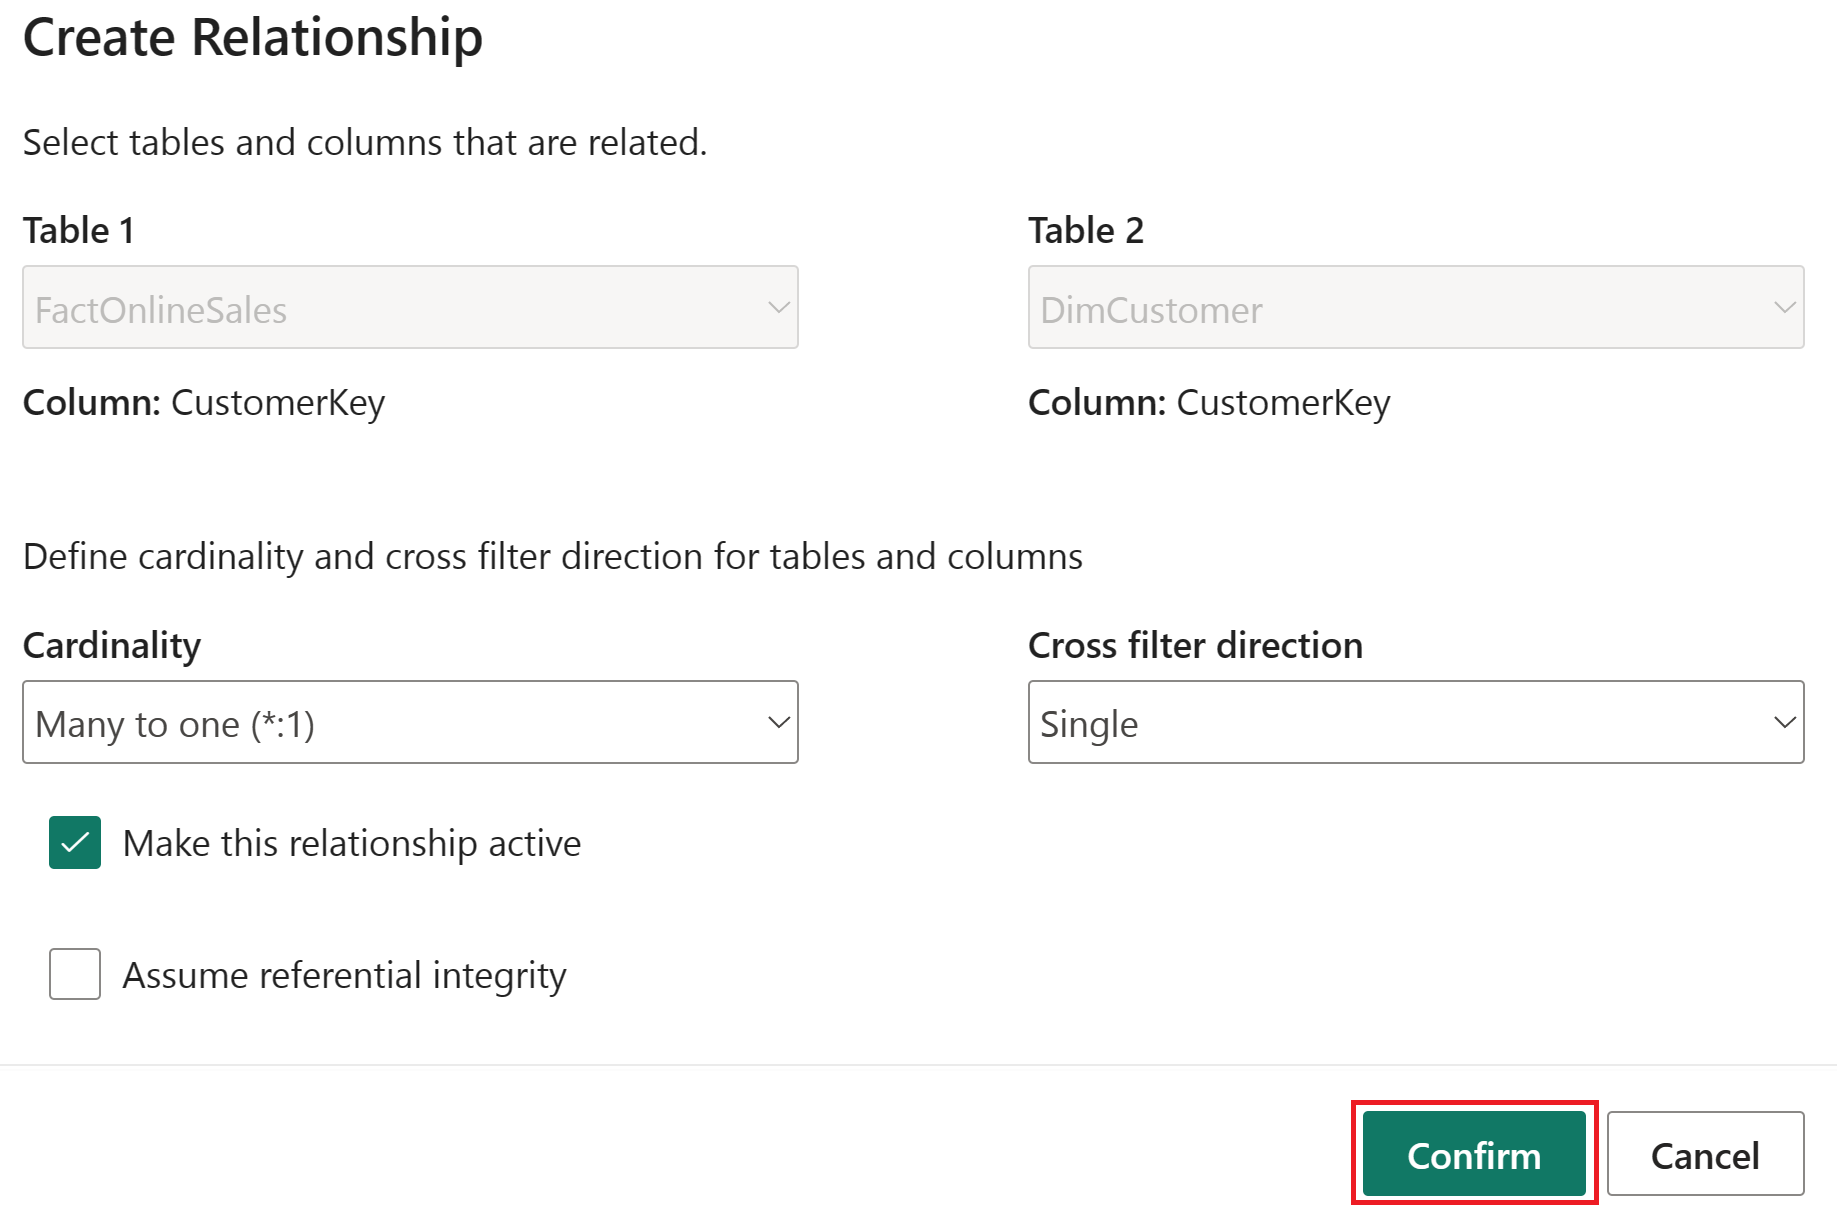
Perform these same steps for each of the remaining tables and columns listed in the following table to create relationships.
Make this relationship active From: Table 1 (column) To: Table 2 (column) Cardinality Cross filter direction ☑ FactOnlineSales (ProductKey) DimProduct (ProductKey) Many to one (*:1) Single ☑ FactOnlineSales (StoreKey) DimStore (StoreKey) Many to one (*:1) Single ☑ FactOnlineSales (DateKey) DimDate (DateKey) Many to one (*:1) Single ☑ DimStore (StoreKey) DimEmployee (StoreKey) Many to one (*:1) Both The following image shows a finished view of the semantic model with all the created relationships included.

Write a measure in DAX
Let's write a basic measure that calculates the total sales amount.
Select the FactOnlineSales table in the Tables folder. On the Home tab, select New measure.
In the formula editor, copy and paste or type the following measure to calculate the total sales amount. Select the check mark to commit.
Total Sales Amount = SUM(FactOnlineSales[SalesAmount])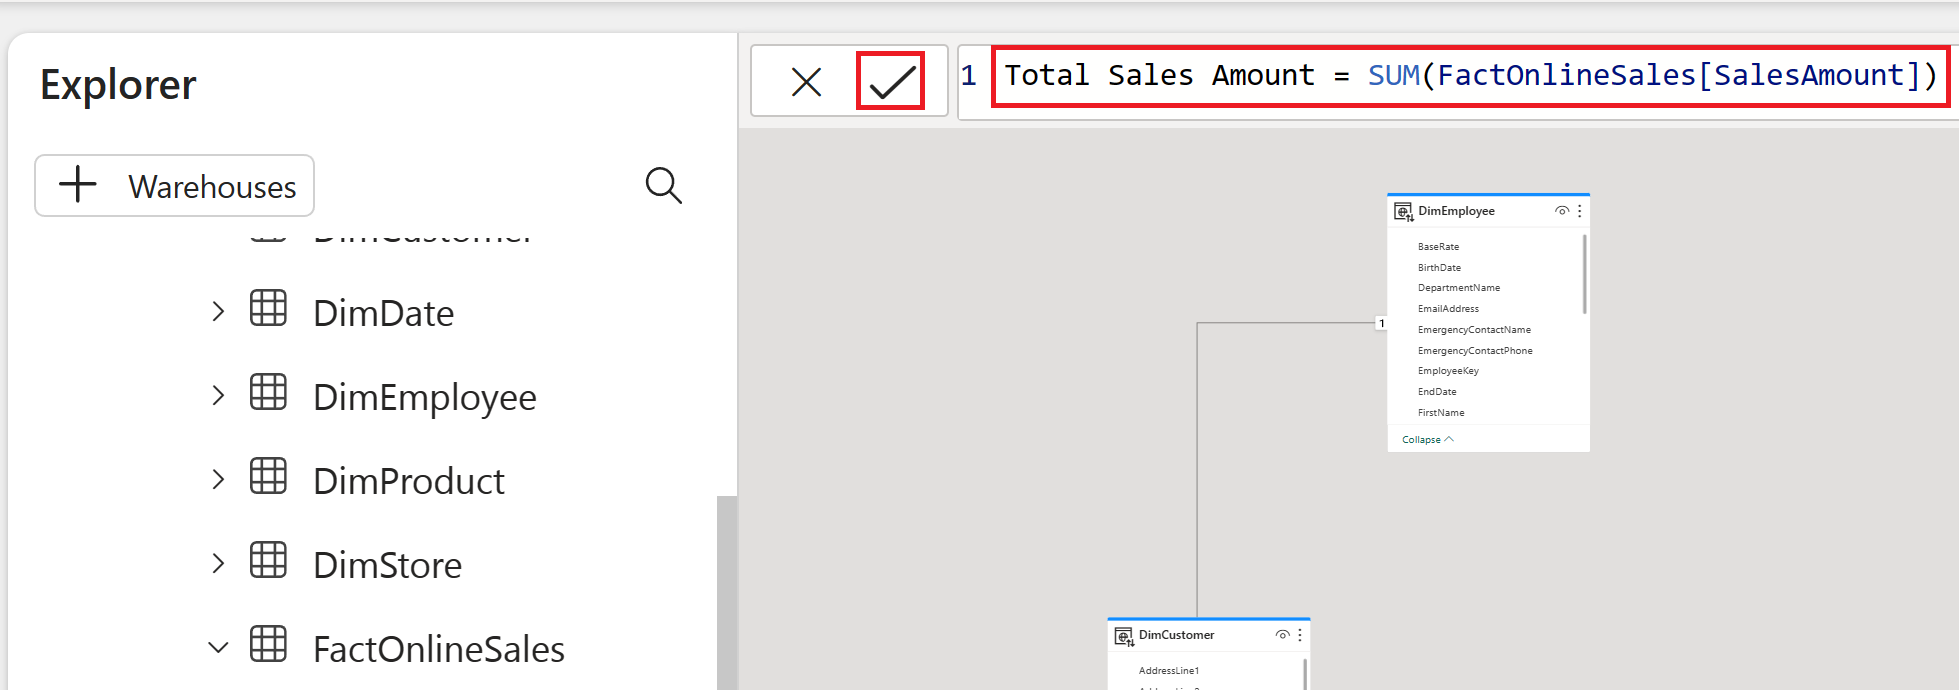
Create a SQL view
Let’s write a SQL statement that calculates the total sales amount by month. We’ll then save this statement as a view in our lakehouse. This will allow us to easily access the total sales amount by month in the future.
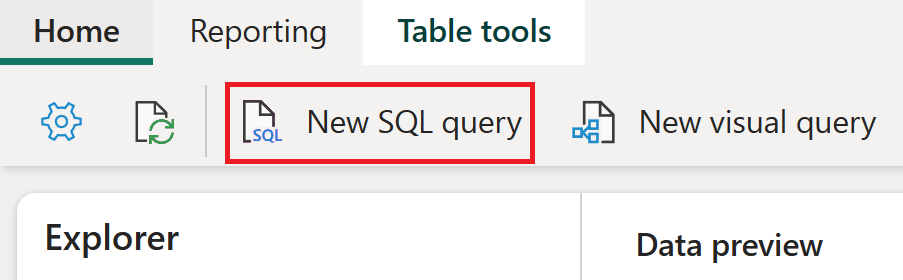
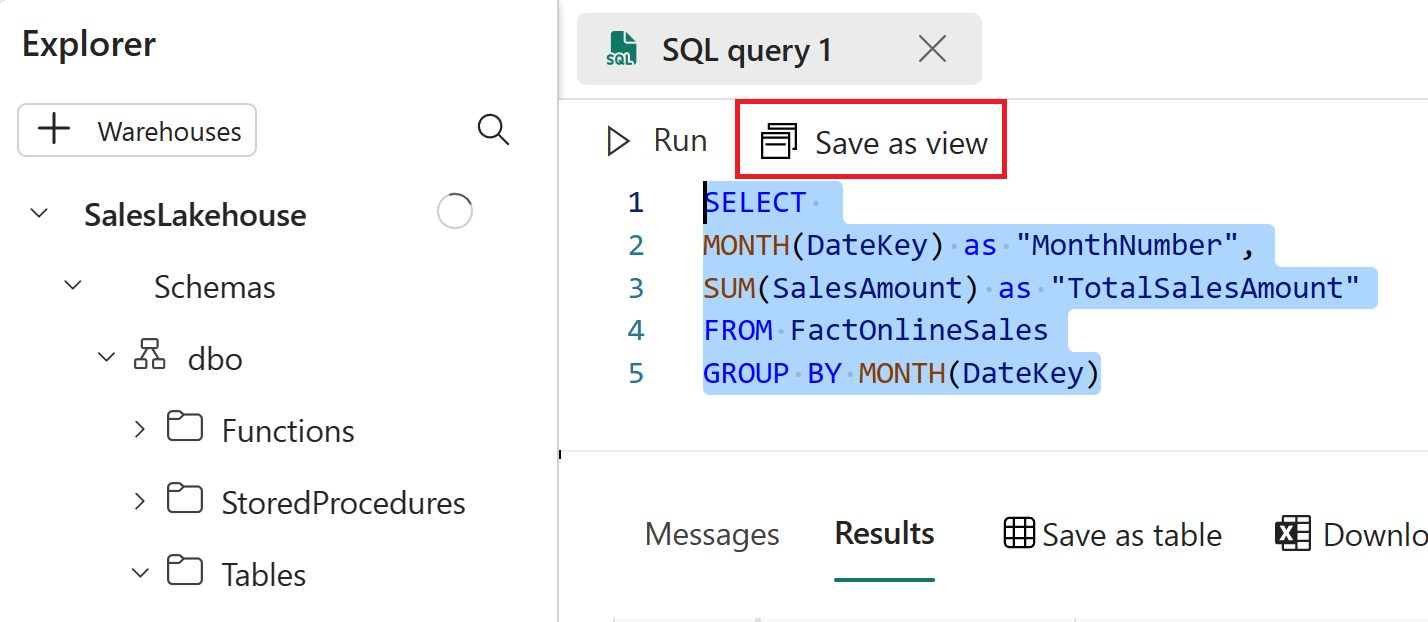
On the Home tab, select New SQL query.
In the query editor, copy and paste or type the query below to calculate the total sales amount by month number in descending order. Once entered, select Run to view results.
SELECT
MONTH(DateKey) as "MonthNumber",
SUM(SalesAmount) as "TotalSalesAmount"
FROM FactOnlineSales
GROUP BY MONTH(DateKey)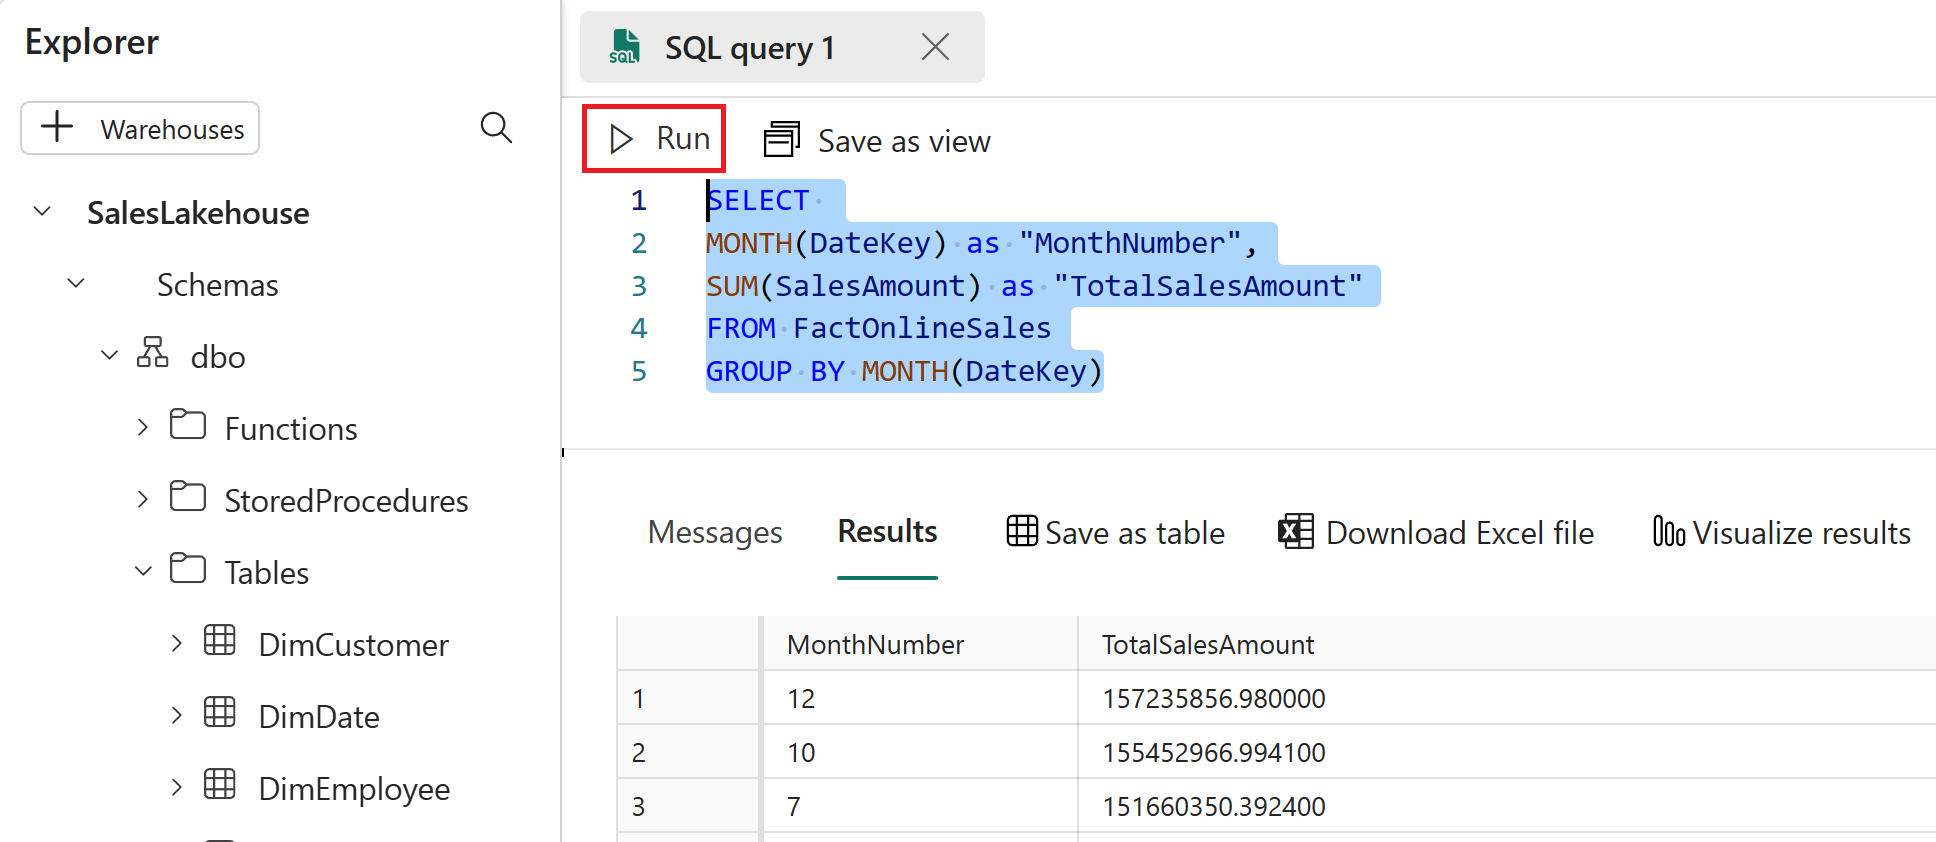
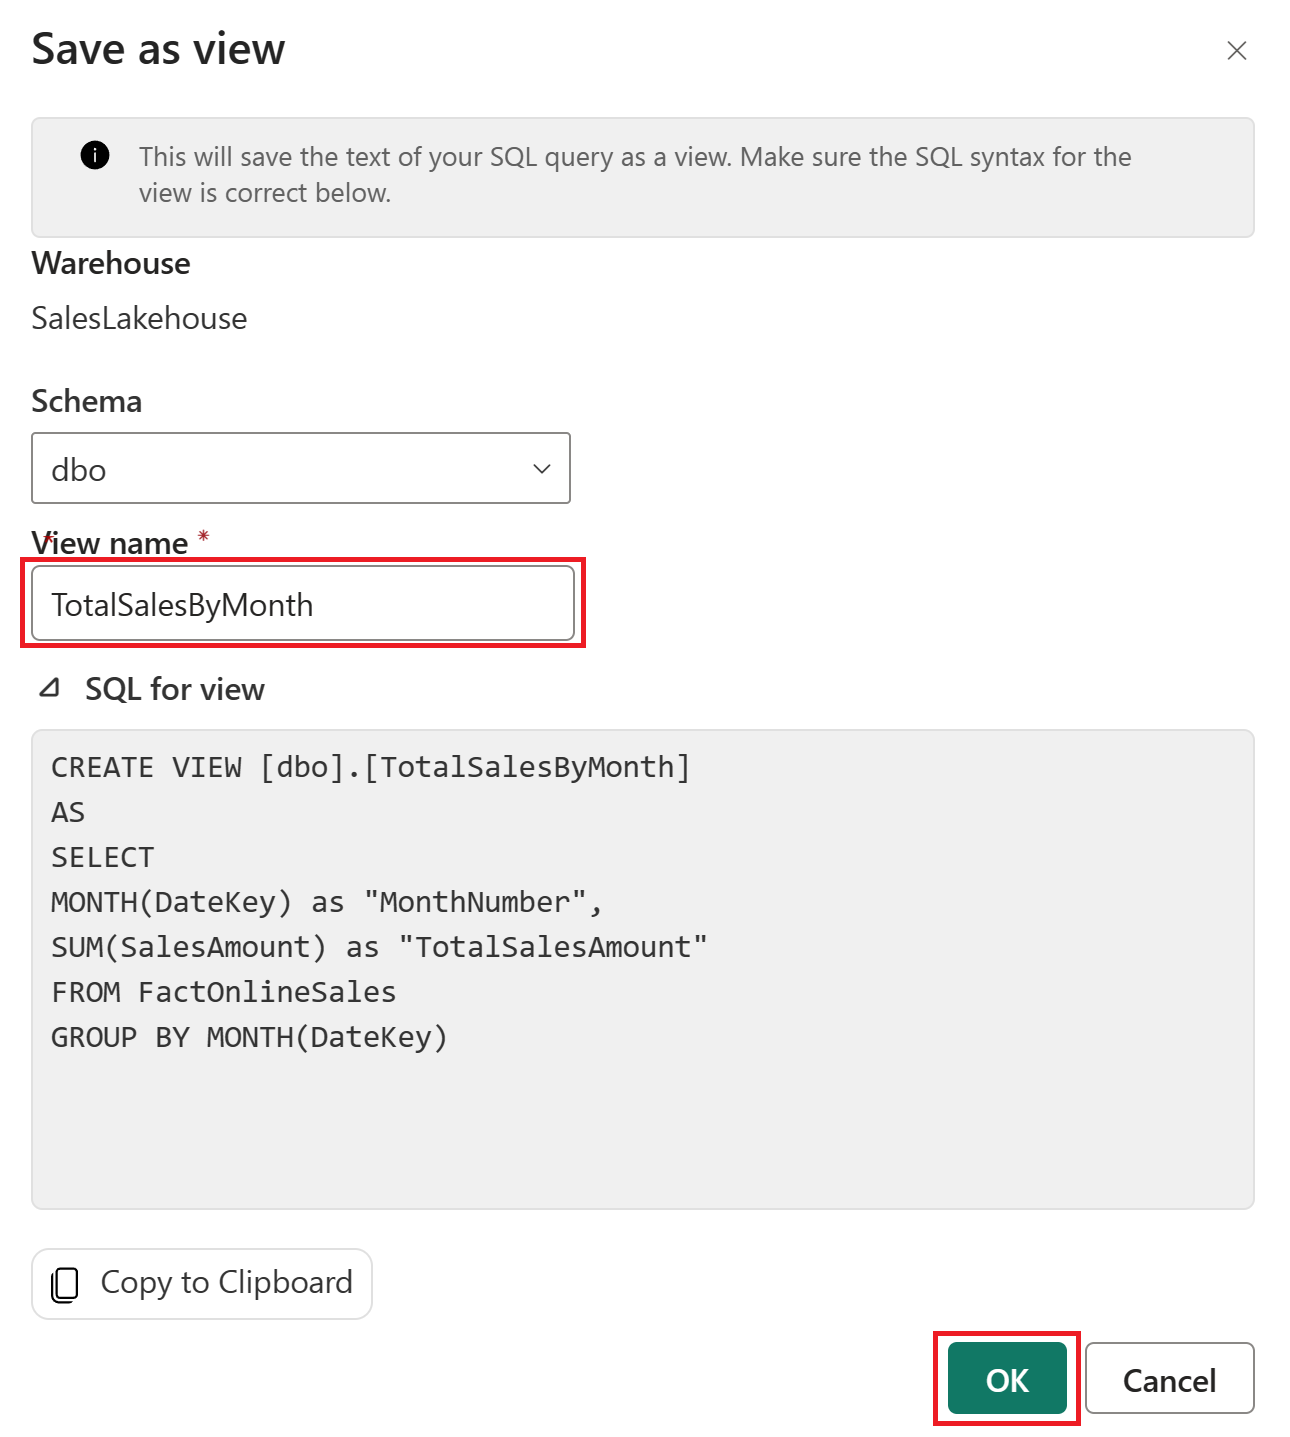
Highlight the full query text and select Save as view.
In the Save as view window, set the View name to TotalSalesByMonth and then select OK.
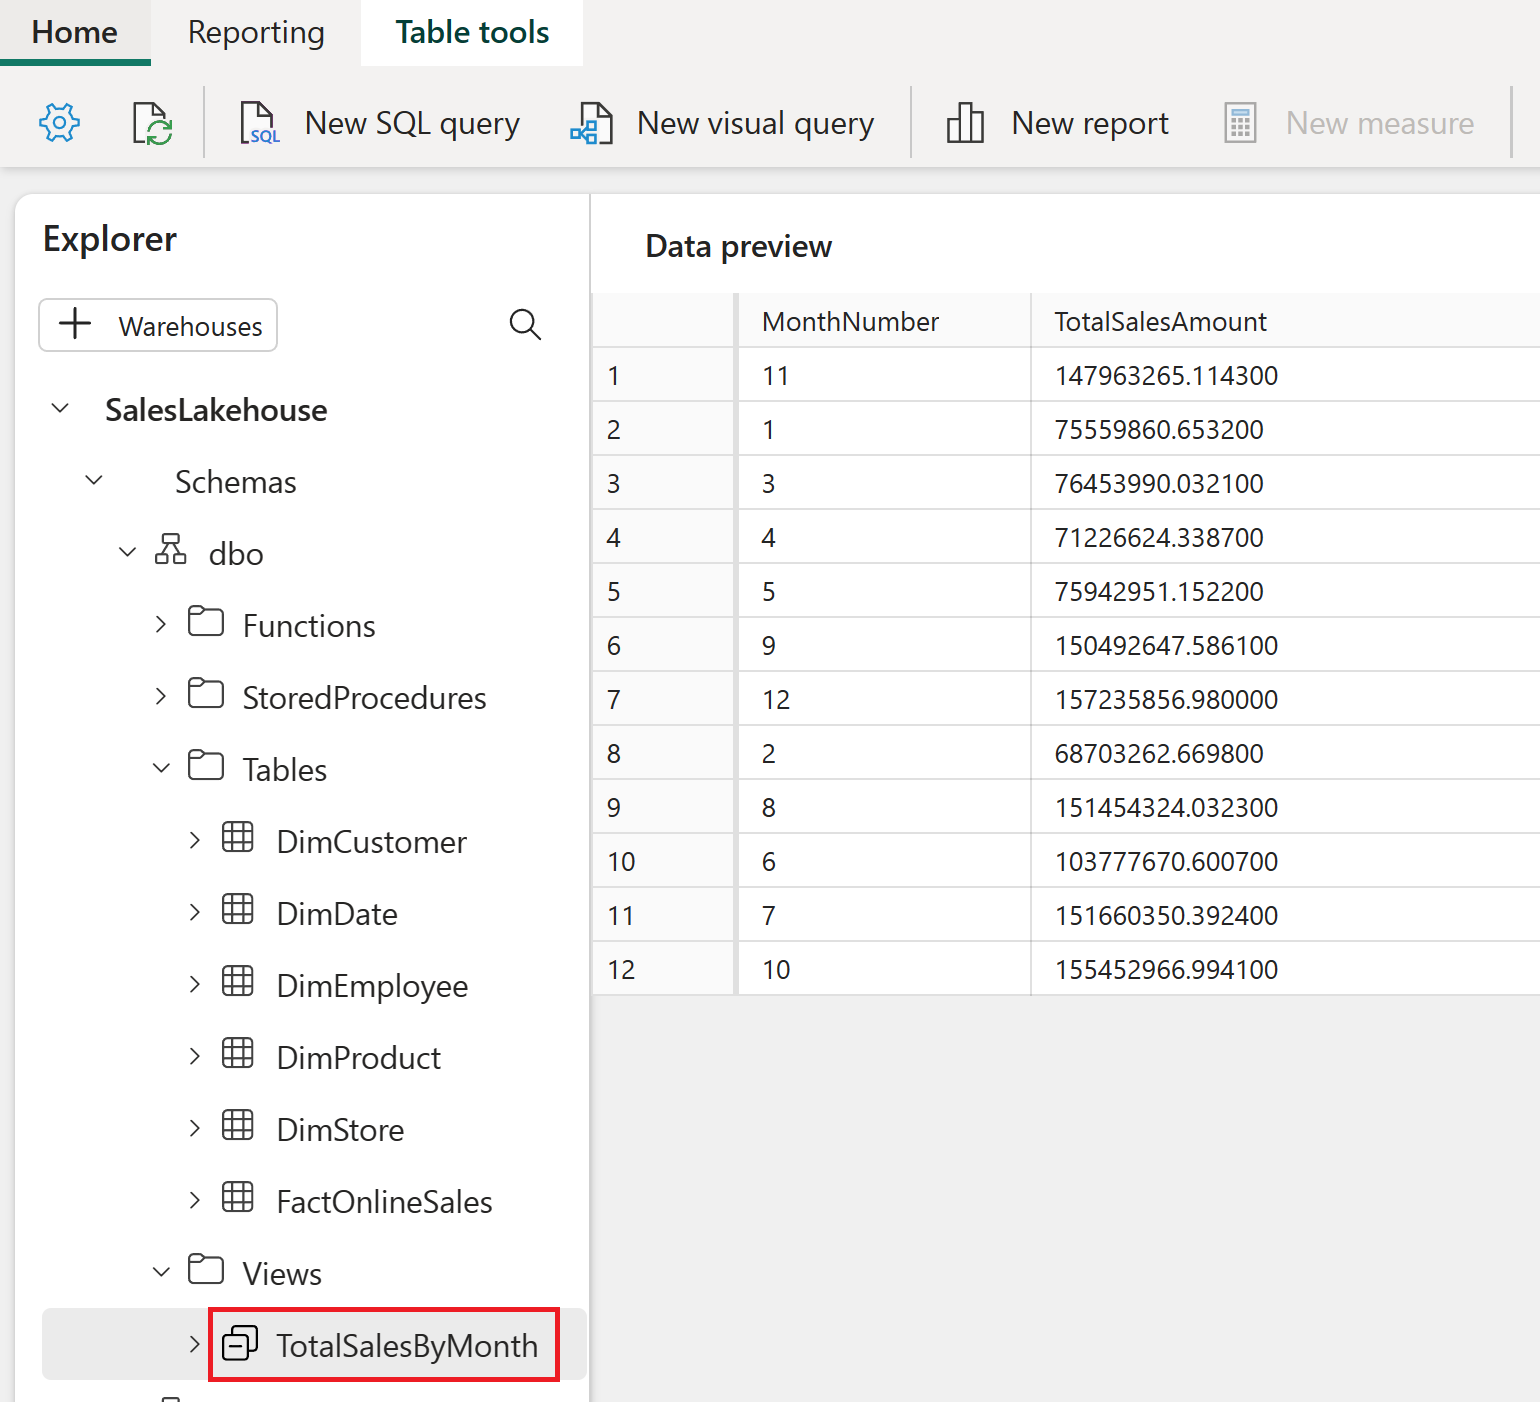
In the Explorer, expand the Views section and select TotalSalesByMonth to view the results in the Data preview.
Once you're done exploring the SQL endpoint editor, you can proceed to the next section of the tutorial by returning to your workspace.
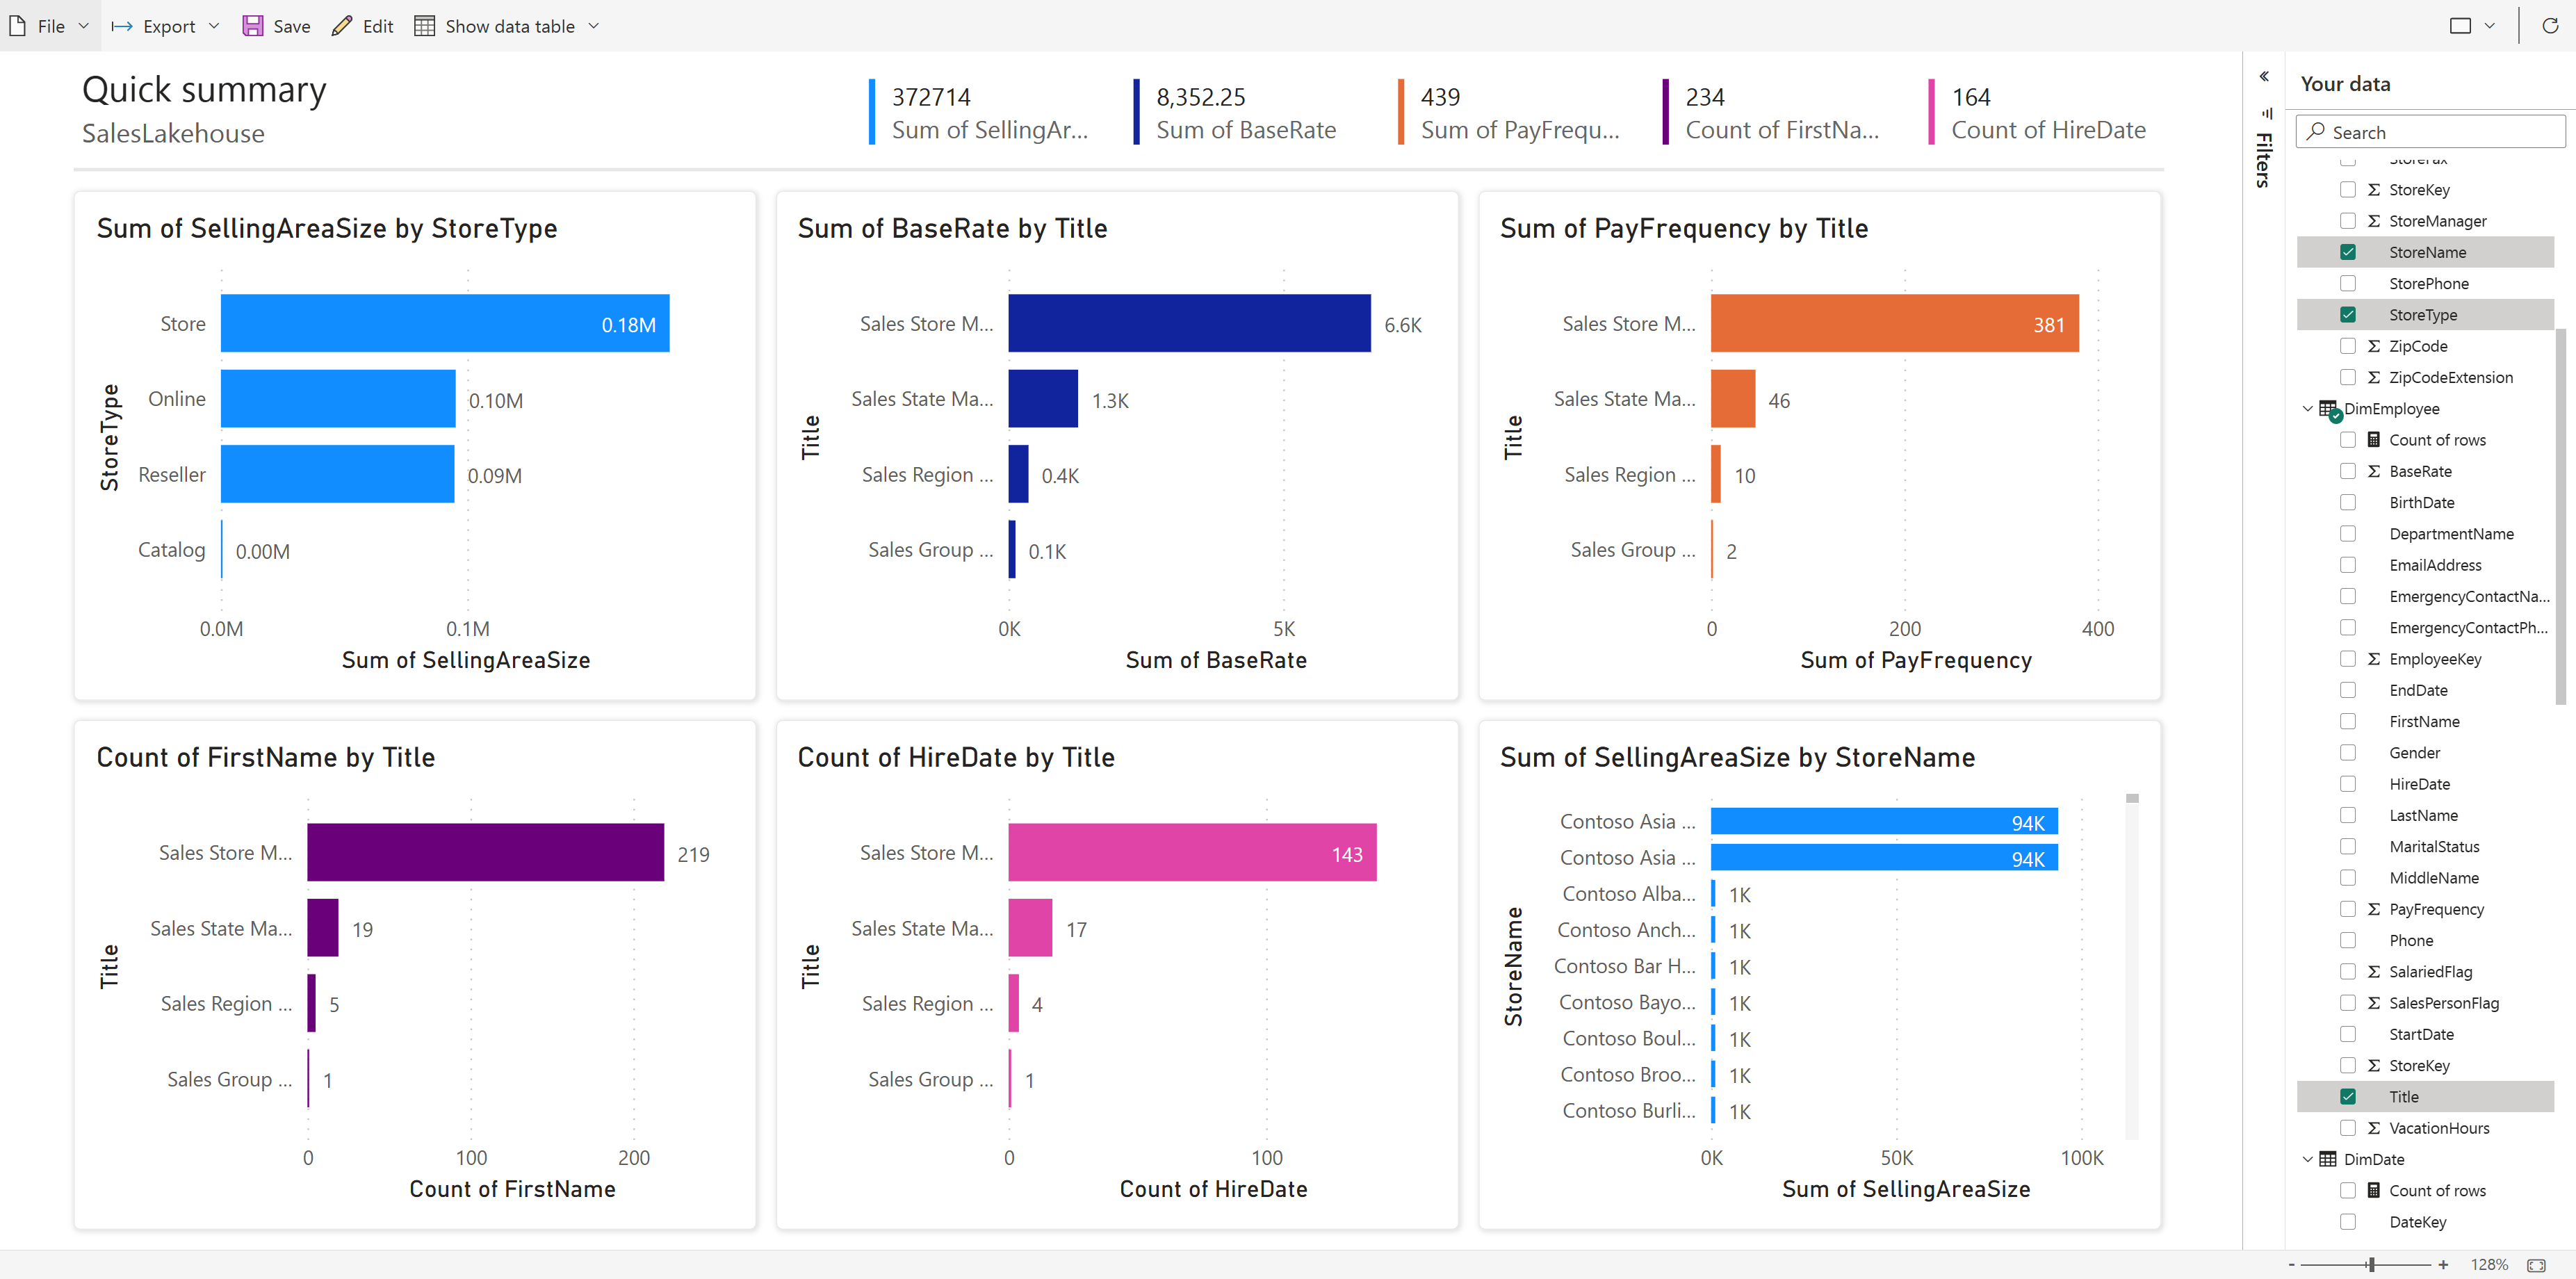
Autocreate a report
Now that you’ve modeled your data, it's time to visualize and explore your data using quick create.
In the workspace view, hover above the item type Dataset (default) and item name SalesLakehouse. Select the ellipses ( … ) and choose Auto-create report.

A report is automatically generated for you and dynamically updates based upon column selections in the Your data pane.
- The displayed report may differ from the image below.
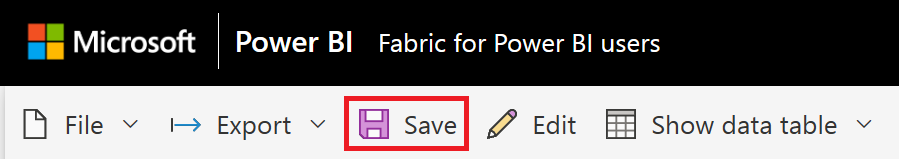
Select Save from the ribbon to save a copy to the current workspace
- To enter the complete visual authoring experience, you can select Edit on the ribbon.
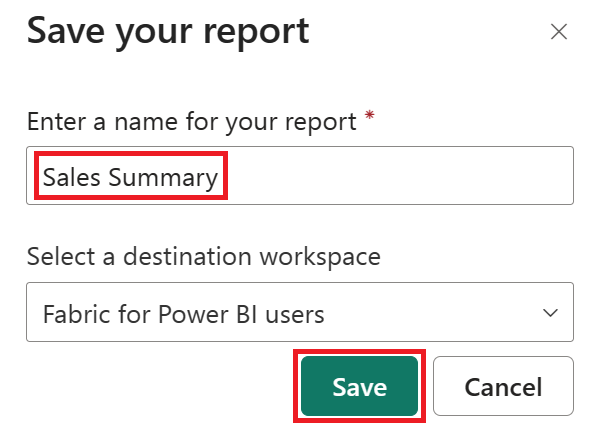
In the Save your report dialog box, type Sales Summary in the Enter a name for your report field. Select Save once complete.

You can learn more about quick create.
Related content
Congratulations on completing the tutorial! If you created a workspace for the tutorial, you can choose to delete it now. Alternatively, you can remove the individual items that were created during the tutorial.
We hope this tutorial has shown how Power BI users can easily provide insights into data at any level of scale with Microsoft Fabric.
Feedback
Coming soon: Throughout 2024 we will be phasing out GitHub Issues as the feedback mechanism for content and replacing it with a new feedback system. For more information see: https://aka.ms/ContentUserFeedback.
Submit and view feedback for