Visualize dotnet counters from the Visual Studio profiler
The .NET Counters tool allows you to visualize dotnet counters over time right from within the Visual Studio profiler.
Note
The .NET Counters tool requires Visual Studio 2019 version 16.7 or later and targets .NET Core 3.0+ and .NET 5+.
For additional information on learning to use the .NET Counters tool effectively, see Case study: Isolate a performance issue.
Setup
Open the Performance Profiler (Alt + F2 or Debug -> Performance Profiler) in Visual Studio.
Select the .NET Counters check box.

Click the Start button to run the tool.
For more information on how to optimize tool performance, see Optimizing Profiler settings.
Understand your data
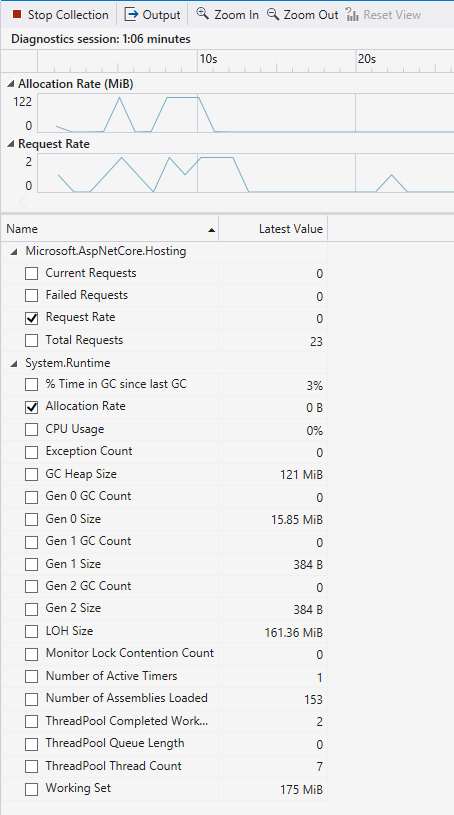
While the tool is initially collecting data, you can see the live values of dotnet counters.

You can also view graphs of the counters by selecting the checkbox next to the counter names. You can display the graphs of multiple counters at a time.
Once you are done exercising your app and collecting data, you can stop collection for an even more detailed report. To do this, press the Stop Collection button.
Once the report loads, you should see a finalized report similar to the one shown below.

The report shows you the following values:
- Min - The minimum value for that counter in the selected time range.
- Max - The maximum value for that counter in the selected time range.
- Average - The average value for that counter in the selected time range.
You can filter or add columns in the table by right clicking the column headings and selecting a heading.

You can also view graphs in the detailed report by selecting the checkboxes next to counters. The data in the tables represents the values of the entire duration of your collected trace by default. To filter down the data to a specific time range, click and drag on the graphs.

The table updates to relevant values for the time selected in the graphs. Use the Clear Selection button to reset the selected time range to the entire trace.