Note
Access to this page requires authorization. You can try signing in or changing directories.
Access to this page requires authorization. You can try changing directories.
Important
AI Runtime for single-node tasks is in Public Preview. The distributed training API for multi-GPU workloads remain in Beta.
This page describes how to use MLflow, view logs, manage model checkpoints, and monitor GPU resources on AI Runtime.
MLflow integration
AI Runtime integrates natively with MLflow for experiment tracking, model logging, and metric visualization.
Setup recommendations:
Upgrade MLflow to version 3.7 or newer and follow the deep learning workflow patterns.
Enable autologging for PyTorch Lightning:
import mlflow
mlflow.pytorch.autolog()
Customize your MLflow run name by encapsulating your model training code within the
mlflow.start_run()API scope. This gives you control over the run name and enables you to restart from a previous run.You can customize the run name using therun_nameparameter inmlflow.start_run(run_name="your-custom-name")or in third-party libraries that support MLflow (for example, Hugging Face Transformers). Otherwise, the default run name isjobTaskRun-xxxxx.from transformers import TrainingArguments args = TrainingArguments( report_to="mlflow", run_name="llama7b-sft-lr3e5", # <-- MLflow run name logging_steps=50, )The Serverless GPU API automatically launches an MLflow experiment with default name
/Users/{WORKSPACE_USER}/{get_notebook_name()}. Users can overwrite it with the environment variableMLFLOW_EXPERIMENT_NAME.Always use absolute paths for theMLFLOW_EXPERIMENT_NAMEenvironment variable:import os os.environ["MLFLOW_EXPERIMENT_NAME"] = "/Users/<username>/my-experiment"Resume previous training by setting the
MLFLOW_RUN_IDfrom the earlier run:mlflow.start_run(run_id="<previous-run-id>")Set the
stepparameter inMLFlowLoggerto reasonable batch numbers. MLflow has a limit of 10 million metric steps — logging every single batch on large training runs can hit this limit. See Resource limits.
Viewing logs
- Notebook output — Standard output and errors from your training code appear in the notebook cell output.
- MLflow logs — The MLflow experiment UI displays training metrics, parameters, and artifacts.
Model checkpointing
For distributed training, save and load model checkpoints asynchronously to Unity Catalog volumes, which provide the same governance as other Unity Catalog objects. Use UCVolumeWriter and UCVolumeReader from the serverless_gpu.data package with the Torch Distributed Checkpoint (DCP) API. These storage backends stage all I/O through a fast local directory (/tmp, which is NVMe-backed on serverless GPU nodes) and upload to or download from the Unity Catalog volume, which is faster than writing checkpoint shards directly to the FUSE mount. Metadata atomicity is preserved: the writer publishes the .metadata file only after its data shards finish uploading.
Note
UCVolumeWriter, UCVolumeReader, and UCVolumeDataset require GPU environment 5 or above (Serverless GPU Python API 0.5.16+).
Checkpoint often enough to limit lost work after an interruption, but not so often that I/O overhead slows training. Aim for one checkpoint every 30 minutes to an hour, and tune the interval based on your step time and checkpoint size.
To upload checkpoints in the background while training continues, pass a UCVolumeWriter as the storage_writer to dcp.async_save. Asynchronous saves require a CPU backend on the process group, so initialize it with torch.distributed.init_process_group(backend="cpu:gloo,cuda:nccl", ...):
import torch.distributed.checkpoint as dcp
from serverless_gpu.data import UCVolumeWriter

checkpoint_path = "/Volumes/my_catalog/my_schema/model/checkpoints"
writer = UCVolumeWriter(checkpoint_path)

future = dcp.async_save(state_dict, storage_writer=writer)
# ...continue training...
future.result()  # blocks until the upload lands on the UC volume
Load a checkpoint with UCVolumeReader:
from serverless_gpu.data import UCVolumeReader

reader = UCVolumeReader(checkpoint_path)
dcp.load(state_dict, storage_reader=reader)
Data pipeline checkpointing
A model checkpoint captures model and optimizer state, but not the position of your data pipeline within the dataset, so a resumed run cannot fast-forward to the exact sample where it stopped. Account for this in how you resume: restart from an epoch boundary, or track processed samples or shards in your own training state so you can skip them on resume.
Monitor GPU resources
Use the GPU resources pane to monitor GPU health and utilization while your code runs on AI Runtime. The pane supports both single-node and multi-node workloads.
To open the pane, connect your notebook to AI Runtime, then click ![]() GPU resources in the right side pane.
GPU resources in the right side pane.
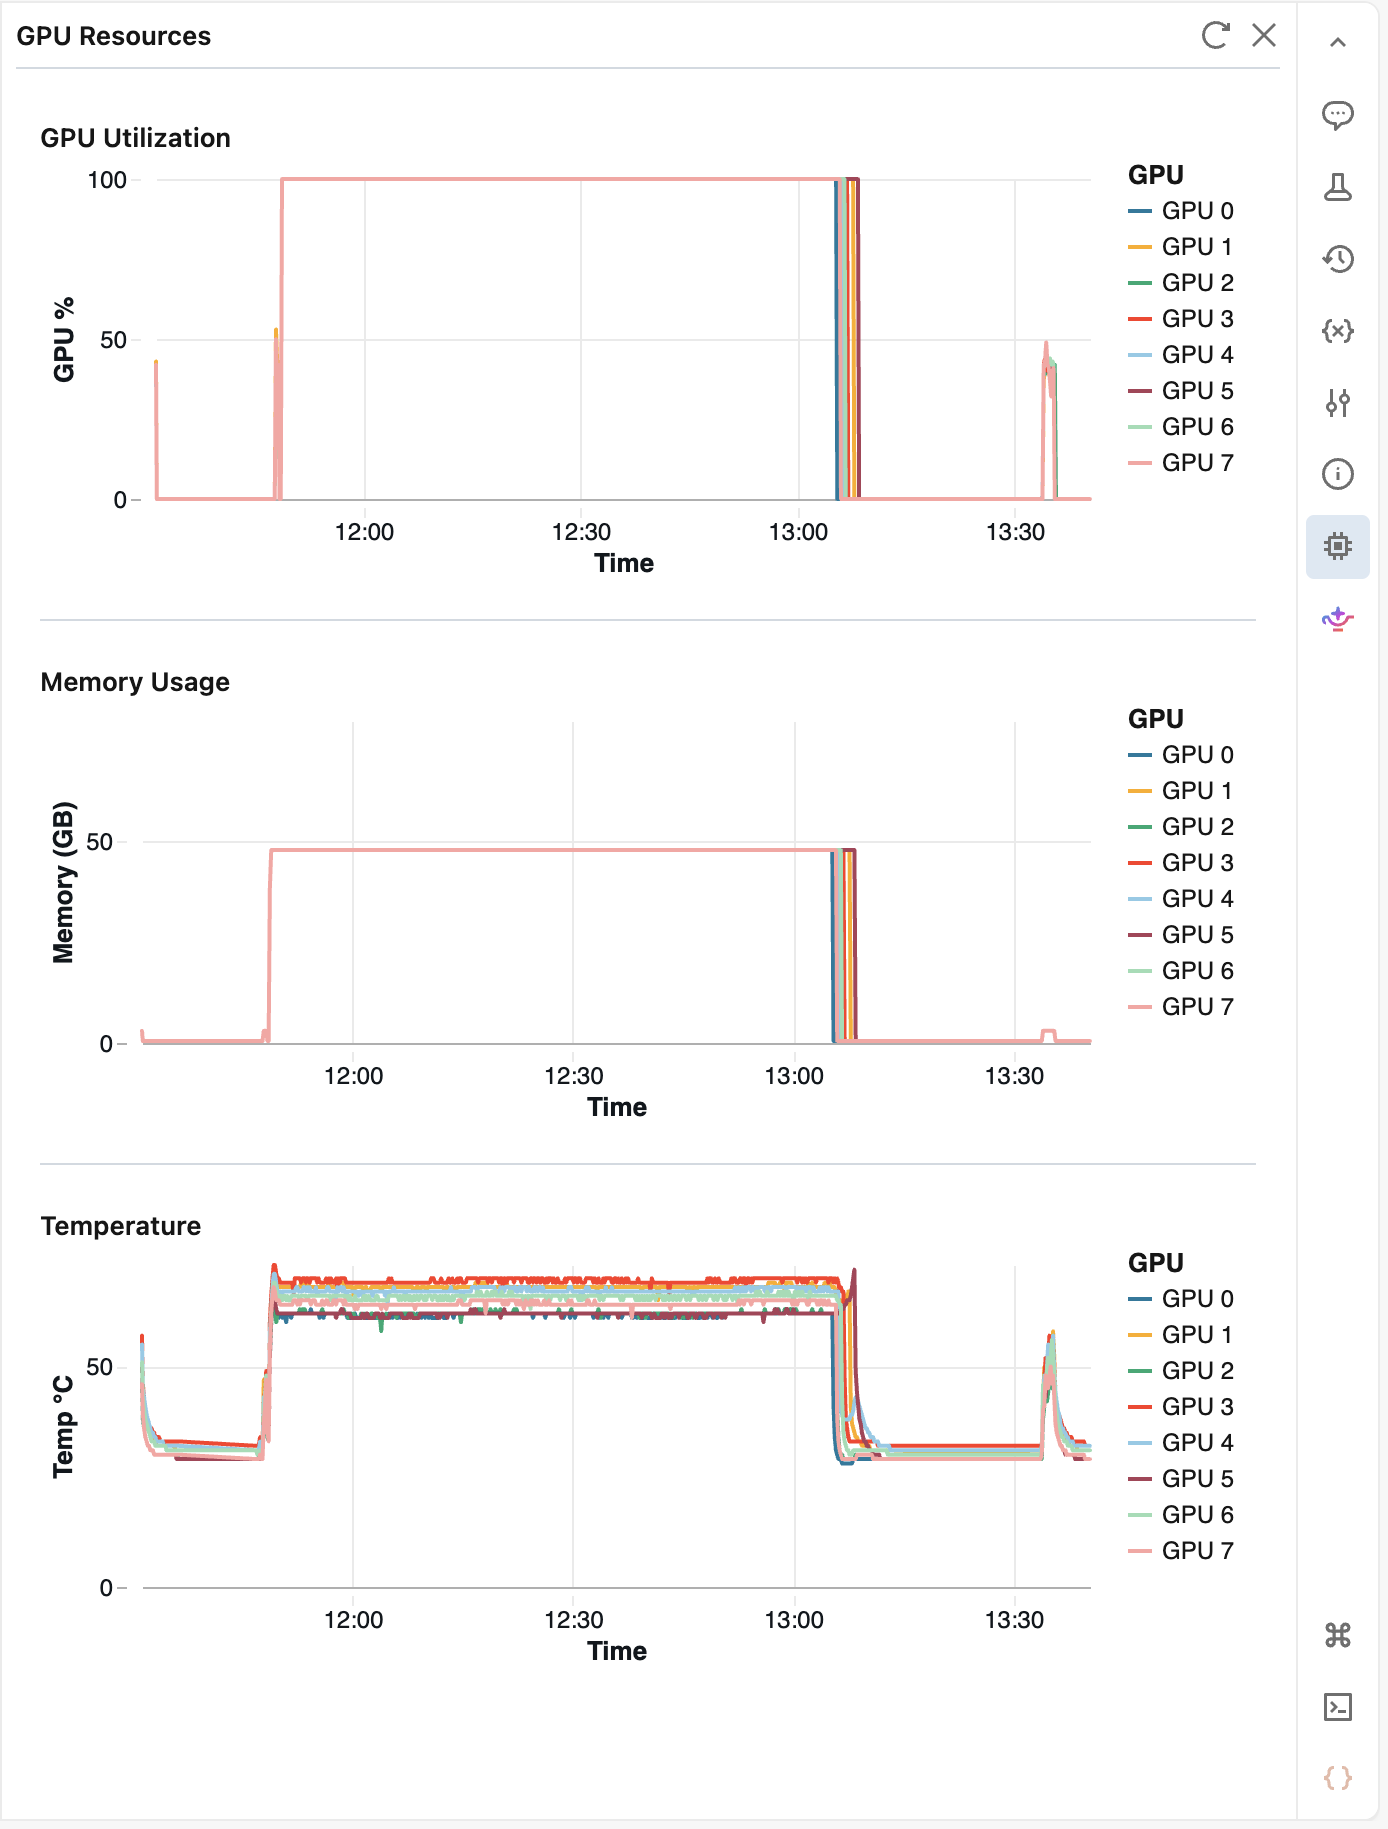
The pane displays the following metrics for each GPU:
- GPU utilization percentage
- GPU memory usage
- Temperature
The pane polls metrics every 10 seconds and retains up to 2 hours of history. Click ![]() Refresh to fetch the latest values immediately. After 5 minutes of inactivity, the pane pauses; reopen it to resume monitoring.
Refresh to fetch the latest values immediately. After 5 minutes of inactivity, the pane pauses; reopen it to resume monitoring.
Multi-user collaboration
- To ensure all users can access shared code (for example, helper modules or environment YAML files), store them in
/Workspace/Sharedinstead of user-specific folders like/Workspace/Users/<your_email>/. - For code that is in active development, use Git folders in user-specific folders
/Workspace/Users/<your_email>/and push to remote Git repos. This allows multiple users to have a user-specific clone and branch, while still using a remote Git repo for version control. See best practices for using Git on Databricks. - Collaborators can share and comment on notebooks.
Global limits in Azure Databricks
See Resource limits.